Despite the recent price swings and Bitcoin losing nearly ,000 of value in a week, the number of addresses containing at least 1 BTC has marked a new all-time high. Also referred to as “wholecoiners,” those network addresses have reached 823,000.BTC ‘Wholecoiners’ At ATHThe data analytics company Glassnode recently published information regarding the so-called wholecoiners. Meaning, network addresses containing at least one whole coin of the primary cryptocurrency.Bitcoin Price/Number of BTC Addresses >1BTC. Source: GlassnodeAs the graph above reveals, these addresses have been continuously increasing since the metric has been tracked. Aside from a few sharp increases in early 2016, prior to the second BTC halving, and in late 2017 when Bitcoin attracted mass attention and reached its
Topics:
Jordan Lyanchev considers the following as important: AA News, Bitcoin (BTC) Price, BTCEUR, BTCGBP, btcusd, btcusdt
This could be interesting, too:
Chayanika Deka writes Yuga Labs Secures Major Win as SEC Closes Investigation Without Charges
Andrew Throuvalas writes Bitcoin Soars Back To ,000 After BlackRock CEO Says “Buy The Dip”
Chayanika Deka writes XRP, SOL, and ADA Inclusion in US Crypto Reserve Pushes Traders on Edge
Chayanika Deka writes Why Arthur Hayes Is Bullish on Bitcoin Under Trump’s Economic Strategy
Despite the recent price swings and Bitcoin losing nearly $2,000 of value in a week, the number of addresses containing at least 1 BTC has marked a new all-time high. Also referred to as “wholecoiners,” those network addresses have reached 823,000.
BTC ‘Wholecoiners’ At ATH
The data analytics company Glassnode recently published information regarding the so-called wholecoiners. Meaning, network addresses containing at least one whole coin of the primary cryptocurrency.
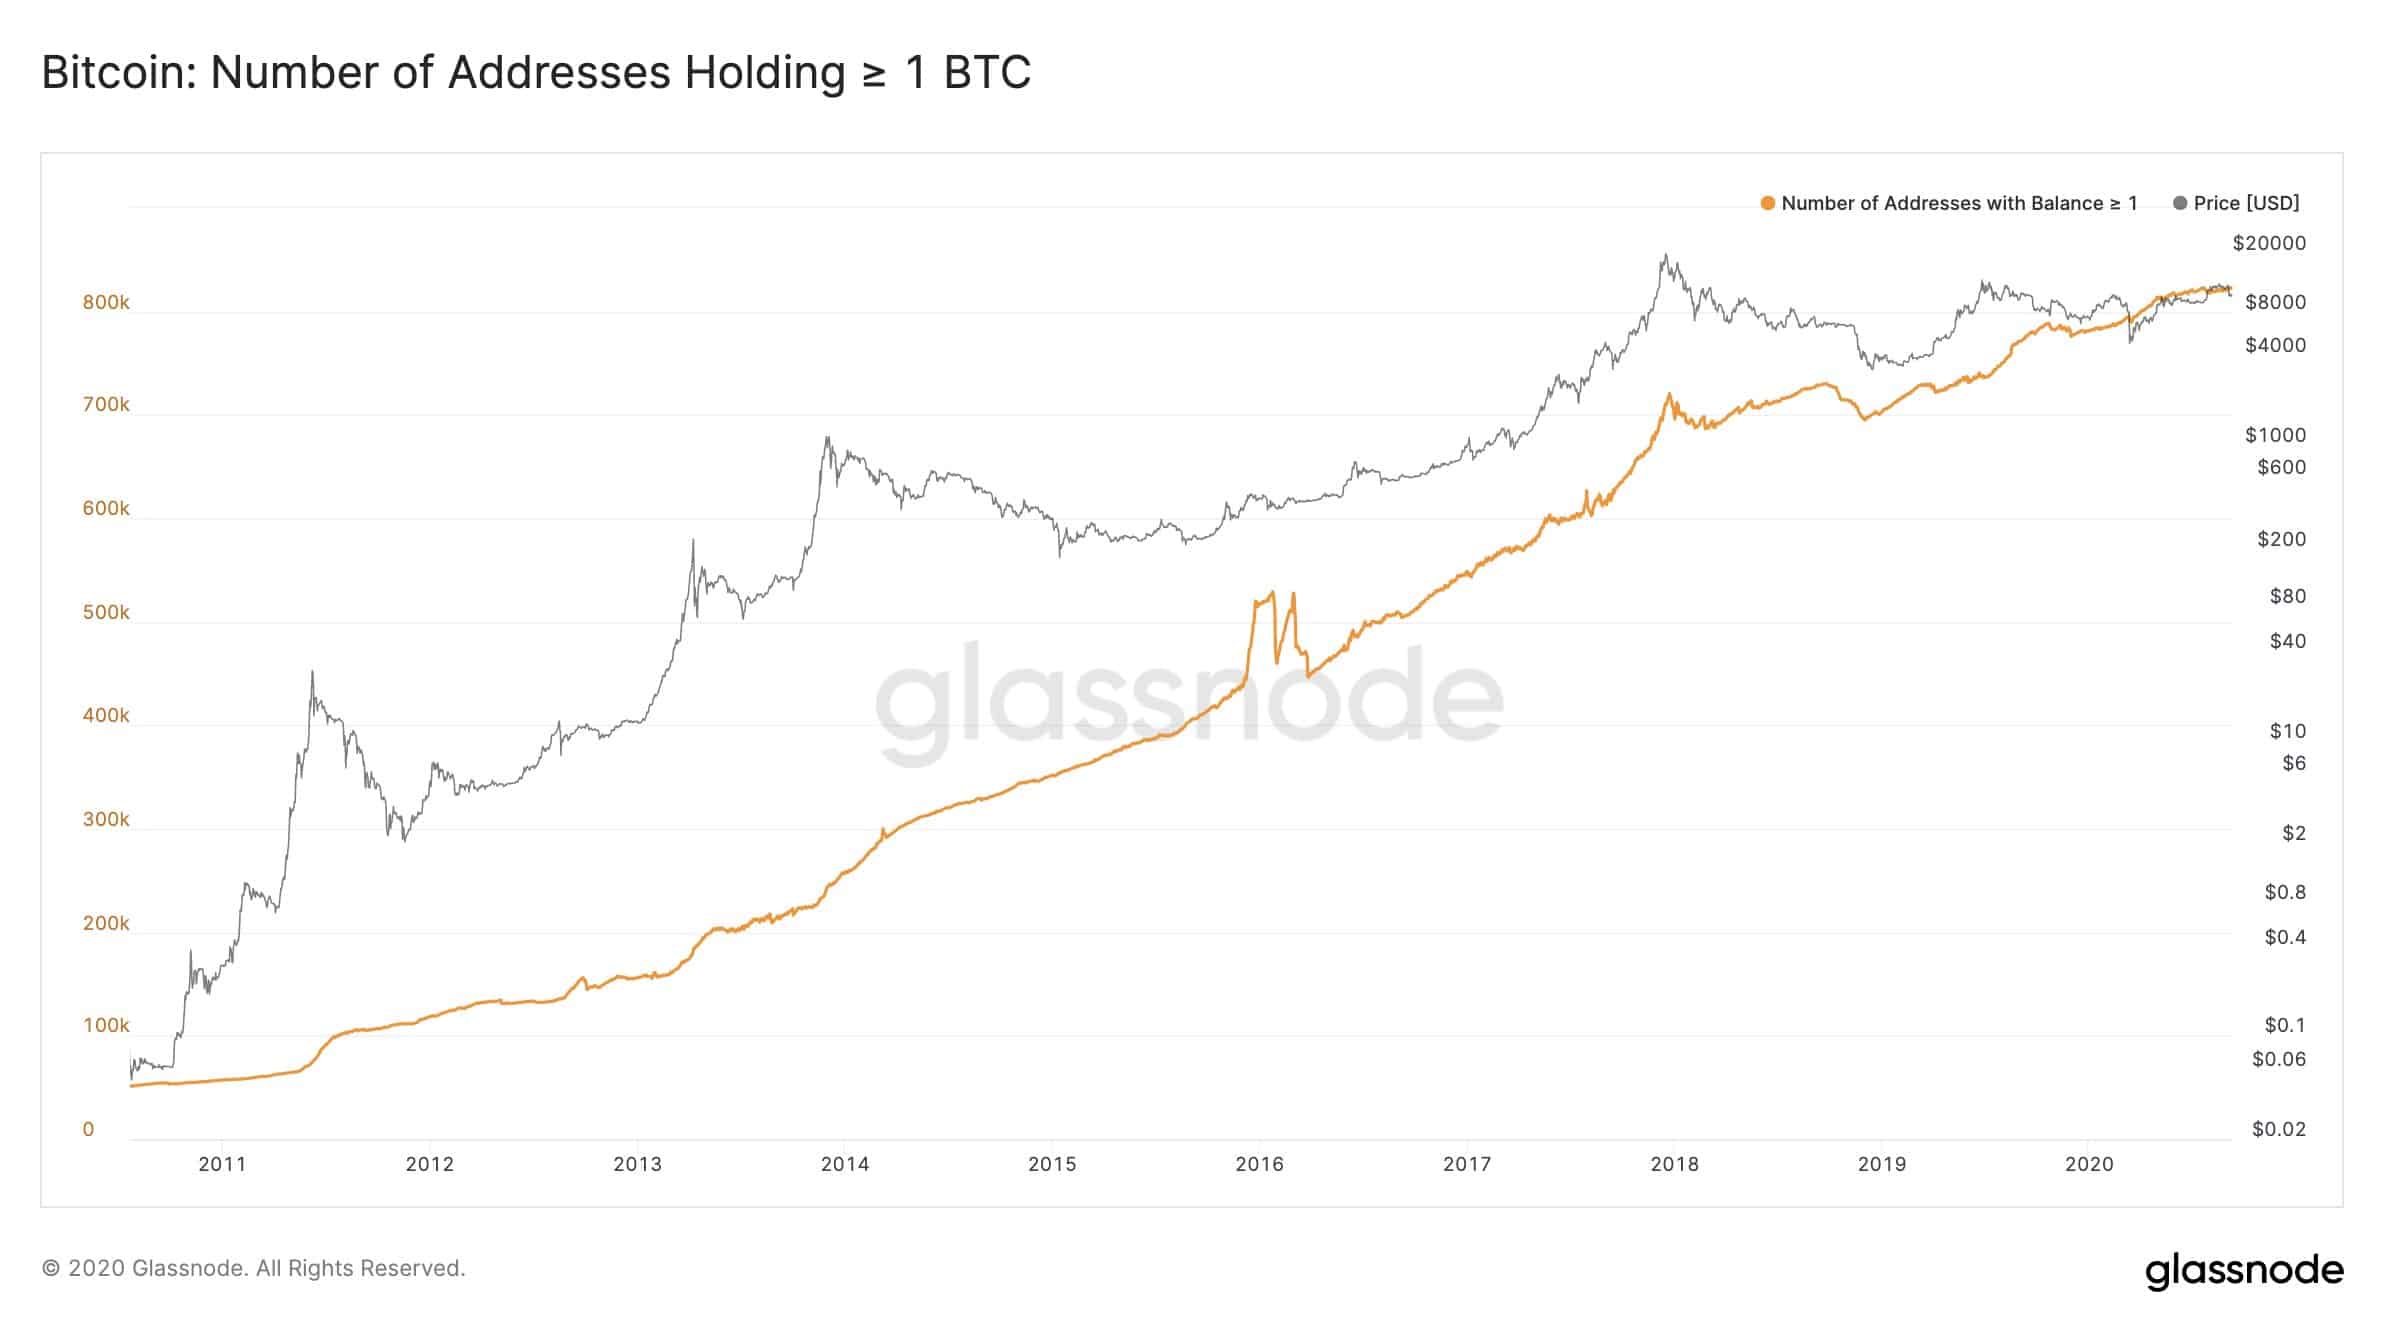
As the graph above reveals, these addresses have been continuously increasing since the metric has been tracked. Aside from a few sharp increases in early 2016, prior to the second BTC halving, and in late 2017 when Bitcoin attracted mass attention and reached its all-time high of $20,000, the rise has been quite gradual.
One of the few steep declines of this metric occurred in late 2018. It coincided with the end of the year-long bear market BTC entered following its 2017 peak. As the asset was decreasing in value to its bottom of about $3,100, the number of addresses with over 1 BTC followed and dropped below 700,000.
However, the trend reversed rather sharply. The number of wholecoiners, similarly to Bitcoin’s price, started to gain traction once again. Consequently, the continuous increase resulted in registering a fresh all-time high yesterday when the metric closed “the day above 823,000 for the first time.”
According to Glassnode, these developments indicate that Bitcoin investors are “unfazed” by the short-term price swings and are displaying increased interest in the asset.
BTC Network Still Healthy, Despite Recent Price Drop
Speaking of some of the price swings, Glassnode further explored BTC’s network health during and after the recent movements when the cryptocurrency dropped from $12,000 to below $10,000 in a few days.
The company’s Glassnode Network Index (GNI) tracks several aspects of BTC’s performance to determine a score ranging from 0, being the lowest possible, to 100 – the highest. GNI measures metrics such as network activity and growth, liquidity on exchanges, transactions, investor sentiment, investor behavior, etc.
Glassnode said that the investor sentiment and behavior decreased last week, which is somewhat unsurprising, giving the adverse price developments. Yet, the high volatility led to increased liquidity. The network growth and activity also surged last week.
The company concluded that in total, the GNI index remained “strong” at 60 points. This is a 3.2% decrease from the average number for August (62%). However, the GNI index displayed 35 at the start of 2020, meaning that it’s YTD increase is 71.4%.