Stellar surged by a total of 36% over the past 30-days as it reaches the %excerpt%.070 level.The cryptocurrency is now holding the support at %excerpt%.066, and it remains above a rising trend line.Against Bitcoin, XLM suffered in May after falling from 850 SAT, but the bulls are in a battle to remain above the 700 SAT support.Key Support & Resistance LevelsXLM/USD:Support: %excerpt%.066, %excerpt%.061, %excerpt%.0588.Resistance:%excerpt%.071, %excerpt%.0757, %excerpt%.08.XLM/BTC:Support: 700 SAT, 680 SAT, 655 SAT.Resistance: 720 SAT, 750 SAT, 780 SAT.XLM/USD: Stellar Bulls Defending %excerpt%.66 As The Try To Push Beyond May HighsStellar ended the month of April off with a considerable surge as it managed to rebound from the rising trend line at around %excerpt%.045 and push higher. It went on to climb as high as %excerpt%.075 by the end of the month.During May
Topics:
Yaz Sheikh considers the following as important: Price Analysis, Stellar (XLM) Price, XLMBTC, XLMUSD
This could be interesting, too:
Jordan Lyanchev writes Stellar (XLM) Explodes by 30% in 2 Days, Bitcoin (BTC) Stable at K (Weekend Watch)
CryptoVizArt writes ETH’s Path to K Involves Maintaining This Critical Support (Ethereum Price Analysis)
Duo Nine writes Crypto Price Analysis June-29: ETH, XRP, ADA, DOGE, and DOT
Duo Nine writes Crypto Price Analysis June-15: ETH, XRP, ADA, DOGE, and DOT
- Stellar surged by a total of 36% over the past 30-days as it reaches the $0.070 level.
- The cryptocurrency is now holding the support at $0.066, and it remains above a rising trend line.
- Against Bitcoin, XLM suffered in May after falling from 850 SAT, but the bulls are in a battle to remain above the 700 SAT support.
Key Support & Resistance Levels
XLM/USD:
Support: $0.066, $0.061, $0.0588.
Resistance:$0.071, $0.0757, $0.08.
XLM/BTC:
Support: 700 SAT, 680 SAT, 655 SAT.
Resistance: 720 SAT, 750 SAT, 780 SAT.
XLM/USD: Stellar Bulls Defending $0.66 As The Try To Push Beyond May Highs
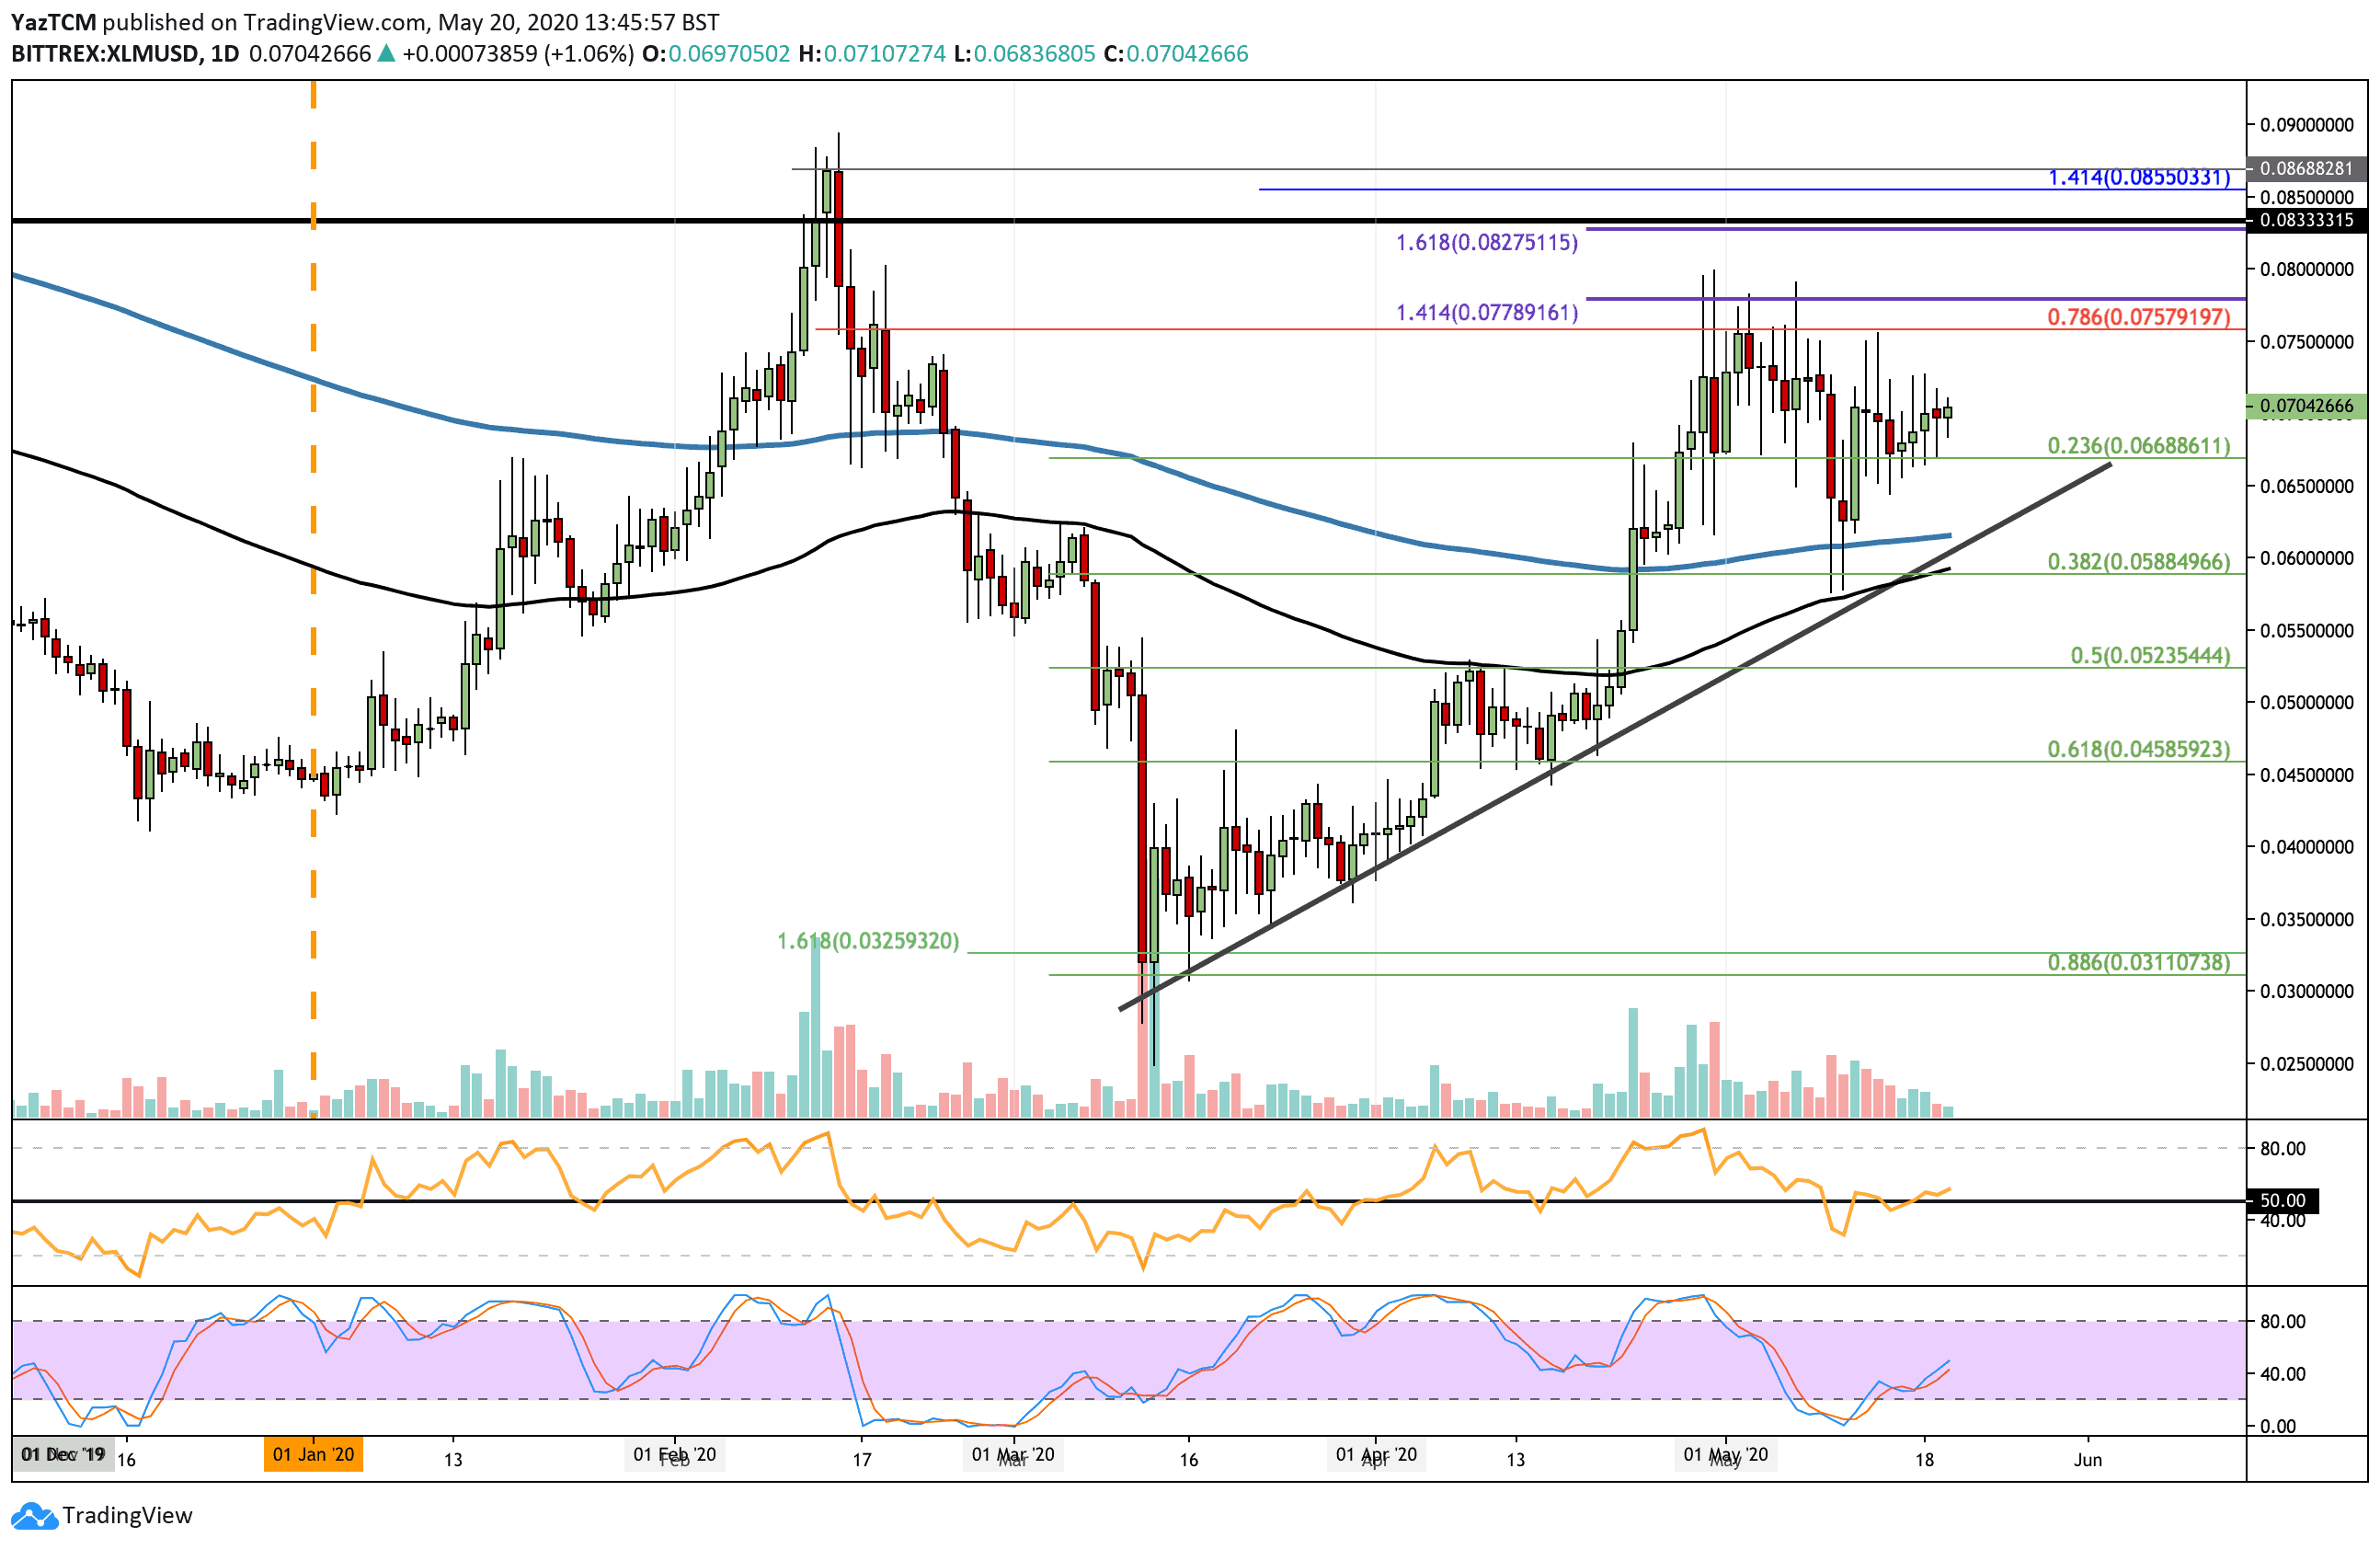
Stellar ended the month of April off with a considerable surge as it managed to rebound from the rising trend line at around $0.045 and push higher. It went on to climb as high as $0.075 by the end of the month.
During May 2020, XLM struggled to continue this bullish run as it failed to overcome the resistance at $0.0757 (bearish .786 Fib Retracement). It went on to drop lower from here but managed to rebound from the support at $0.058 (.382 Fib Retracement).
Since the rebound, XLM has traded sideways over the last 8-days as it remains above $0.066 (.236 Fib Retracement) but fails to break $.075.
XLM-USD Short Term Price Prediction
Looking ahead, if the buyers can continue to defend the $0.0668 support, the first level of resistance to overcome is located at $0.071. Above this, resistance can be found at $0.0757 (bearish .786 Fib Retracement), $0.08, and $0.082 (1.618 Fib Extension). This is followed by added resistance at $0.085 and $0.09.
On the other side, if the sellers push beneath the $0.066 support, added support is located at $0.061 (200-days EMA) and the rising trend line. Beneath this, support is at $0.0588 (.382 Fib Retracement & 100-days EMA), $0.052 (.5 Fib Retracement), and $0.05.
The RSI is trading along the 50 line as indecision looms in the market. For a push toward the May highs, the RSI must push above 50 and start to climb to show increasing bullish momentum.
The Stochastic RSI is in oversold conditions and is primed for a bullish crossover signal that should help push XLM above $0.07.
XLM/BTC: Buyers Battling To Defend 700 SAT
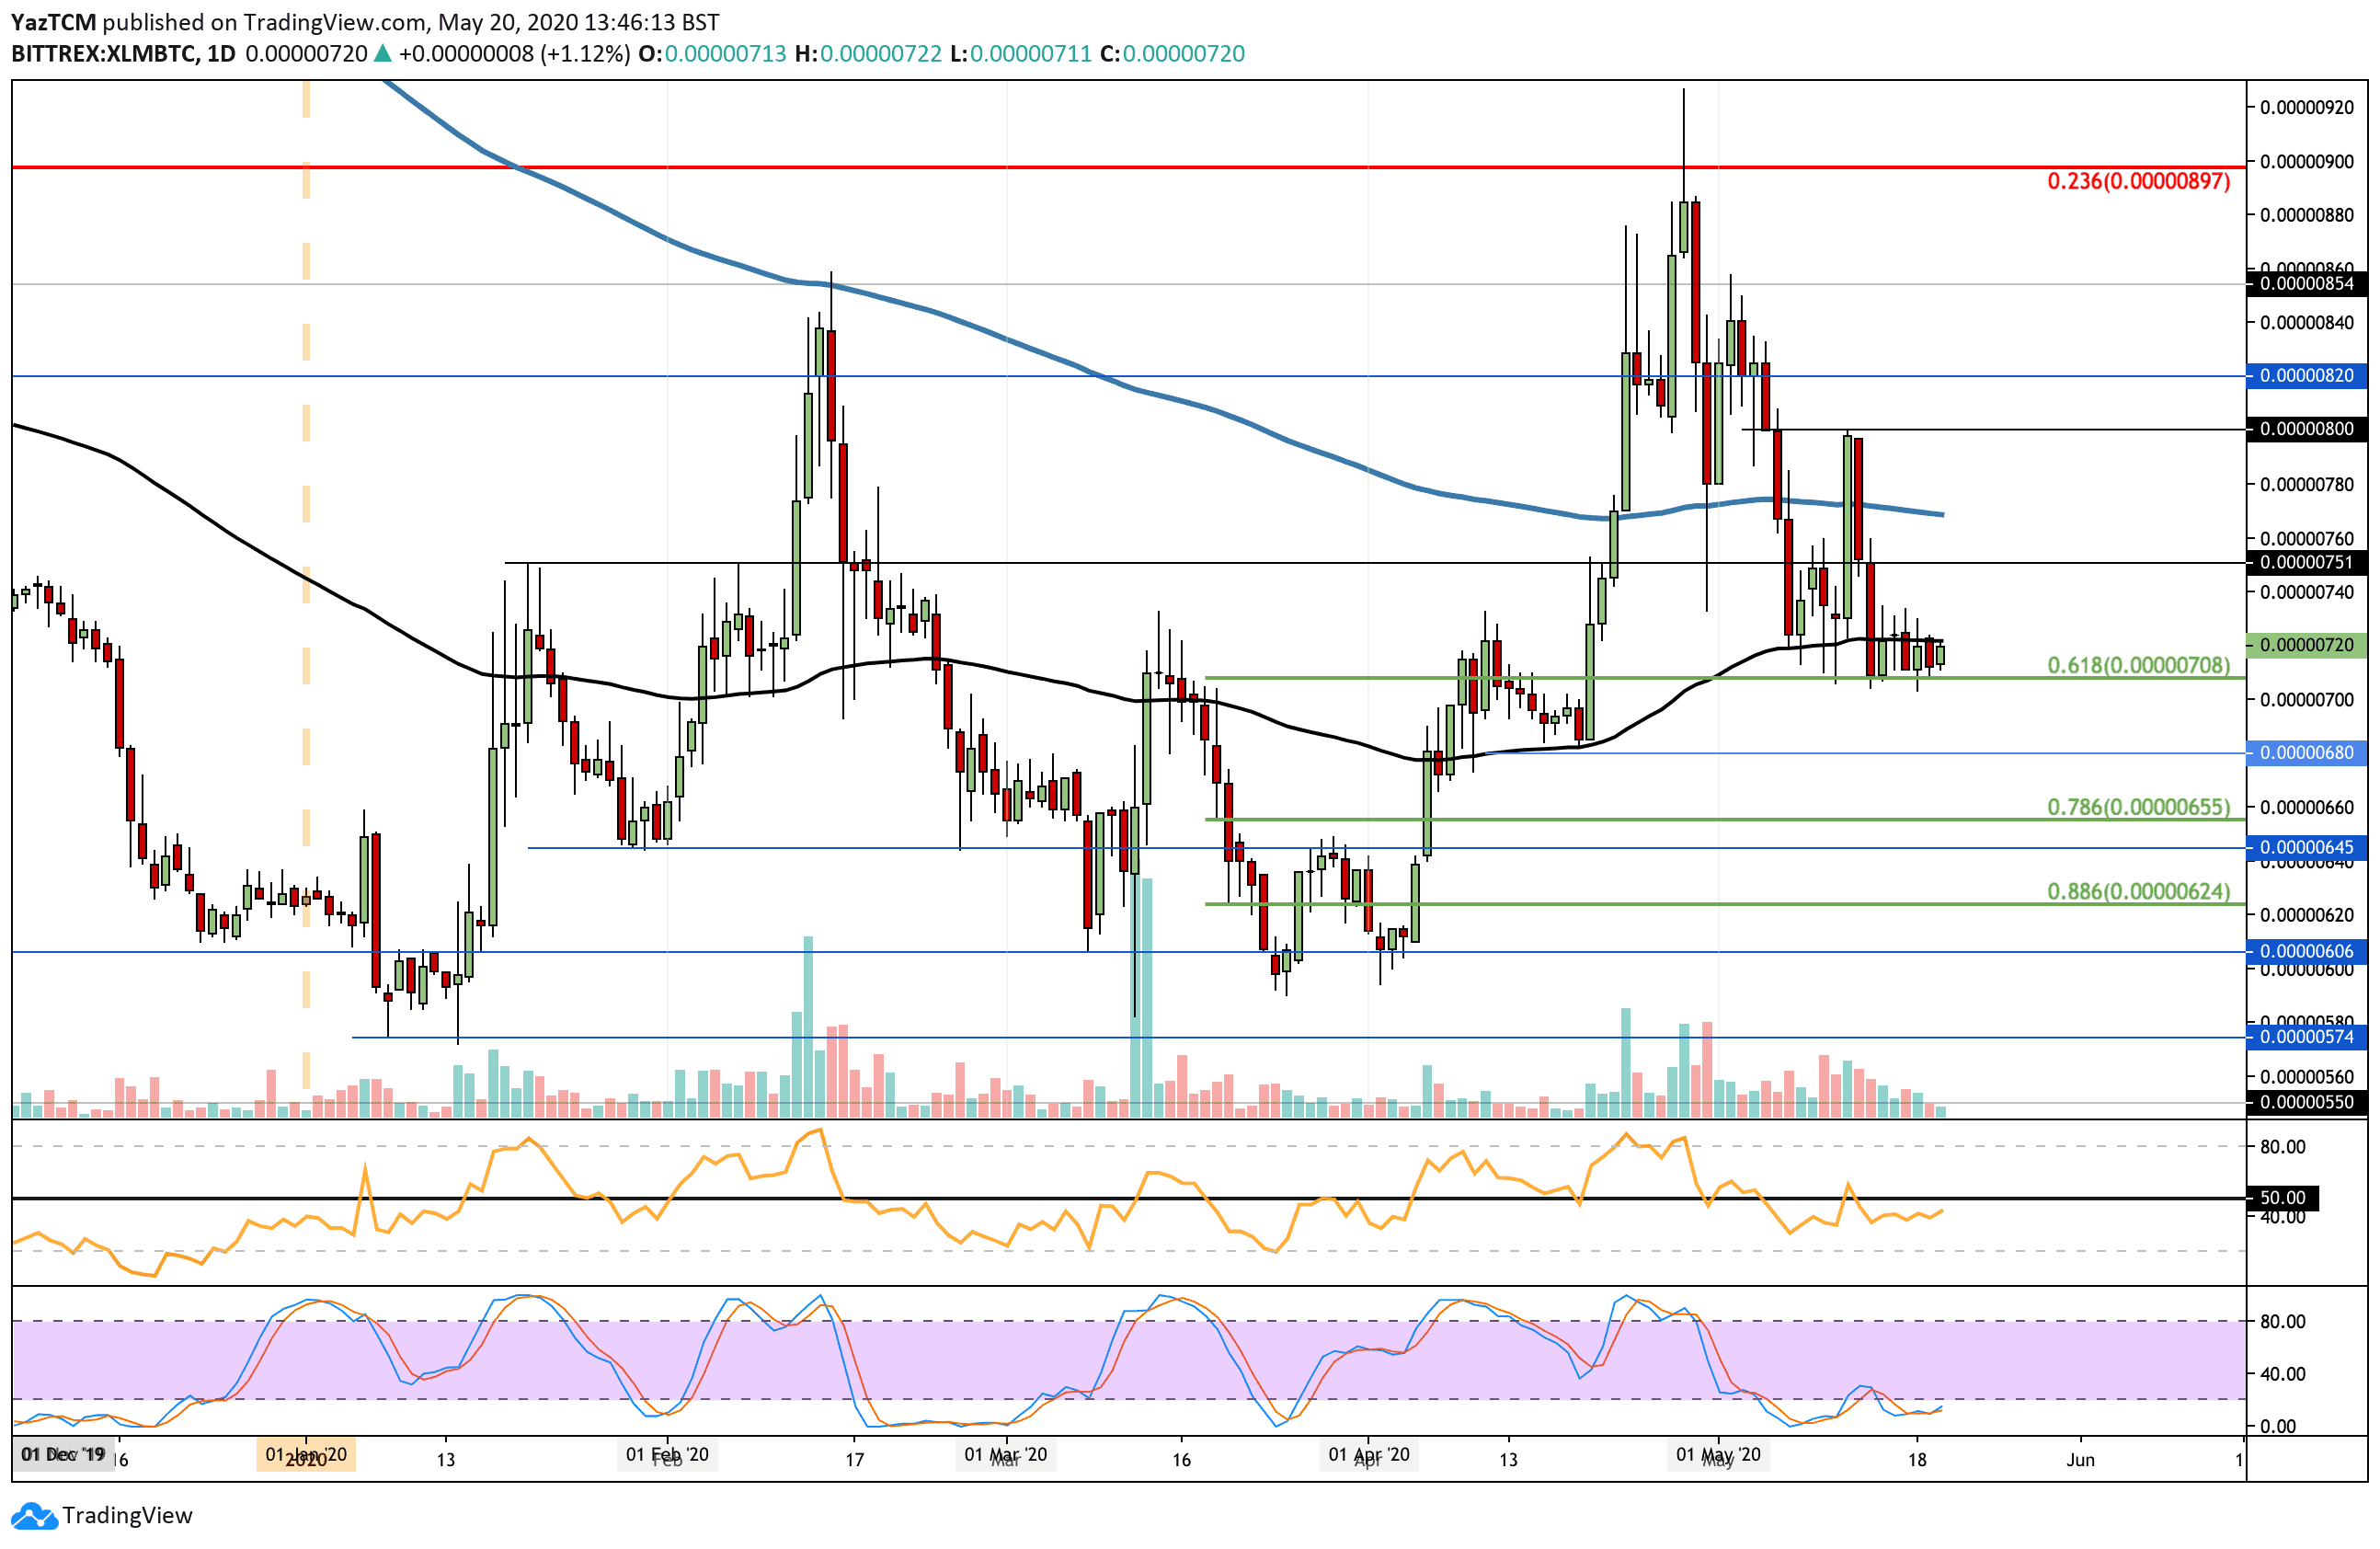
Against Bitcoin, XLM had reached a high-day closing price of around 880 SAT toward the end of April 2020. In May, XLM dropped from around 860 SAT and went on to fall beneath the 200-days EMA and the 100-days EMA to reach the current support at 708 SAT (.618 Fib Retracement).
The buyers have been battling to keep XLM above this level for the past 11-days of trading and have been successful in doing so this far.
XLM-BTC Short Term Price Prediction
If the sellers do eventually penetrate beneath 708 SAT and push below 700 SAT, support can be found at 680 SAT, 655 SAT (.786 Fib Retracement), and 645 SAT. This is followed by support at 624 SAT and 600 SAT.
On the other side, the first level of resistance lies at 720 SAT (100-days EMA). Above this, resistance can be found at 750 SAT, 780 SAT (200-days EMA), and 800 SAT.
The RSI is beneath the 50 line to show weak bearish momentum within the market. For a rebound from 708 SAT to be seen, the RSI must push above 50 to show bullish momentum within the market.