Chainlink suffered a steep 9% price drop over the past 24 hours, completing a 35% descent from its all-time high reached on August 16 at around .Against Bitcoin, LINK is also on the decline as the buyers attempt to defend the 0.00119 BTC support level today.LINK/USD – Bearish Momentum Starts To IncreaseKey Support Levels: .35, .60, .61.Key Resistance Levels: , .10, .LINK broke toward the upside of a symmetrical triangle pattern at the end of August. However, it was unable to build the necessary support above .50.In the first days of September, LINK headed lower as it penetrated beneath support at (.382 Fib) and continued even lower, until finding support at .60 (downside 1.272 Fib Extension). As of writing these lines, LINK recovered a bit above . Beneath
Topics:
Yaz Sheikh considers the following as important: Chainlink (LINK) Price, LINKBTC, LINKUSD, Price Analysis
This could be interesting, too:
Chayanika Deka writes Chainlink’s MVRV Ratio Signals Selling Exhaustion: What’s Next for LINK?
Chayanika Deka writes Whale and Shark Activity Pushes Chainlink (LINK) Past For the First Time in 37 Months
Martin Young writes Chainlink Partners With Major Finance Firms on AI, Oracles, and Blockchain Data Solution Project
Dimitar Dzhondzhorov writes Top 10 Cryptocurrencies by ‘Notable Development Activity’ (Santiment)
- Chainlink suffered a steep 9% price drop over the past 24 hours, completing a 35% descent from its all-time high reached on August 16 at around $20.
- Against Bitcoin, LINK is also on the decline as the buyers attempt to defend the 0.00119 BTC support level today.
LINK/USD – Bearish Momentum Starts To Increase
Key Support Levels: $13.35, $12.60, $11.61.
Key Resistance Levels: $14, $15.10, $16.
LINK broke toward the upside of a symmetrical triangle pattern at the end of August. However, it was unable to build the necessary support above $17.50.
In the first days of September, LINK headed lower as it penetrated beneath support at $15 (.382 Fib) and continued even lower, until finding support at $12.60 (downside 1.272 Fib Extension). As of writing these lines, LINK recovered a bit above $13. Beneath support turned resistance level at $13.35, provided by a .5 Fib Retracement level.
A 4-hour closing candle beneath the $12.60 level might signal a further decline ahead for LINK. Possible targets can be around the $10 mark.
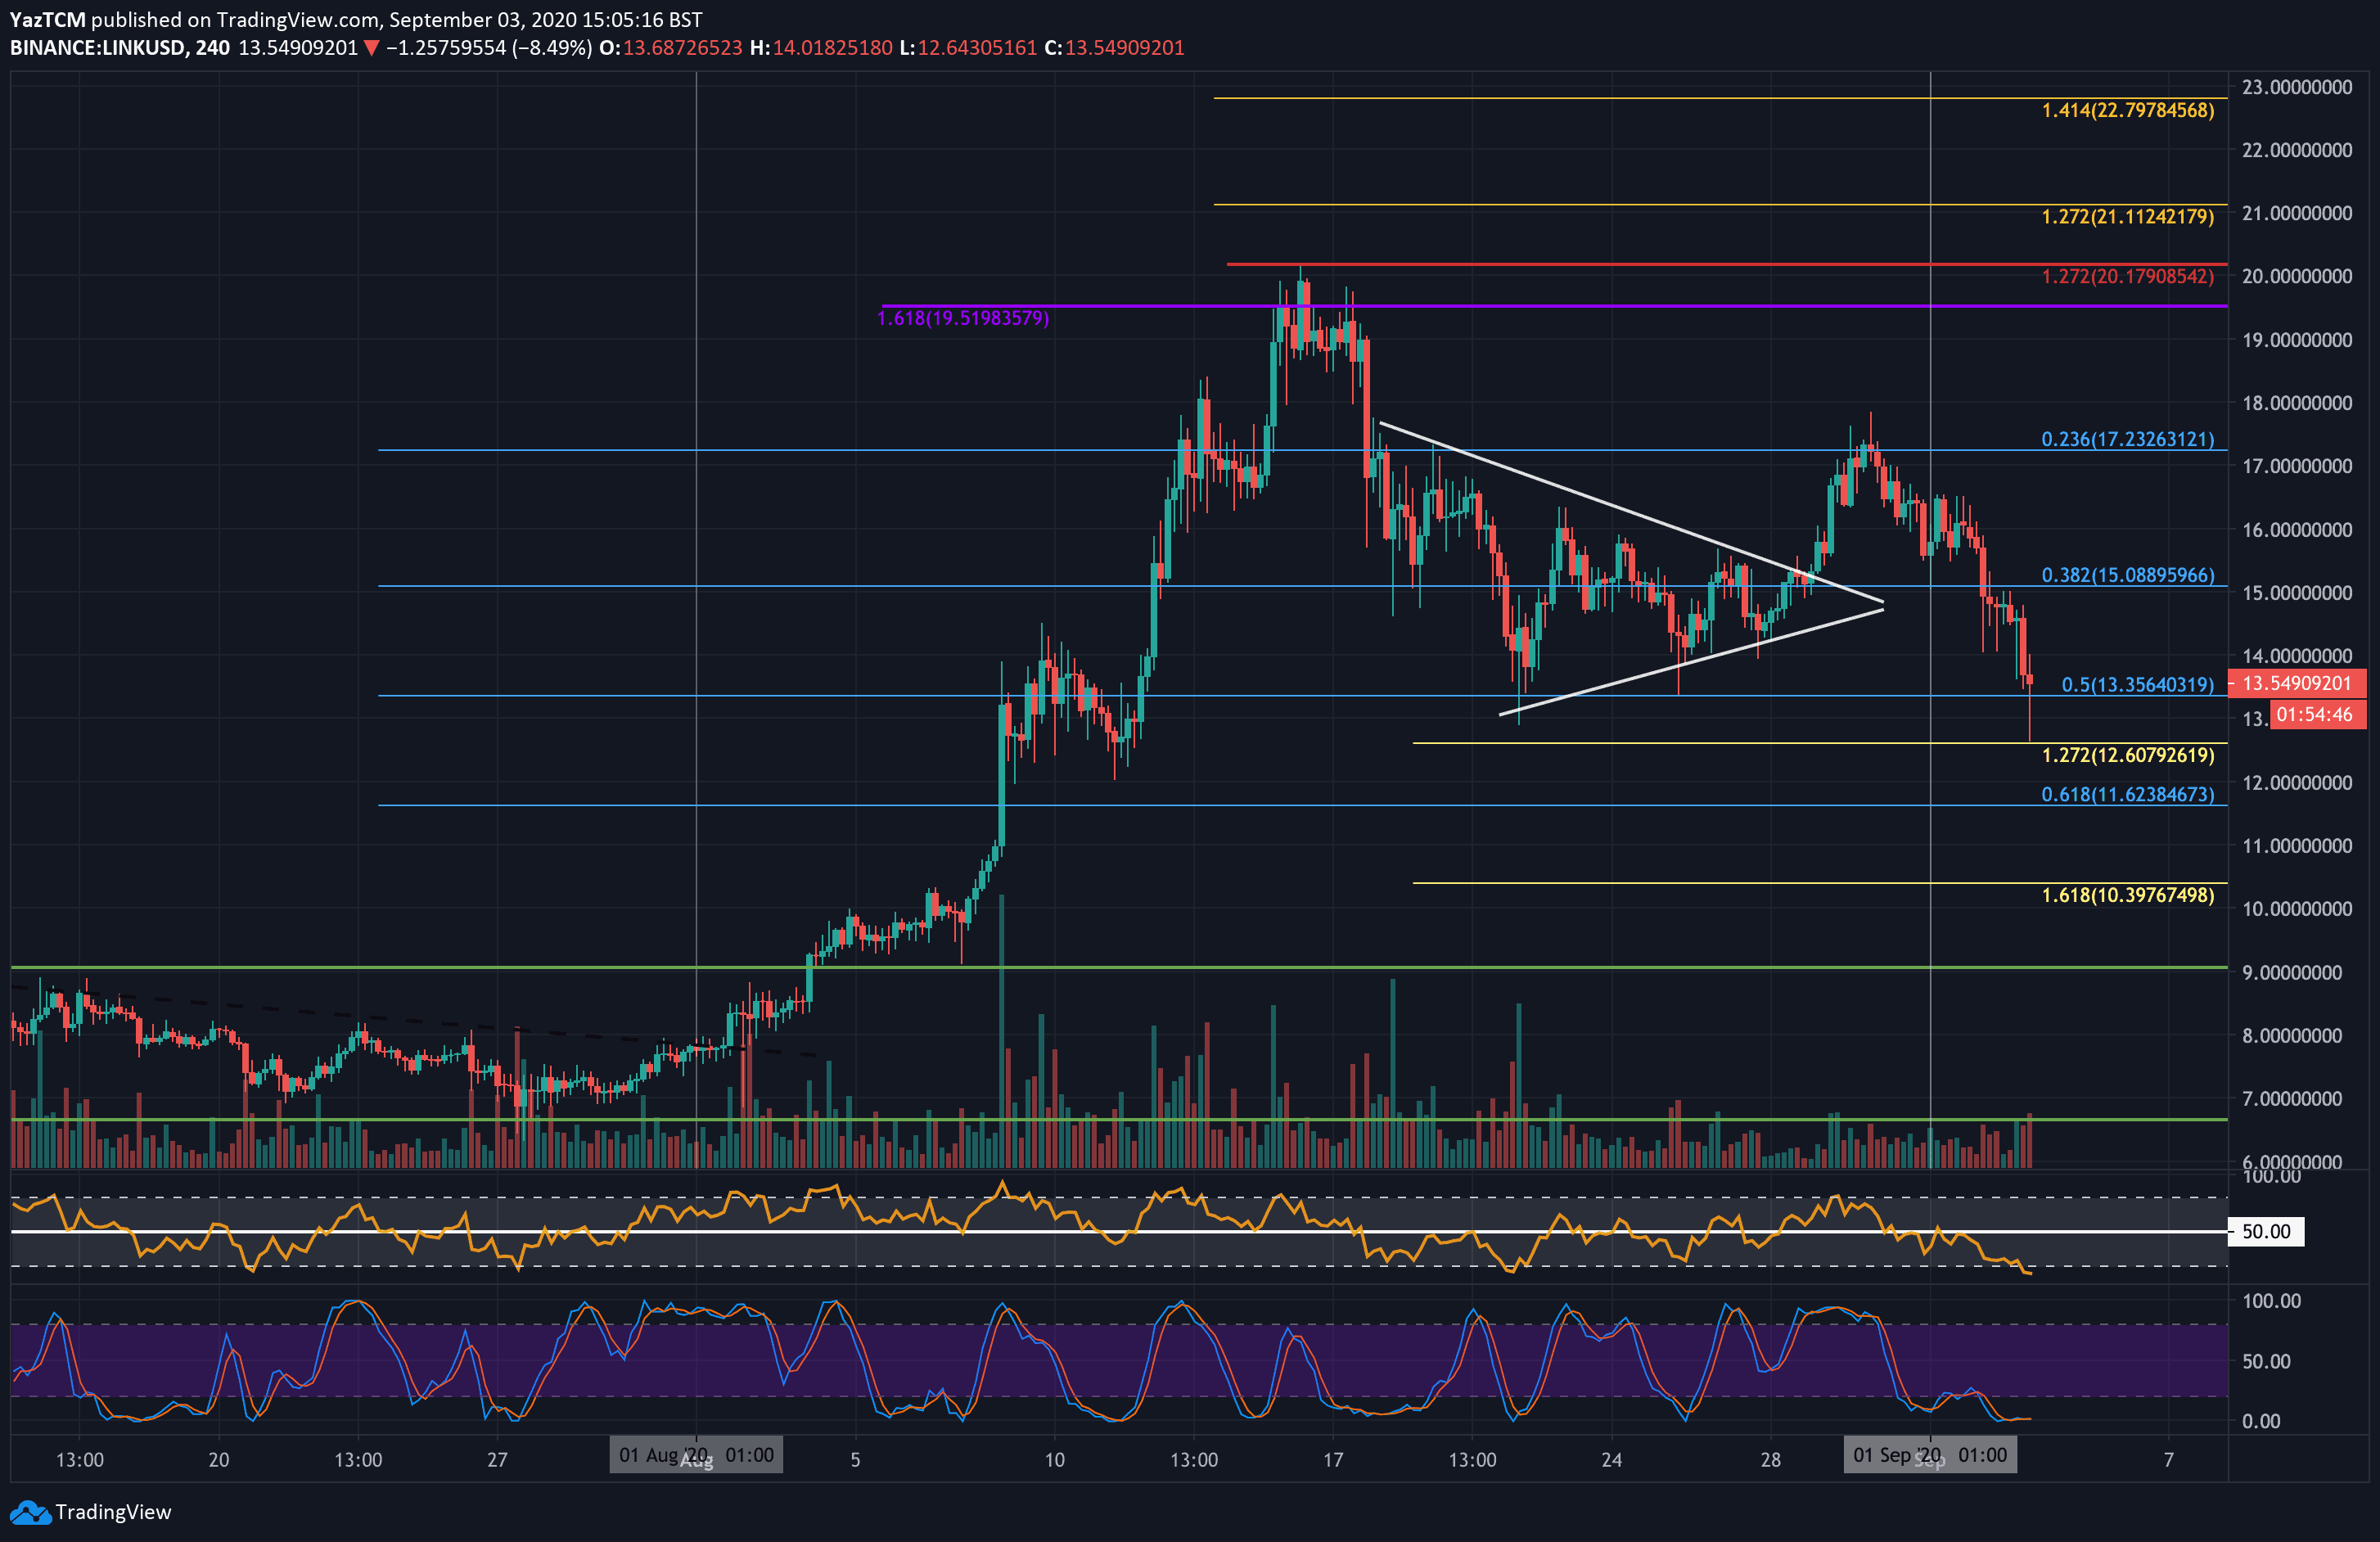
LINK-USD Short Term Price Prediction
If the sellers break beneath the current $13.35 (.5 Fib Retracement) level, initial support lies at $12.60 (downside 1.272 Fib Extension). Further below, support lies at $11.61 (.618 Fib Retracement), $11, and $10.40 (downside 1.618 Fib Extension).
On the other side, if the bulls can defend $13.35 and rebound, resistance is located at $14, $15.10, $16, and $17.40.
The increasing volume during this latest downtrend is quite alarming. However, the 4HR RSI has reached extremely oversold conditions, which could signal on a coming-up correction.
LINK/BTC – Bulls Battle To Defend 0.00119 BTC Support
Key Support Levels: 0.00119 BTC, 0.00115 BTC, 0.00108 BTC.
Key Resistance Levels: 0.0013 BTC, 0.00135 BTC, 0.0014 BTC.
Similarly, against Bitcoin, LINK penetrated above a symmetrical triangle toward the end of August as it pushed toward the 0.0015 BTC resistance. There, Link was unable to overcome this resistance as it started to head lower at the end of August. This created a lower high, which is textbook bearish.
In September, LINK initially found support at 0.00127 BTC (.382 Fib), but this level broke today as it dropped into the 0.00119 BTC support (downside 1.414 Fib Extension). The bulls are attempting to defend this level as they push higher to the current price of 0.00124 BTC.
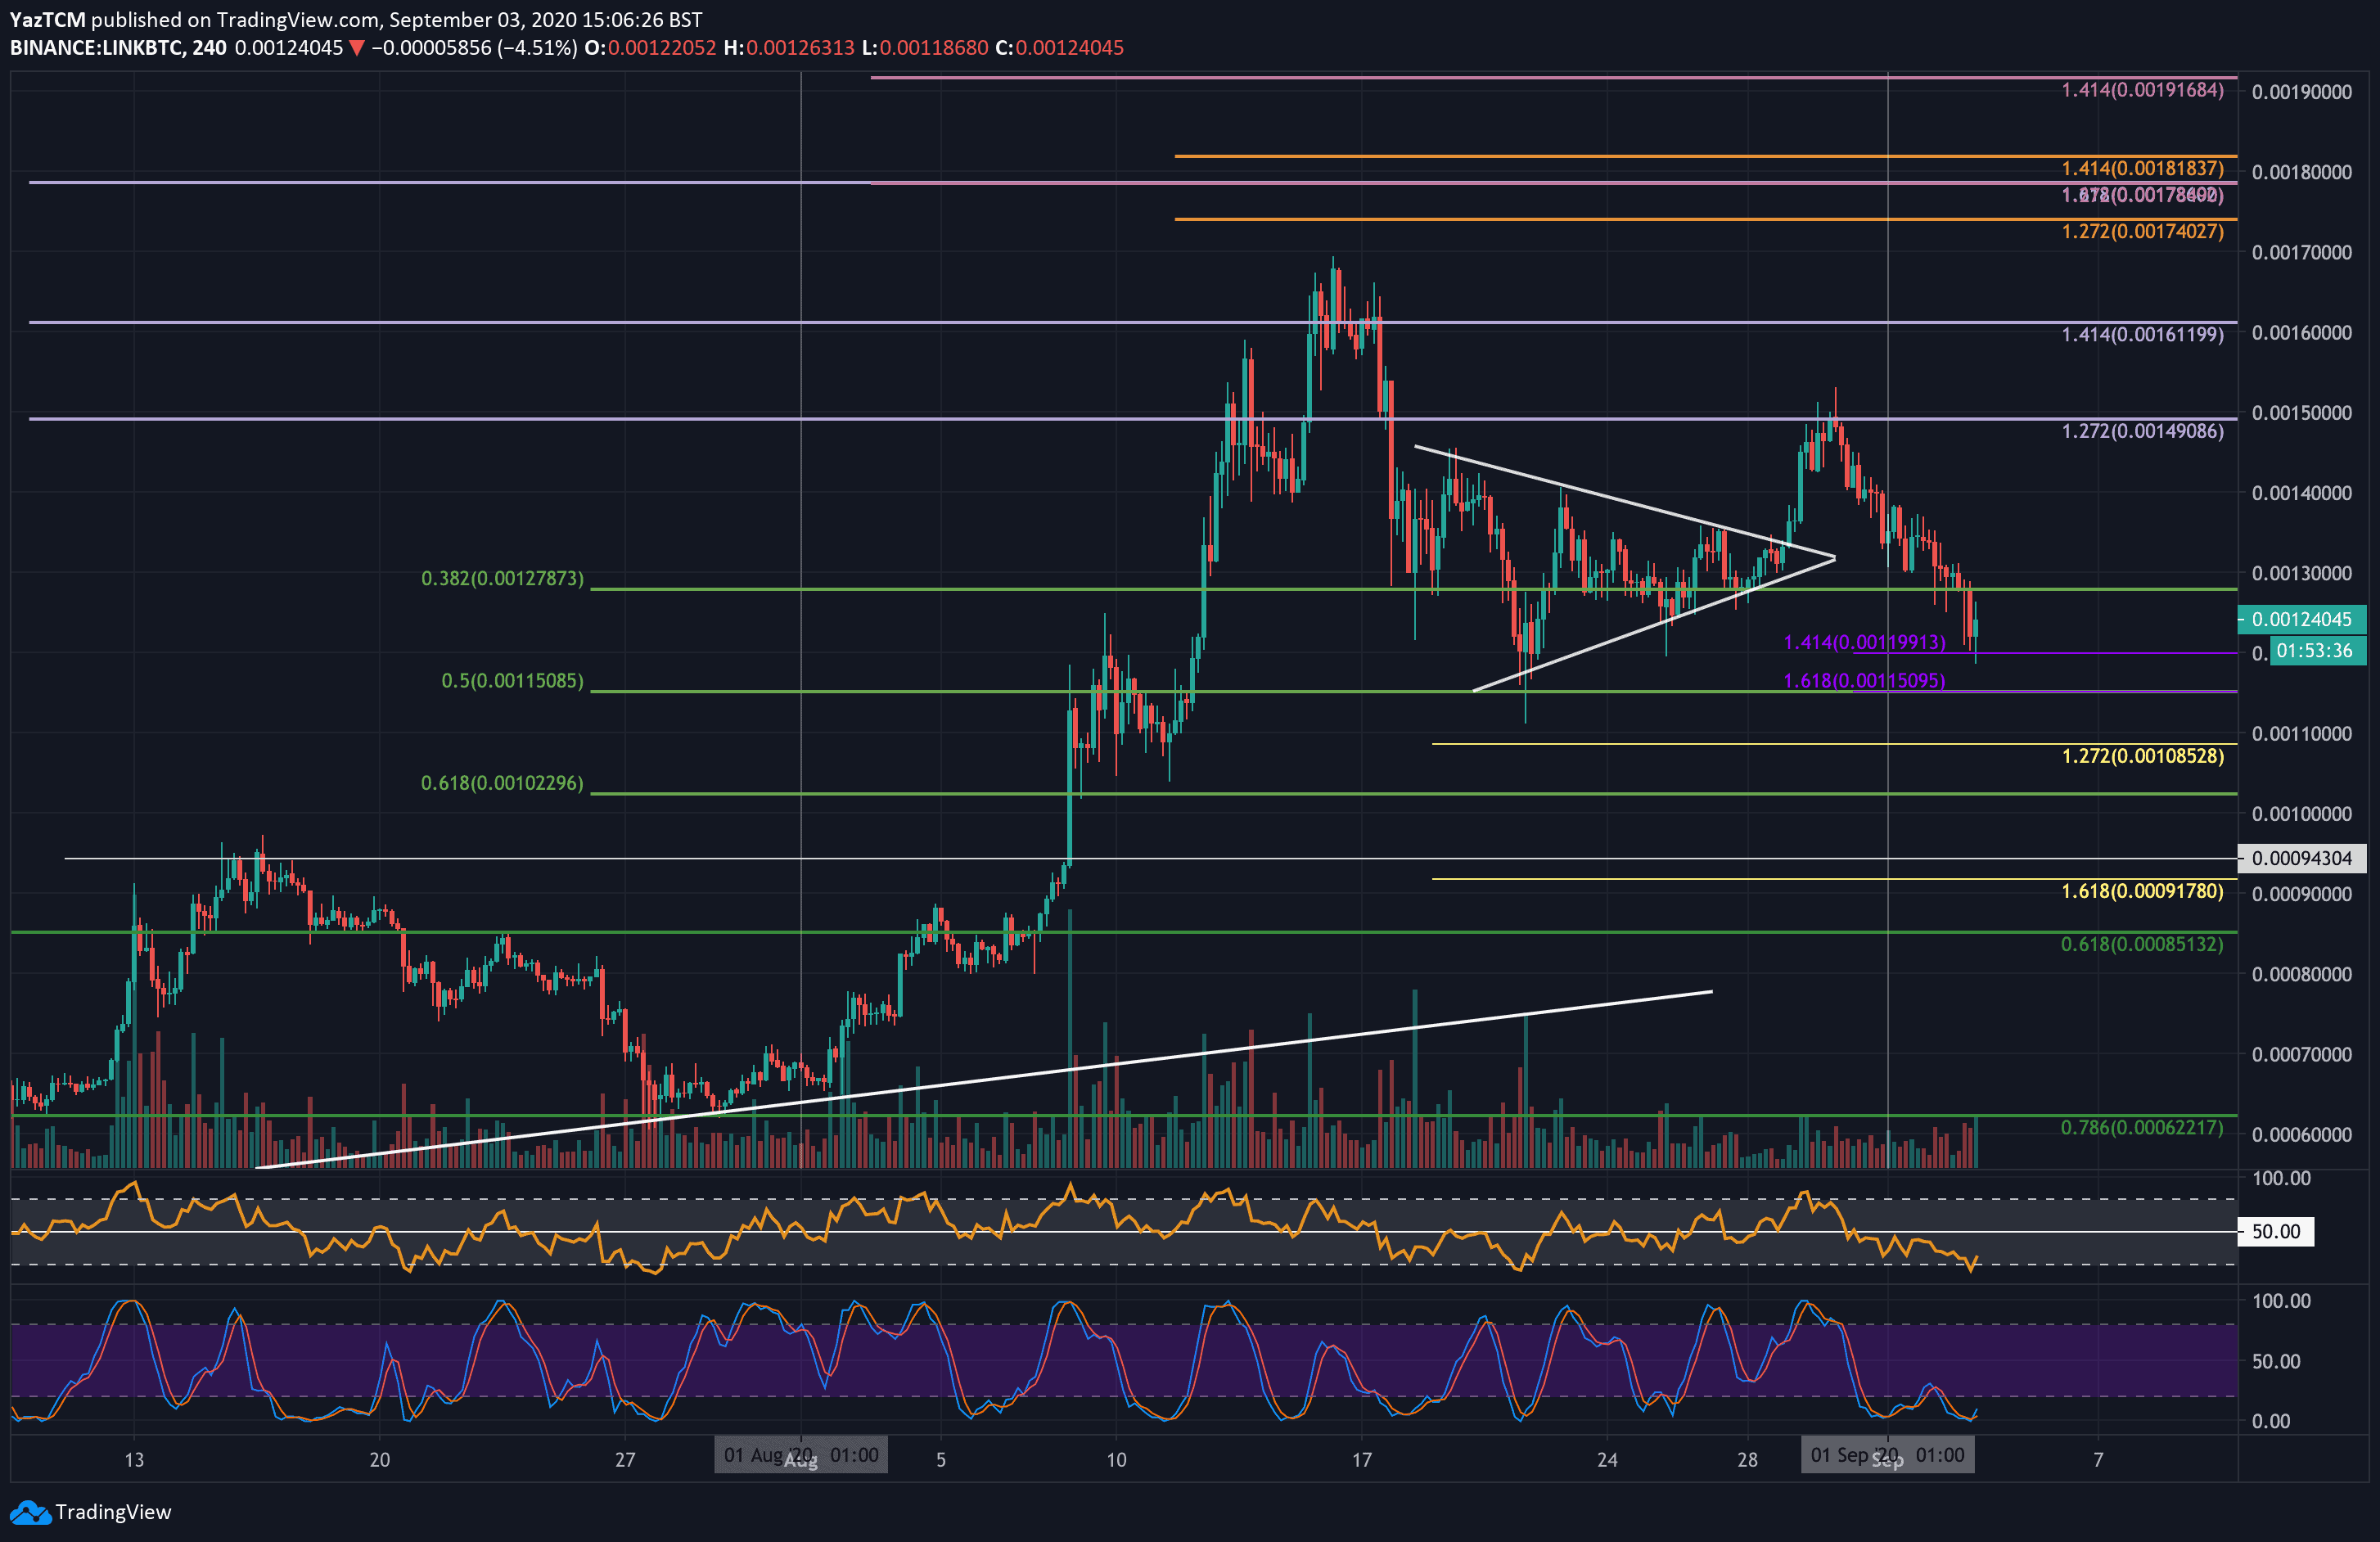
LINK-BTC Short Term Price Prediction
Looking ahead, if the buyers can start to climb again, resistance first lies at 0.0013 BTC. Following this, resistance is located at 0.00135 BTC, 0.0014 BTC, and 0.00145 BTC.
On the other side, the first level of support lies at 0.00119 BTC (downside 1.414 Fib Extension). This is followed by strong support at 0.00115 BTC (.5 Fib Retracement), 0.00108 BTC (downside 1.272 Fib Extension), and 0.00102 BTC (.618 Fib retracement).
The 4HR Stochastic RSI has produced a bullish crossover signal in extremely oversold conditions, which could help the market to recover a bit.