BitcoinBitcoin saw a 4.4% price decline over the past seven days of trading as the coin trades at ,115. The cryptocurrency was at the ,815 resistance level for the majority of the week as it continuously failed to close above it. Bitcoin went on to slide lower from there on Wednesday as it dropped into the ,400 level.Yesterday, Bitcoin continued to drop further as it dipped beneath ,000 to reach as low as ,800. Luckily, the buyers regrouped to push the coin back above ,000 before closing. Today, Bitcoin remains above ,000 as it faces resistance at ,150.Looking ahead, if the buyers push above ,150, resistance is expected at ,425, ,600, and ,815. Once, ,815 is broken, resistance lies at ,000, .226 (1.618 Fib Extension), and ,430 (2020 high).On the other
Topics:
Yaz Sheikh considers the following as important: ADABTC, ADAUSD, Bitcoin (BTC) Price, BTC Analysis, btcusd, Cardano (ADA) Price, ETH Analysis, ETHBTC, Ethereum (ETH) Price, ethusd, Price Analysis, Ripple (XRP) Price, XRP Analysis, xrpbtc, xrpusd
This could be interesting, too:
Chayanika Deka writes XRP, SOL, and ADA Inclusion in US Crypto Reserve Pushes Traders on Edge
Chayanika Deka writes Why Arthur Hayes Is Bullish on Bitcoin Under Trump’s Economic Strategy
Mandy Williams writes Why the Bitcoin Market Is Stuck—and the Key Metric That Could Change It: CryptoQuant CEO
Wayne Jones writes Metaplanet Acquires 156 BTC, Bringing Total Holdings to 2,391
Bitcoin
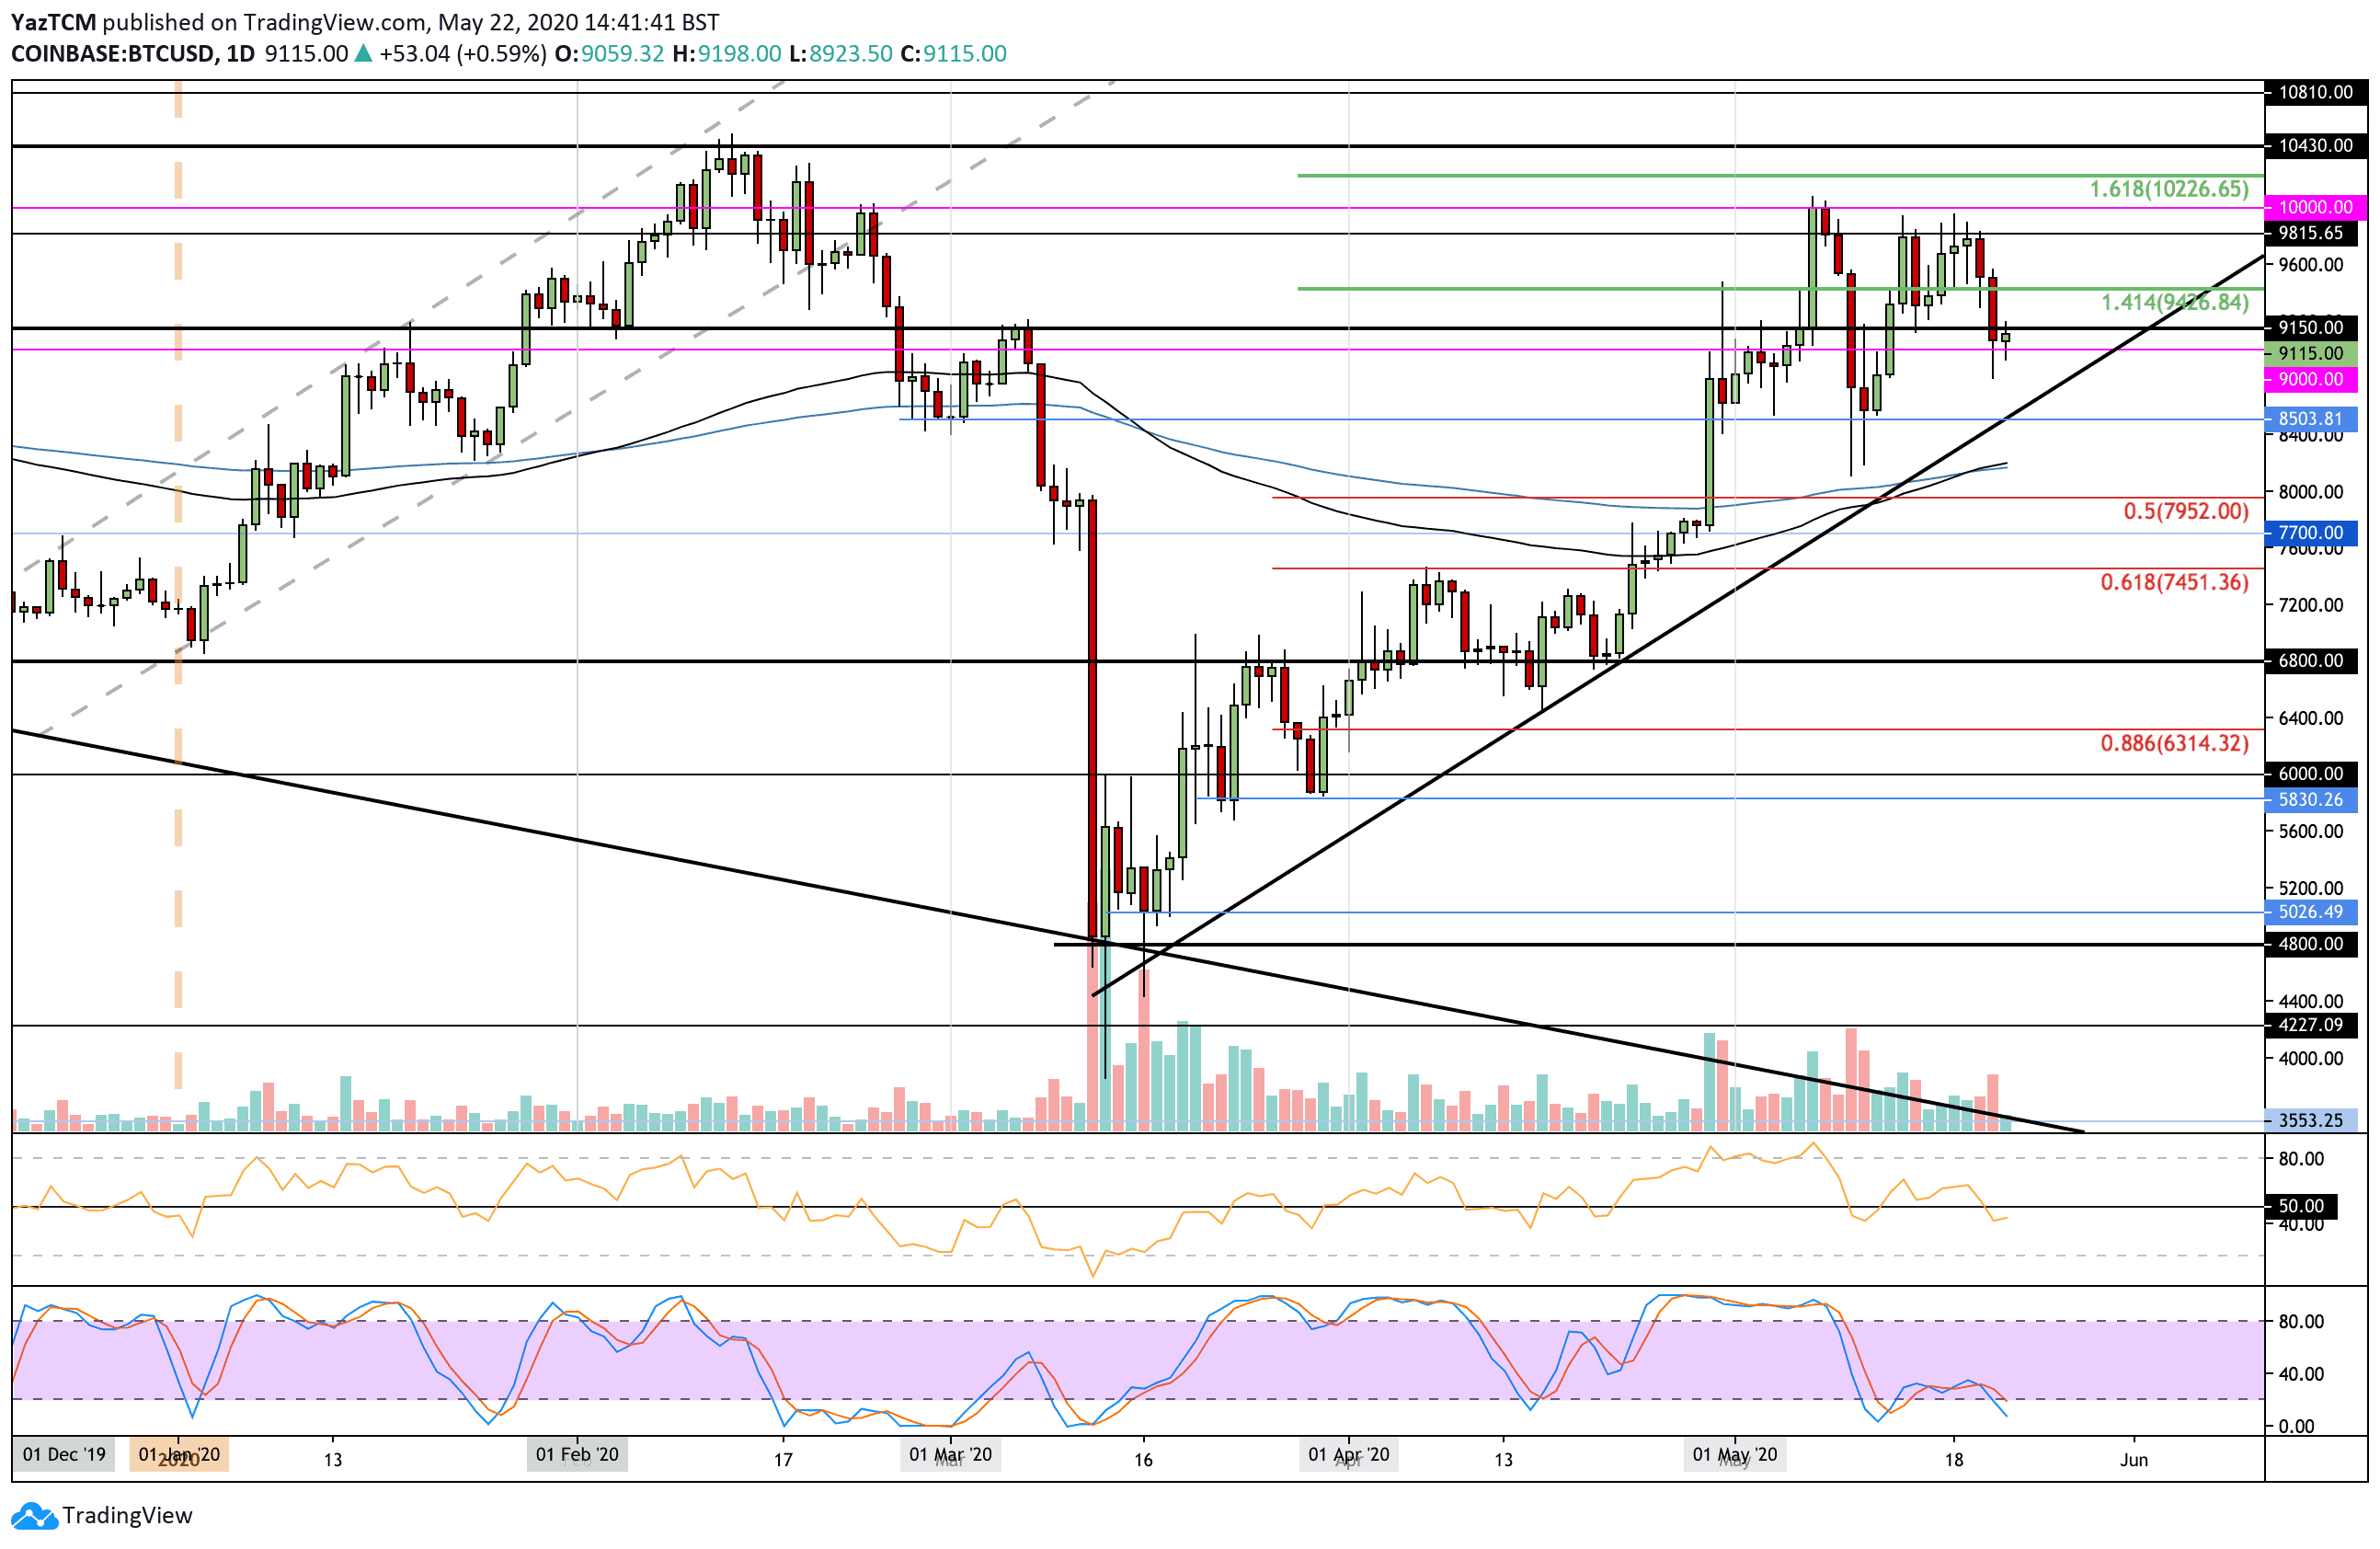
Bitcoin saw a 4.4% price decline over the past seven days of trading as the coin trades at $9,115. The cryptocurrency was at the $9,815 resistance level for the majority of the week as it continuously failed to close above it. Bitcoin went on to slide lower from there on Wednesday as it dropped into the $9,400 level.
Yesterday, Bitcoin continued to drop further as it dipped beneath $9,000 to reach as low as $8,800. Luckily, the buyers regrouped to push the coin back above $9,000 before closing. Today, Bitcoin remains above $9,000 as it faces resistance at $9,150.
Looking ahead, if the buyers push above $9,150, resistance is expected at $9,425, $9,600, and $9,815. Once, $9,815 is broken, resistance lies at $10,000, $10.226 (1.618 Fib Extension), and $10,430 (2020 high).
On the other side, if the sellers push beneath $9,000 again, support is firstly found at the rising trend line. Beneath this, support is at $8,400, $8,200 (100-days and 200-days EMA confluence), and $7,950 (.5 Fib Retracement). Added support is found at $7,700 and $7,450.
Ethereum
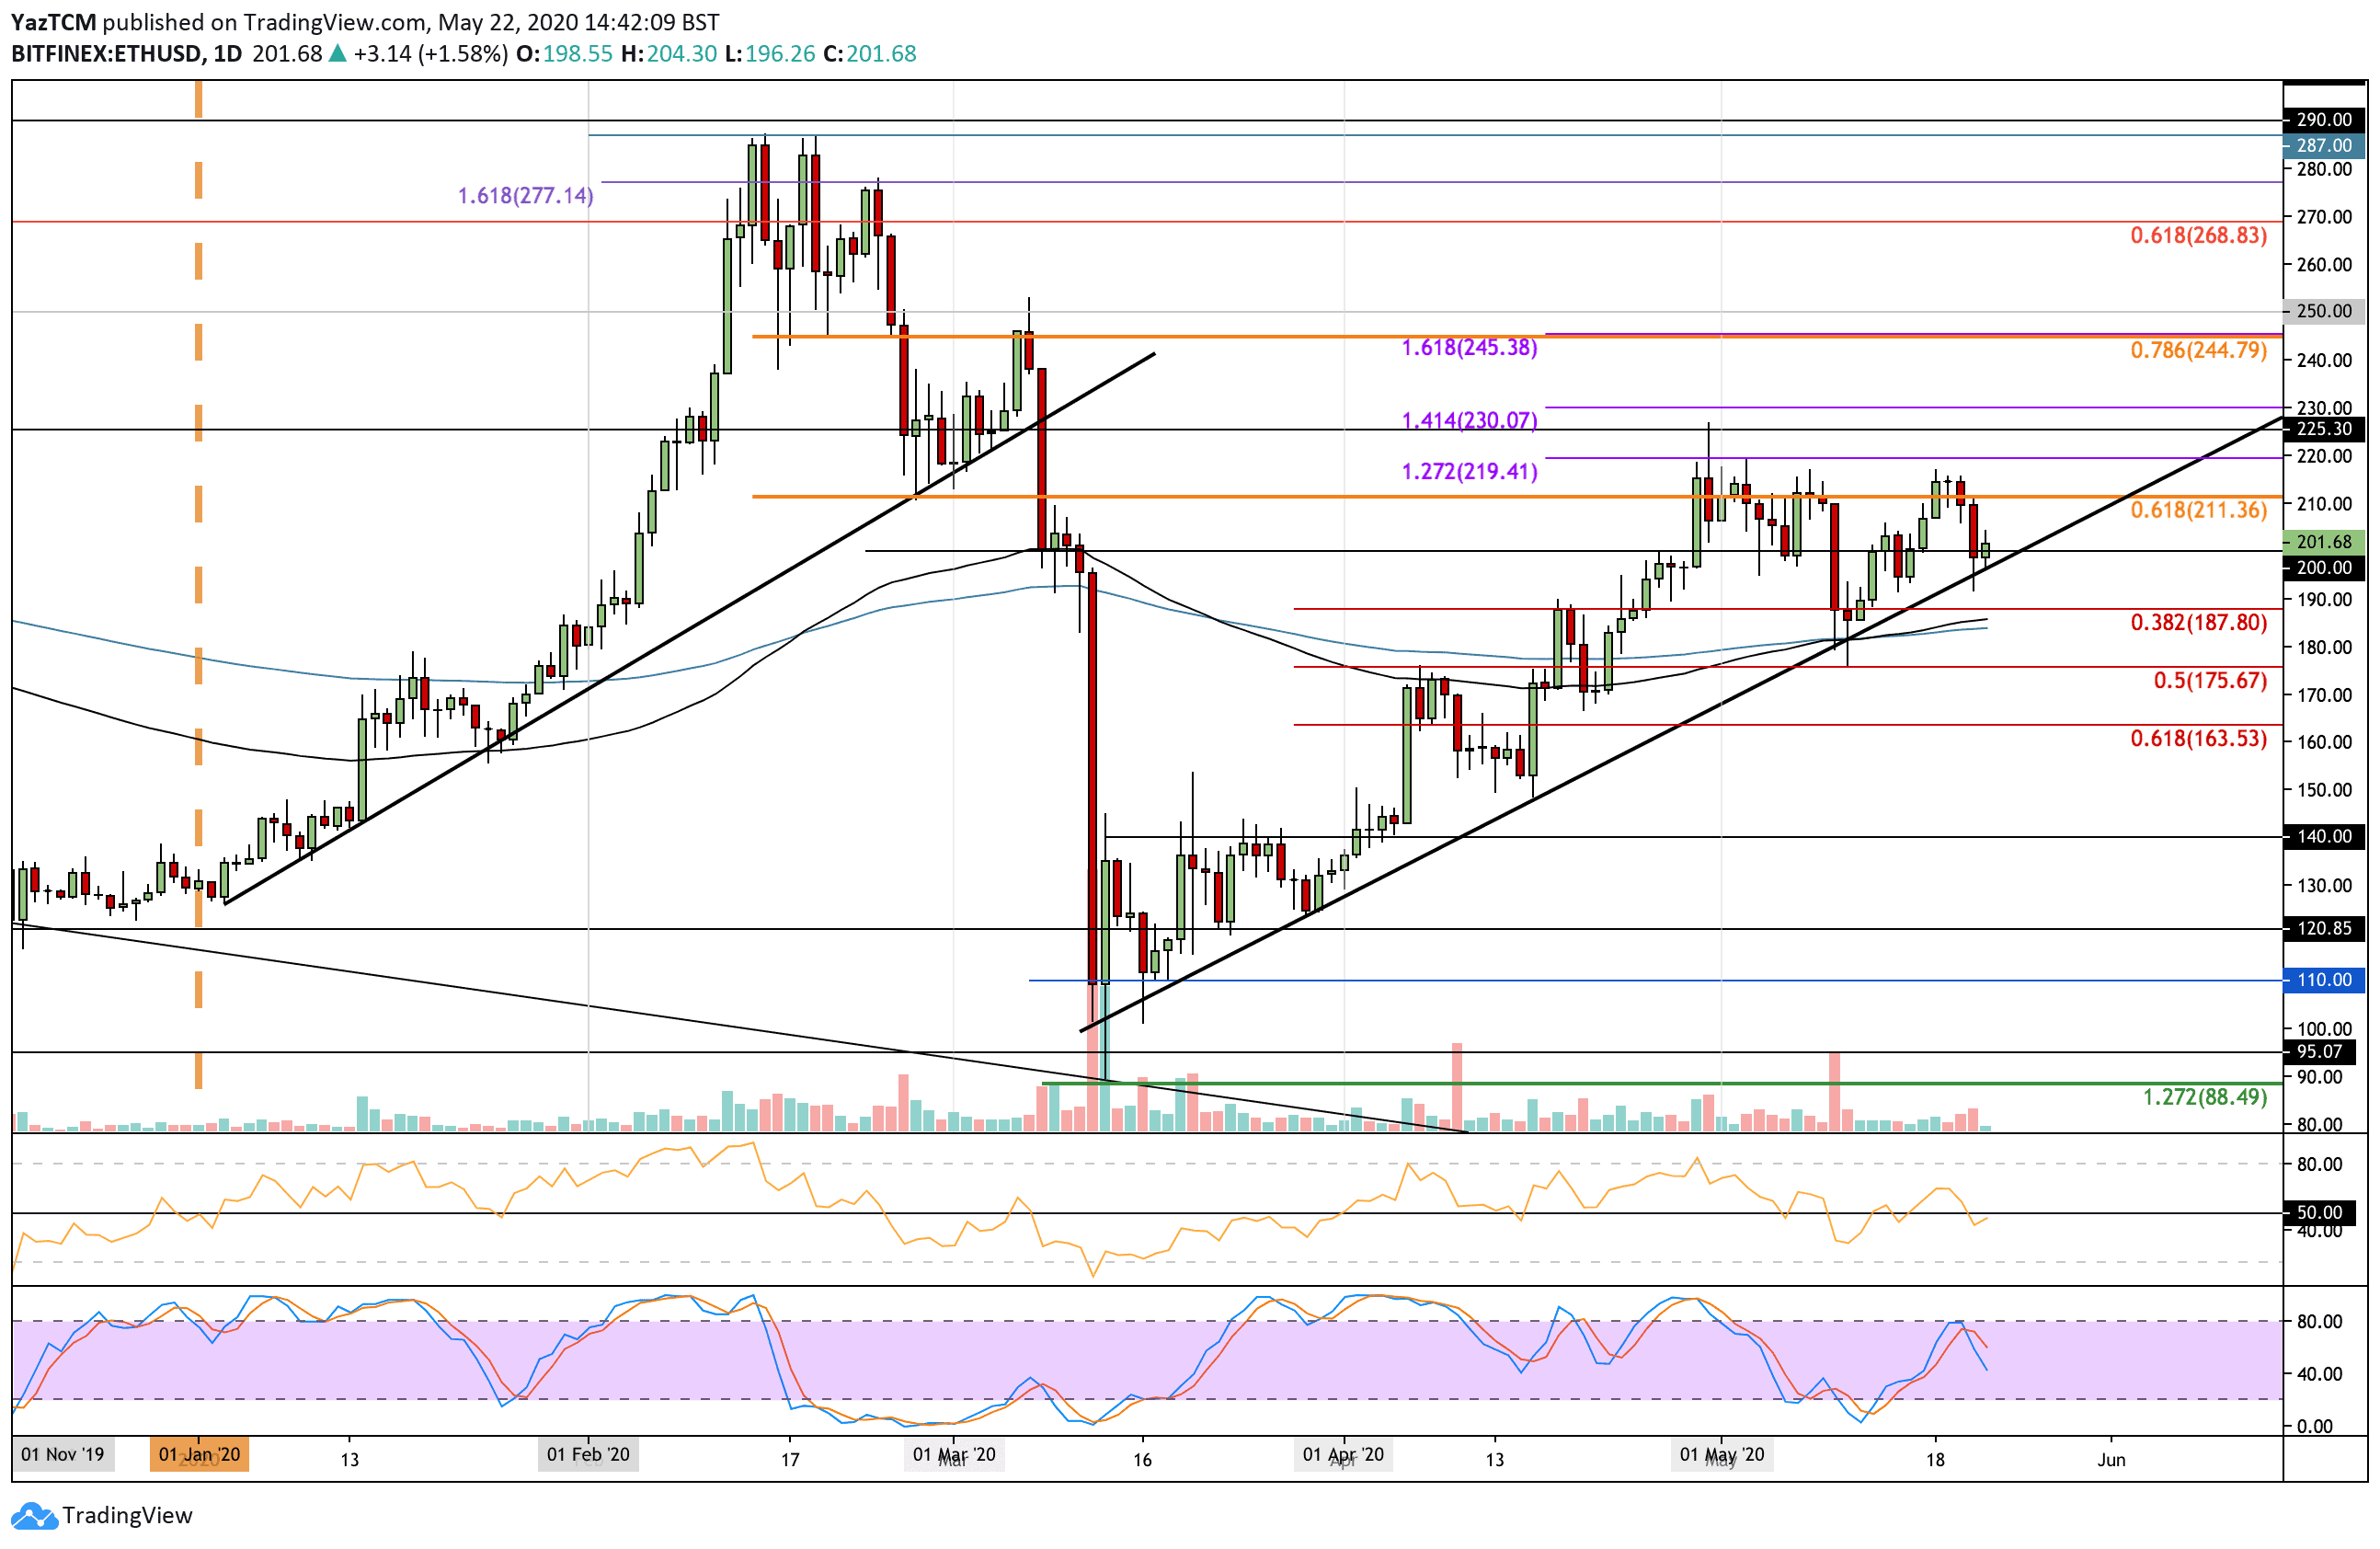
Ethereum saw a small 1.5% price rise over the last week of trading as the coin managed to defend the $200 level. Ethereum had bounced from $200 earlier in the week and climbed as high as $215 toward the middle of the week. It was unable to break this resistance and fell lower from there.
After falling, ETH managed to find strong support at the rising trend line, where it bounced to remain above the $200 level.
Looking ahead, the first level of strong resistance is located at $215. Above this, resistance lies at $220 (1.272 Fib Extension), $225, and $230 (1.414 Fib Extension). Added resistance is located at $245 (bearish .786 Fib Retracement), $250, and $268.
Alternatively, the first level of support lies at the rising trend line. Beneath this, support lies at $187 (.382 Fib Retracement), $182 (200-days EMA), and $175 (.5 Fib Retracement). Added support is found at $164 (.618 Fib Retracement).
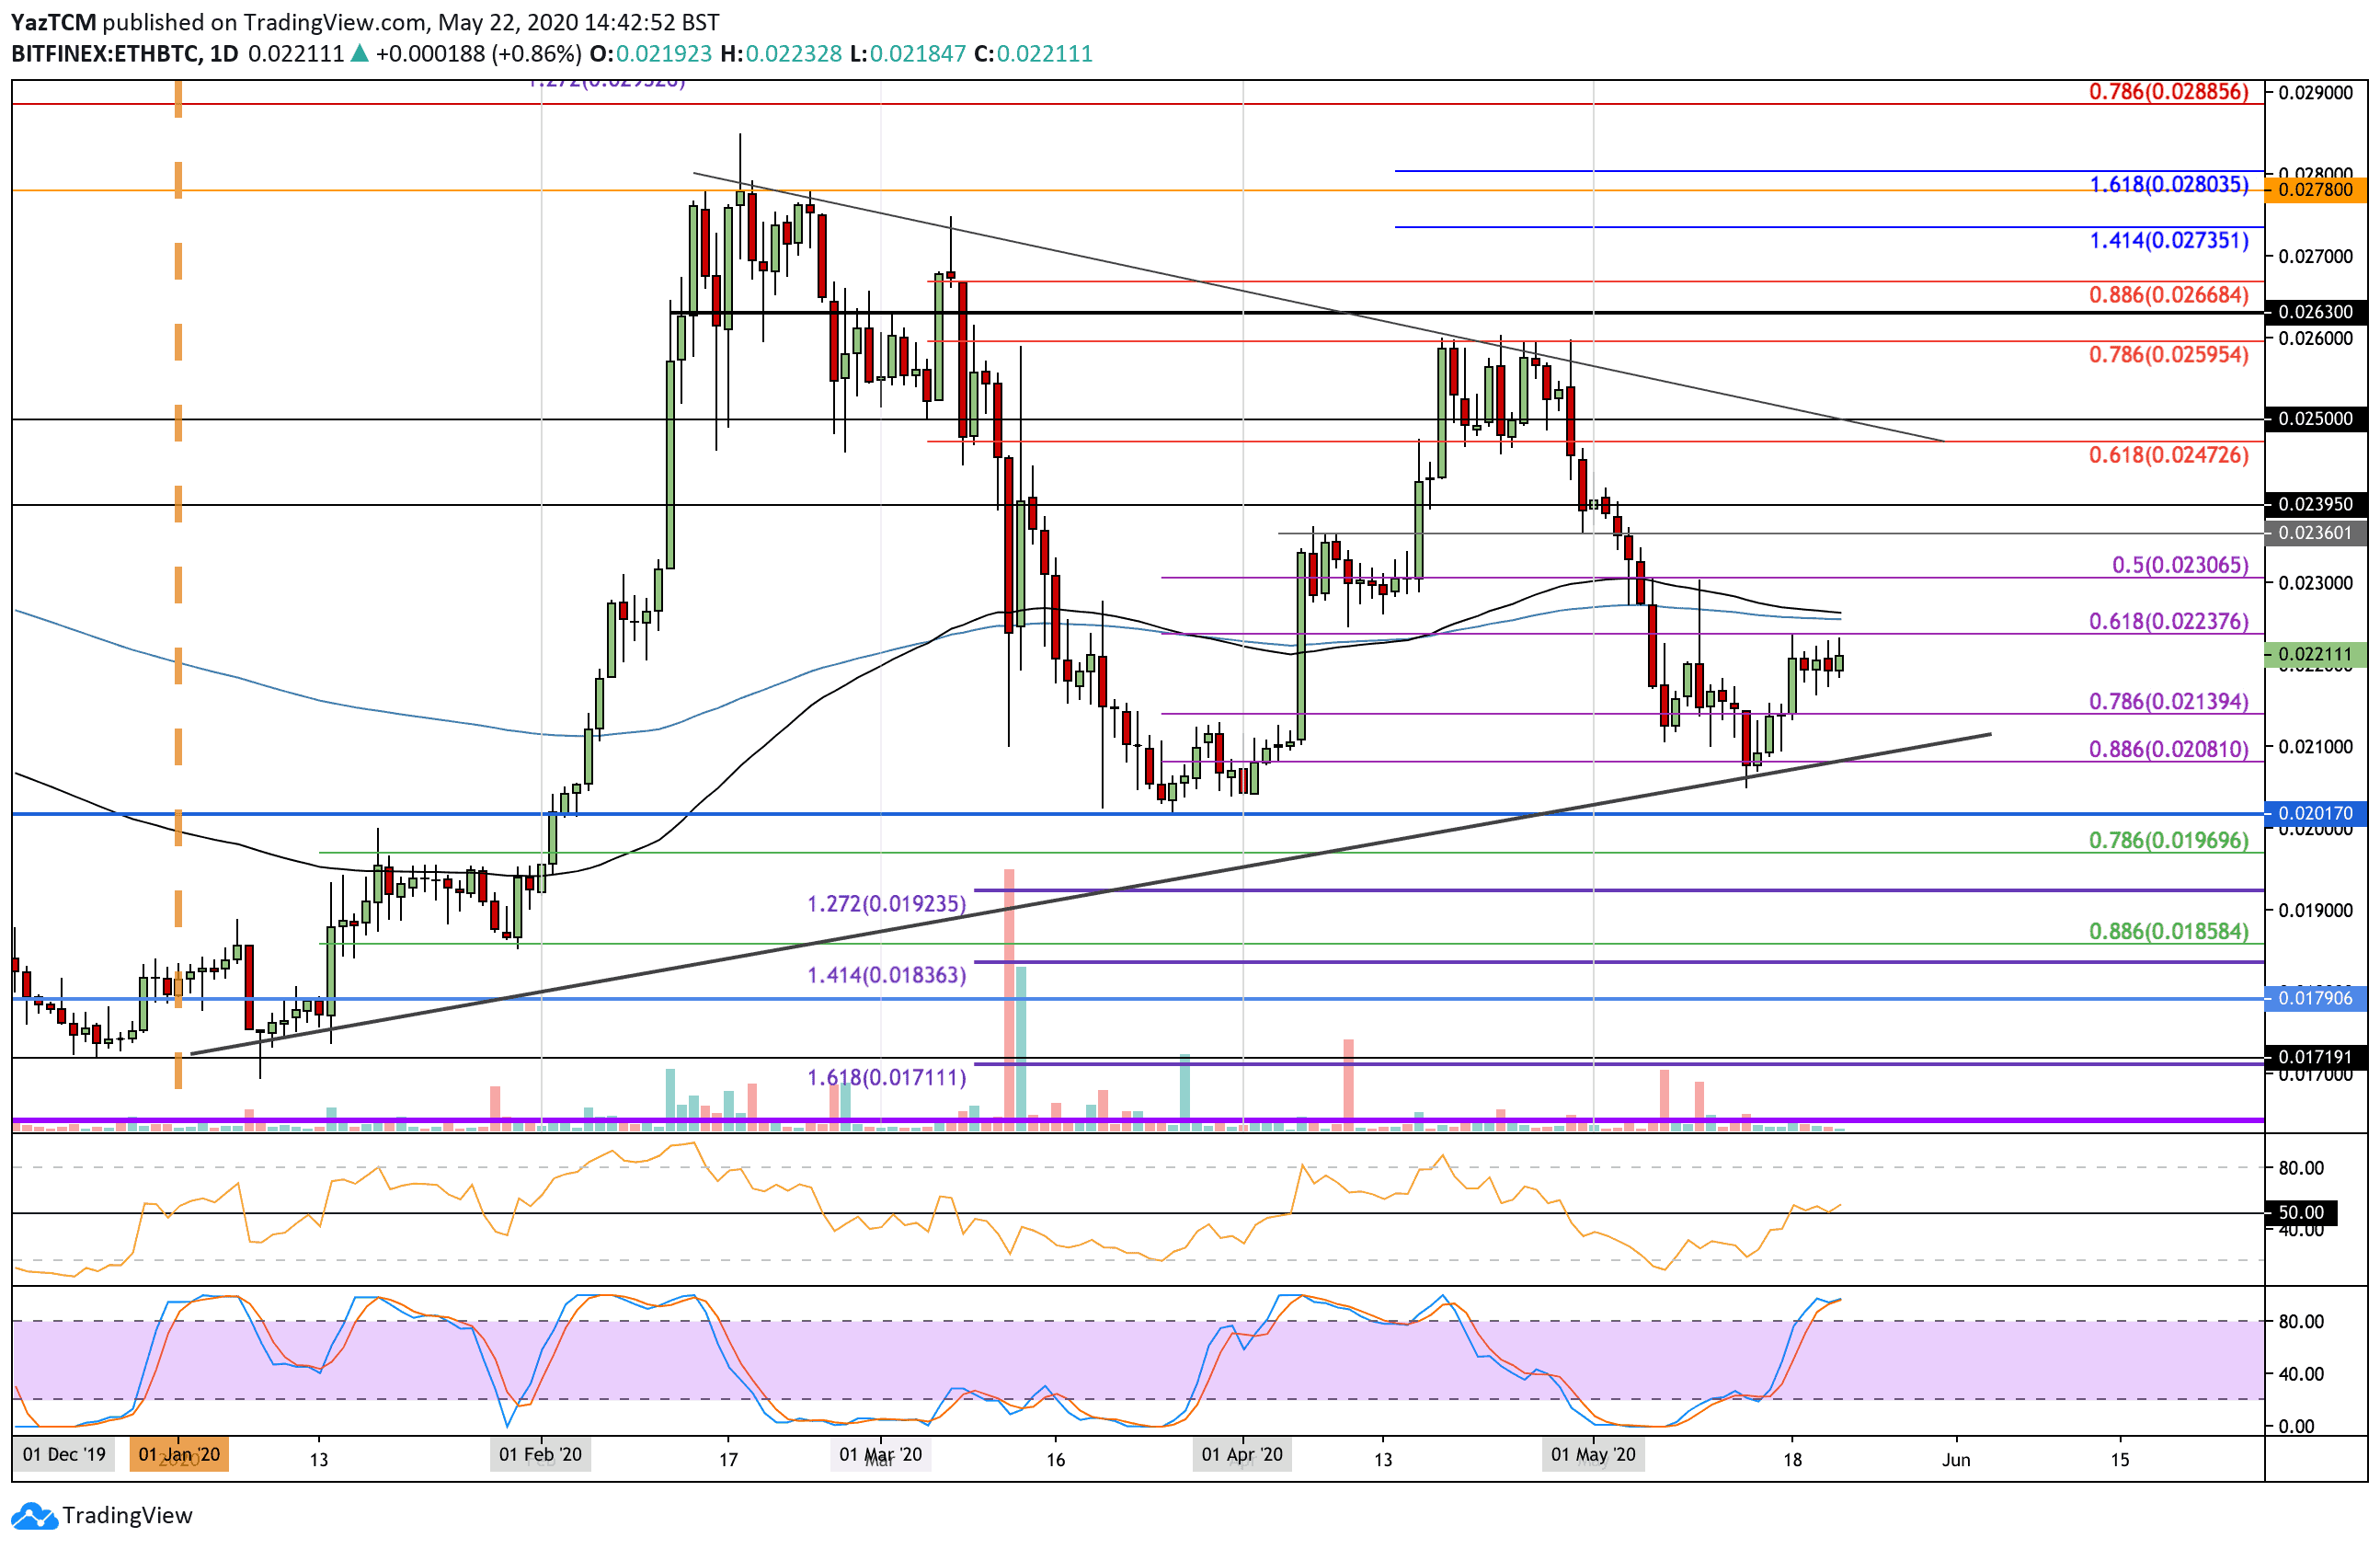
Against Bitcoin, ETH increased by around 6% this week as it rose from the 0.0208 BTC level to reach the current 0.022 BTC level. The coin was falling throughout most of May as it reached as low as 0.0208 BTC last week. The support here was bolstered by a rising support trend line, and it allowed ETH to rebound and push higher.
Looking ahead, if the buyers break above 0.0225 BTC (200-days EMA), resistance is located at 0.023 BTC, 0.0236 BTC, and 0.0239 BTC. Beyond 0.024 BTC, added resistance lies at 0.0247 BTC (bearish .618 Fib Retracement), 0.025 BTC, and 0.026 BTC.
On the other hand, if the sellers push lower, the first level of support lies at 0.022 BTC. Beneath this, support is at 0.0214 BTC, the rising trend line, and 0.0208 BTC.
Ripple
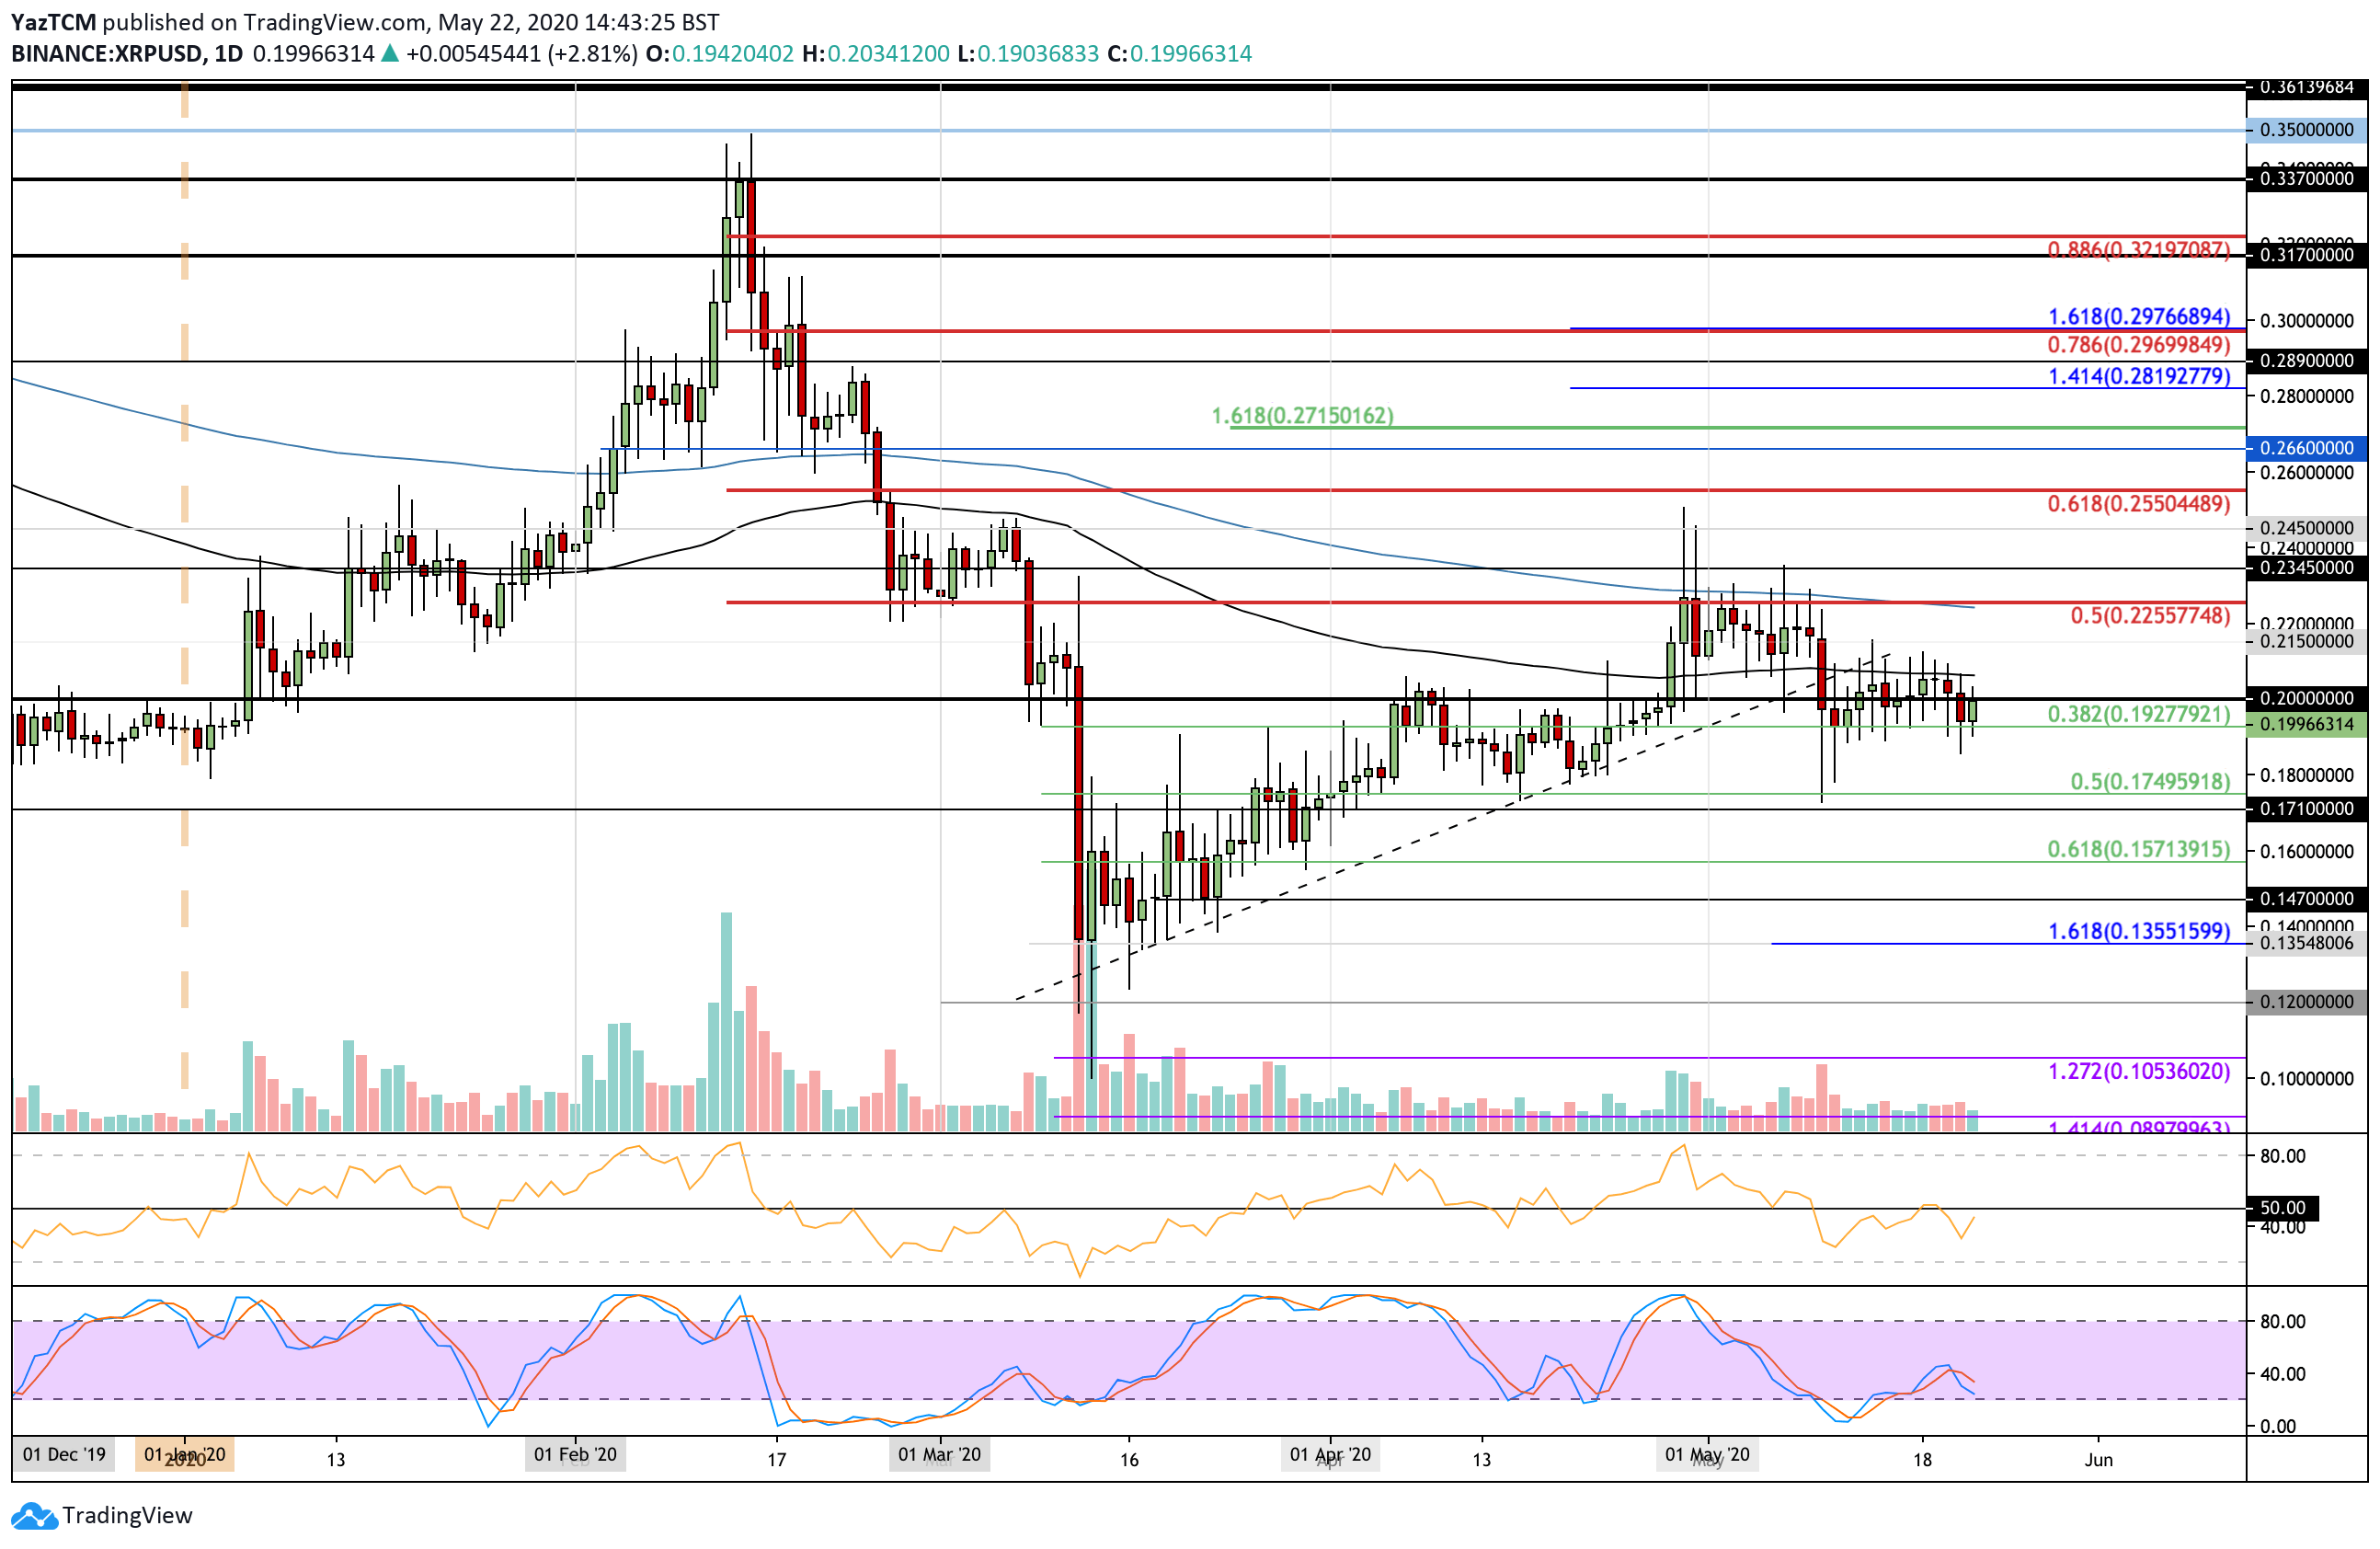
XRP moved sideways during the week as it continues to battle to remain above the $0.2 level. The coin was struggling at resistance throughout the majority of the week at the 100-days EMA and was unsuccessful in closing above it. This caused XRP to drop lower beneath the $0.2 level to find support at the $0.192 level (.382 Fib Retracement).
Moving forward, if the buyers manage to break the 100-days EMA, higher resistance lies at $0.0215, $0.225 (bearish .5 Fib Retracement & 200-days EMA), and $0.234. This is followed by added resistance at $0.245 and $0.255 (bearish .618 Fib Retracement).
Alternatively, if the sellers push back beneath $0.2, support lies at $0.192 (.382 Fib Retracement). Beneath this, added support is found at $0.18, $0.175 (.5 Fib Retracement), $0.171, and $0.157 (.618 Fib Retracement).
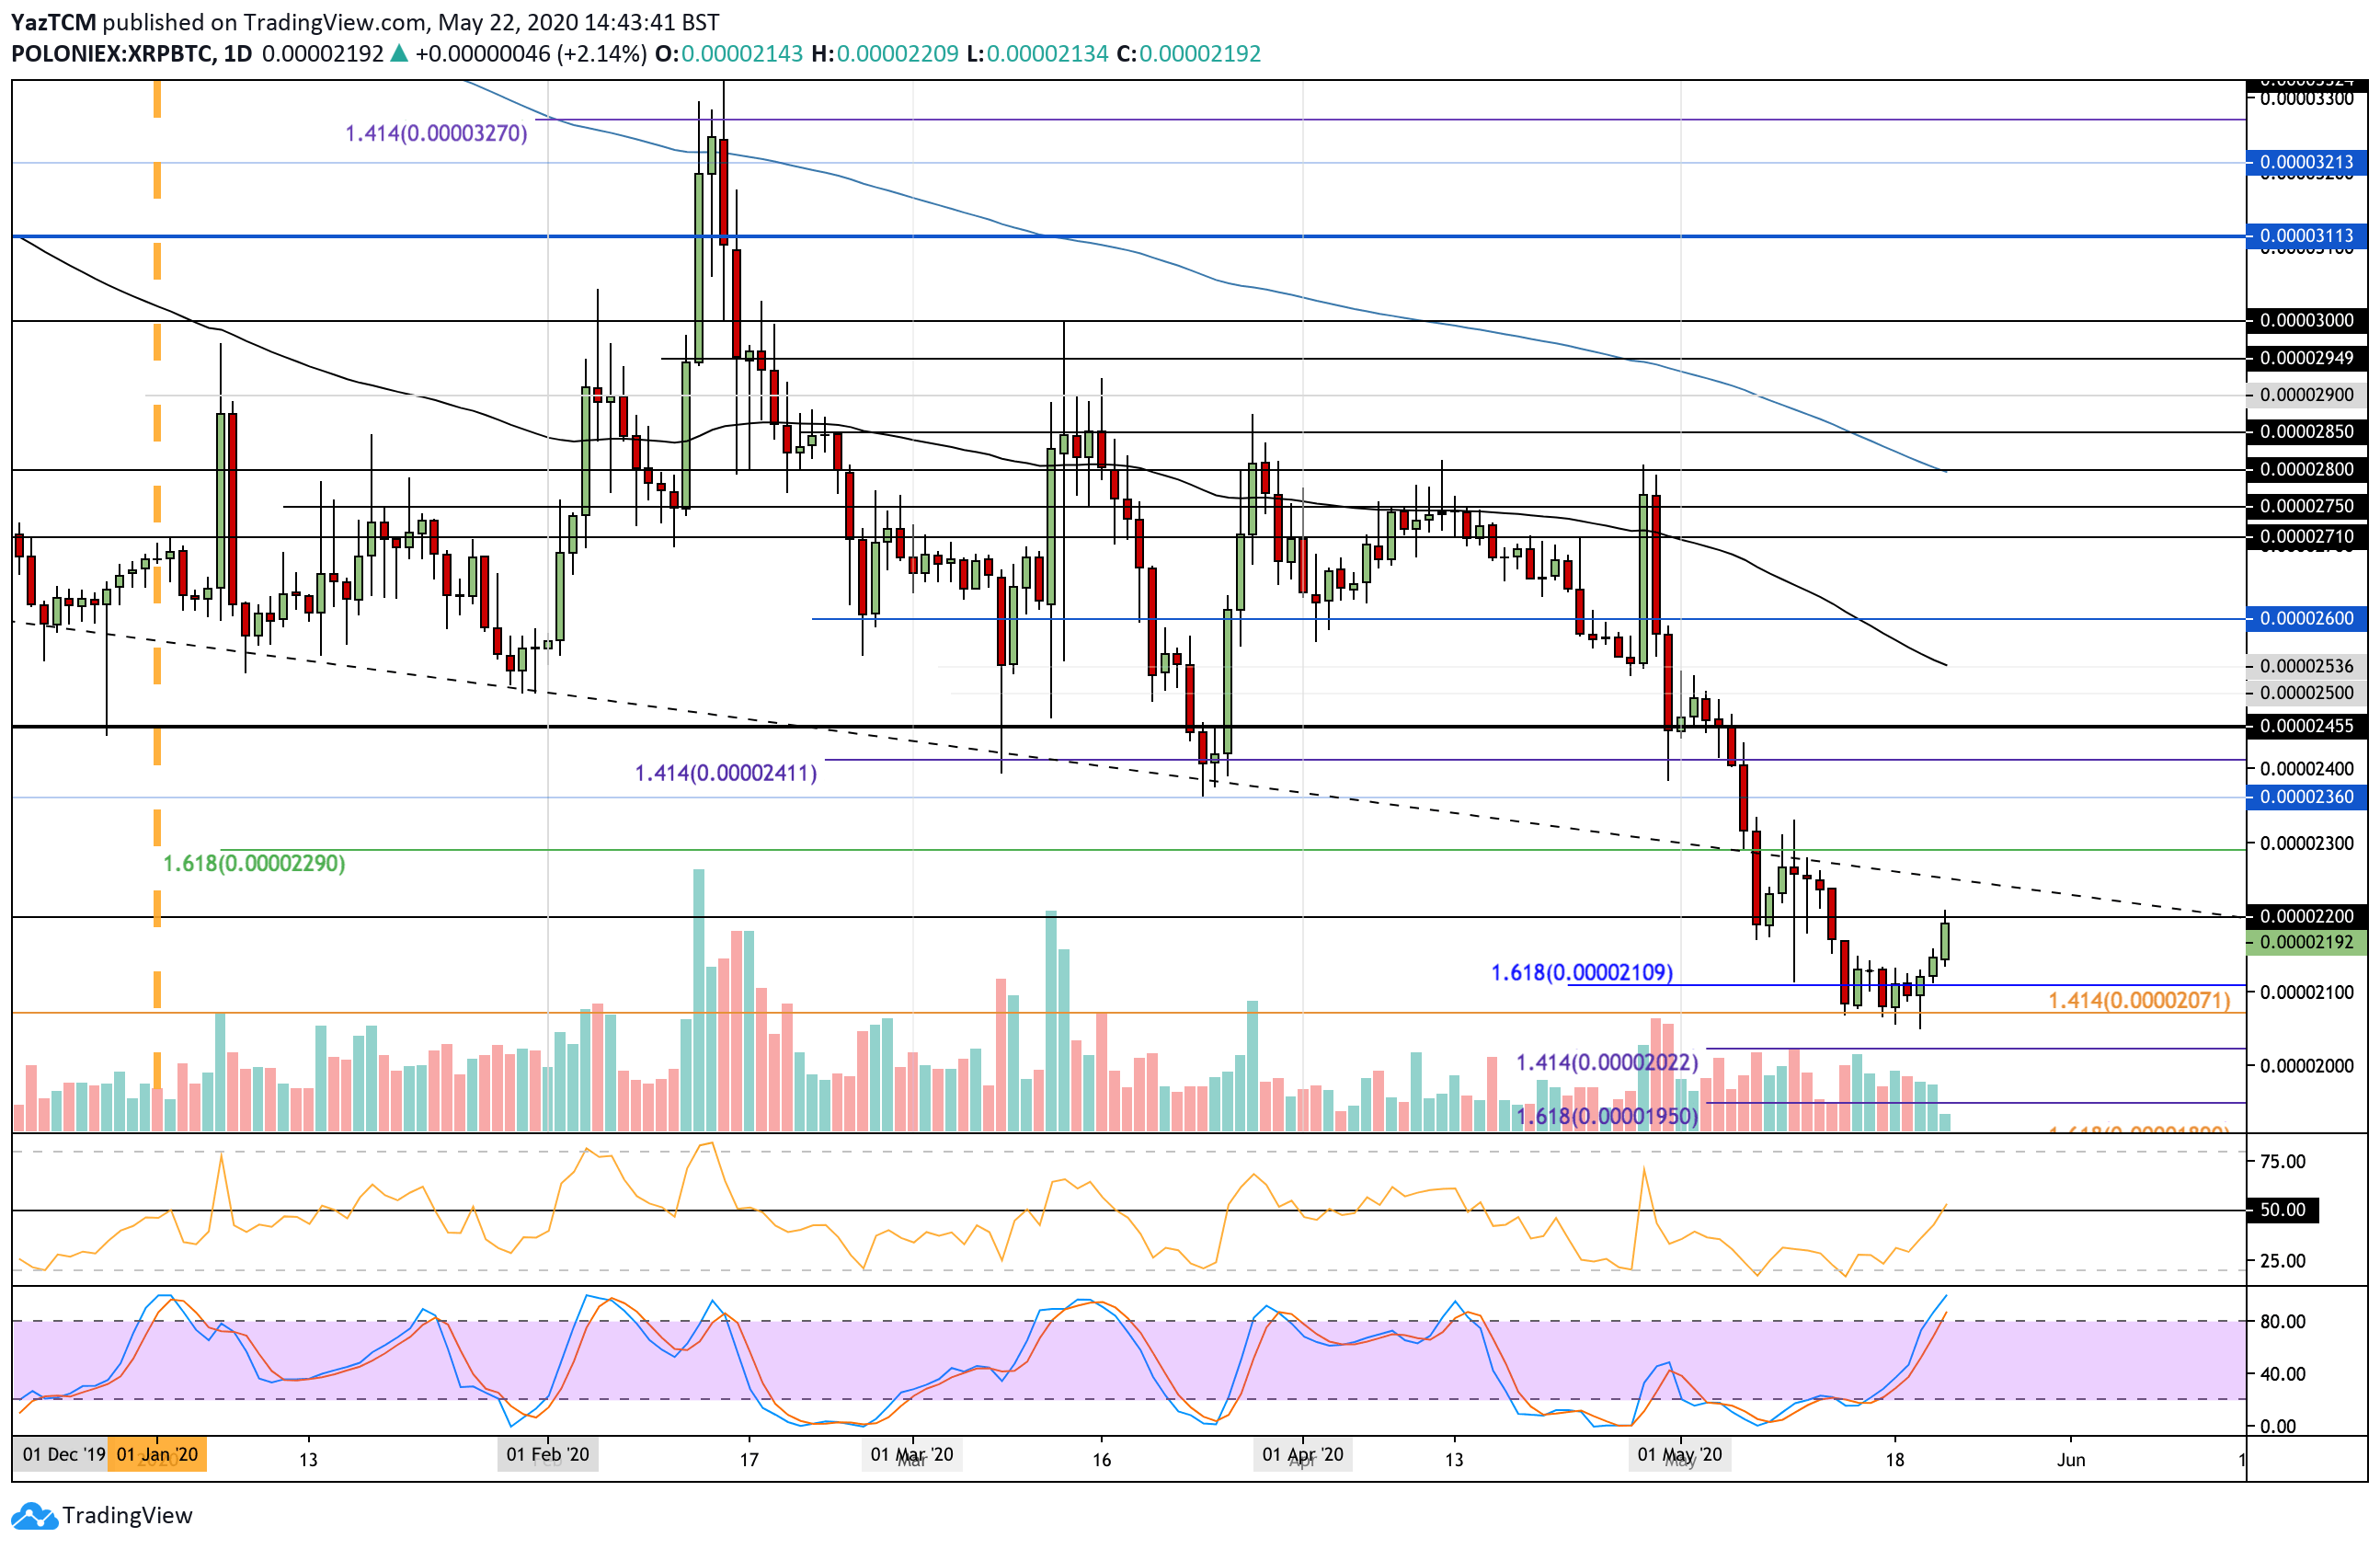
Against Bitcoin, XRP started the week off by falling back into the downside support at 2070 SAT. It managed to rebound from this multi-year low as it pushed higher above 2100 SAT to reach the 2200 SAT level.
Looking ahead, if the buyers continue above 2200 SAT, resistance is located at 2300 SAT, 2360 SAT, and 2400 SAT. Additional resistance lies at 2455 SAT, 2500 SAT, and 2435 SAT (100-days EMA).
Alternatively, if the sellers push lower, the first level of support lies at 2100 SAT. Beneath this, support lies at 2070 SAT, 2022 SAT, and 1950 SAT.
Cardano
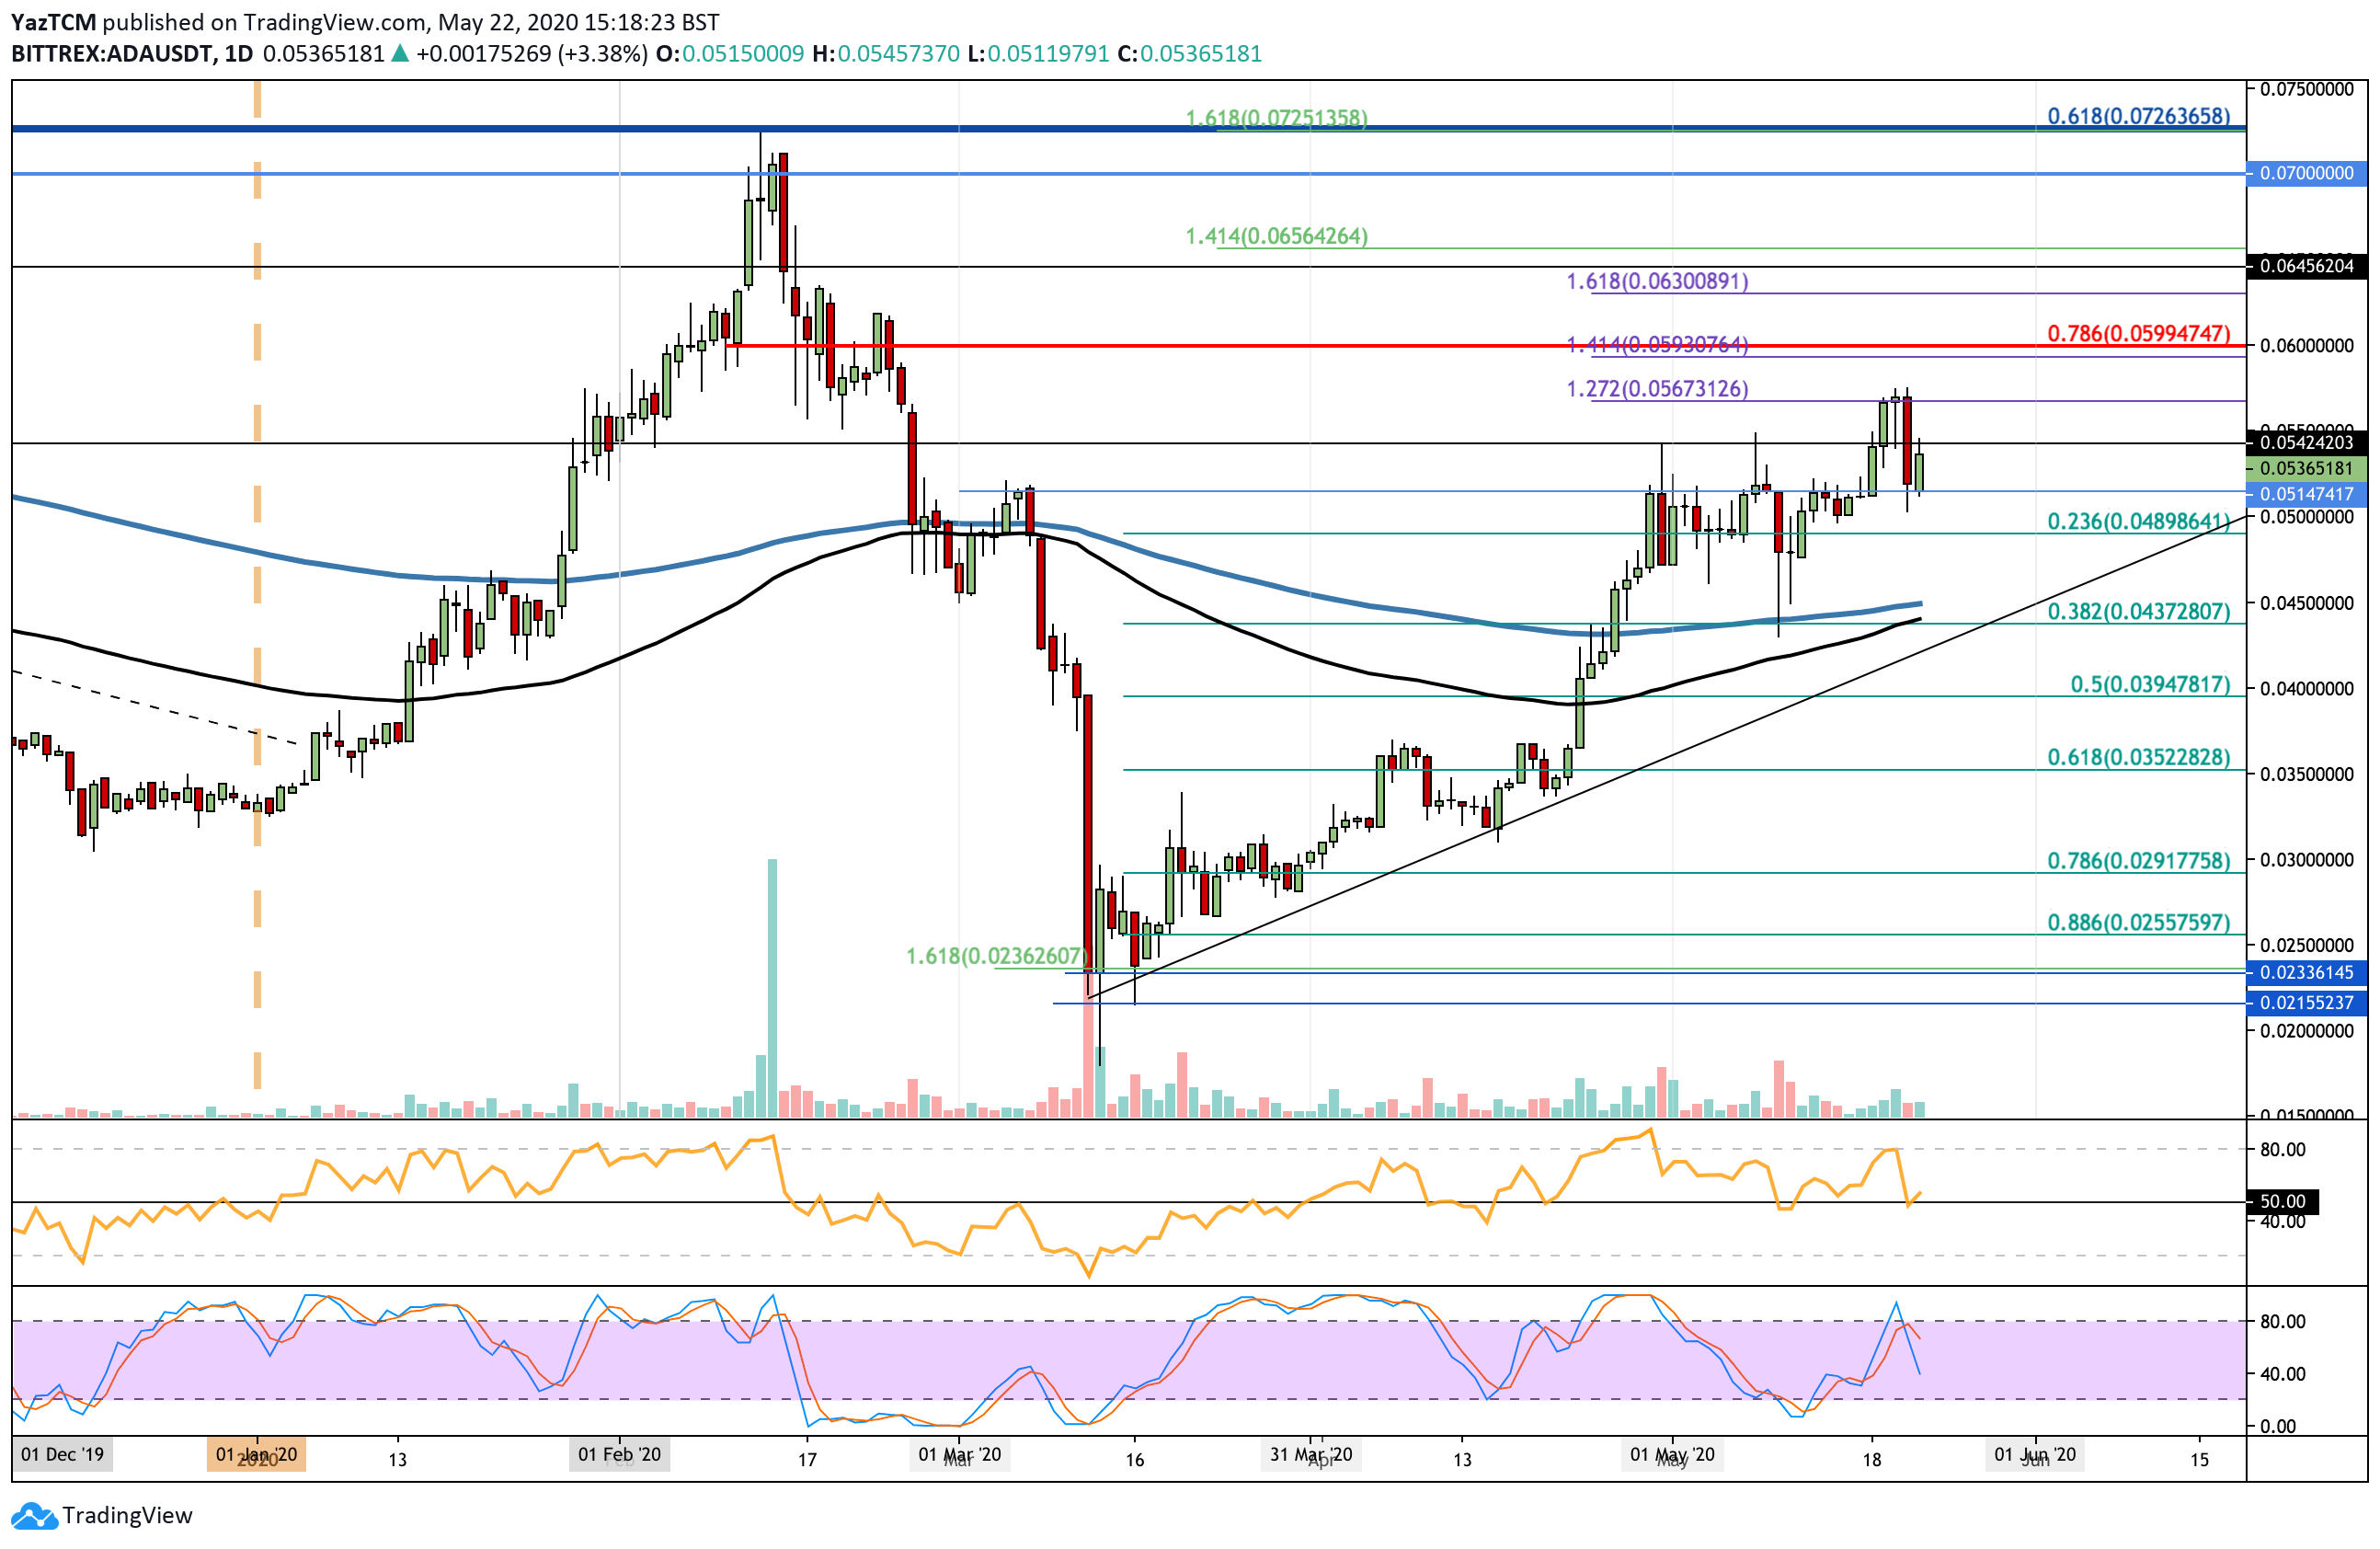
Cardano saw a 6% price increase over the last week of trading as the coin pushed above the $0.05 level and reached as high as $0.056 toward the middle of the week. The coin was struggling to close above the $0.051 level for the majority of May, but this push higher broke that trend. Unfortunately, ADA fell lower from $0.056 as it crashed into the $0.051 level, where it managed to rebound and head back toward $0.053.
Moving forward, if the buyers continue the rebound from $0.051 and push higher, resistance is found at $0.055 and $0.0567 (1.272 Fib Extension). Above this, resistance lies at $0.06 (bearish .786 Fib Retracement), $0.063 (1.618 Fib Extension), $0.065, and $0.07.
On the other side, if the sellers push beneath the $0.051 support, added support is found at $0.049 (.236 Fib Retracement), $0.045 (200-days EMA), $0.043 (.382 Fib Retracement), and the rising trend line.
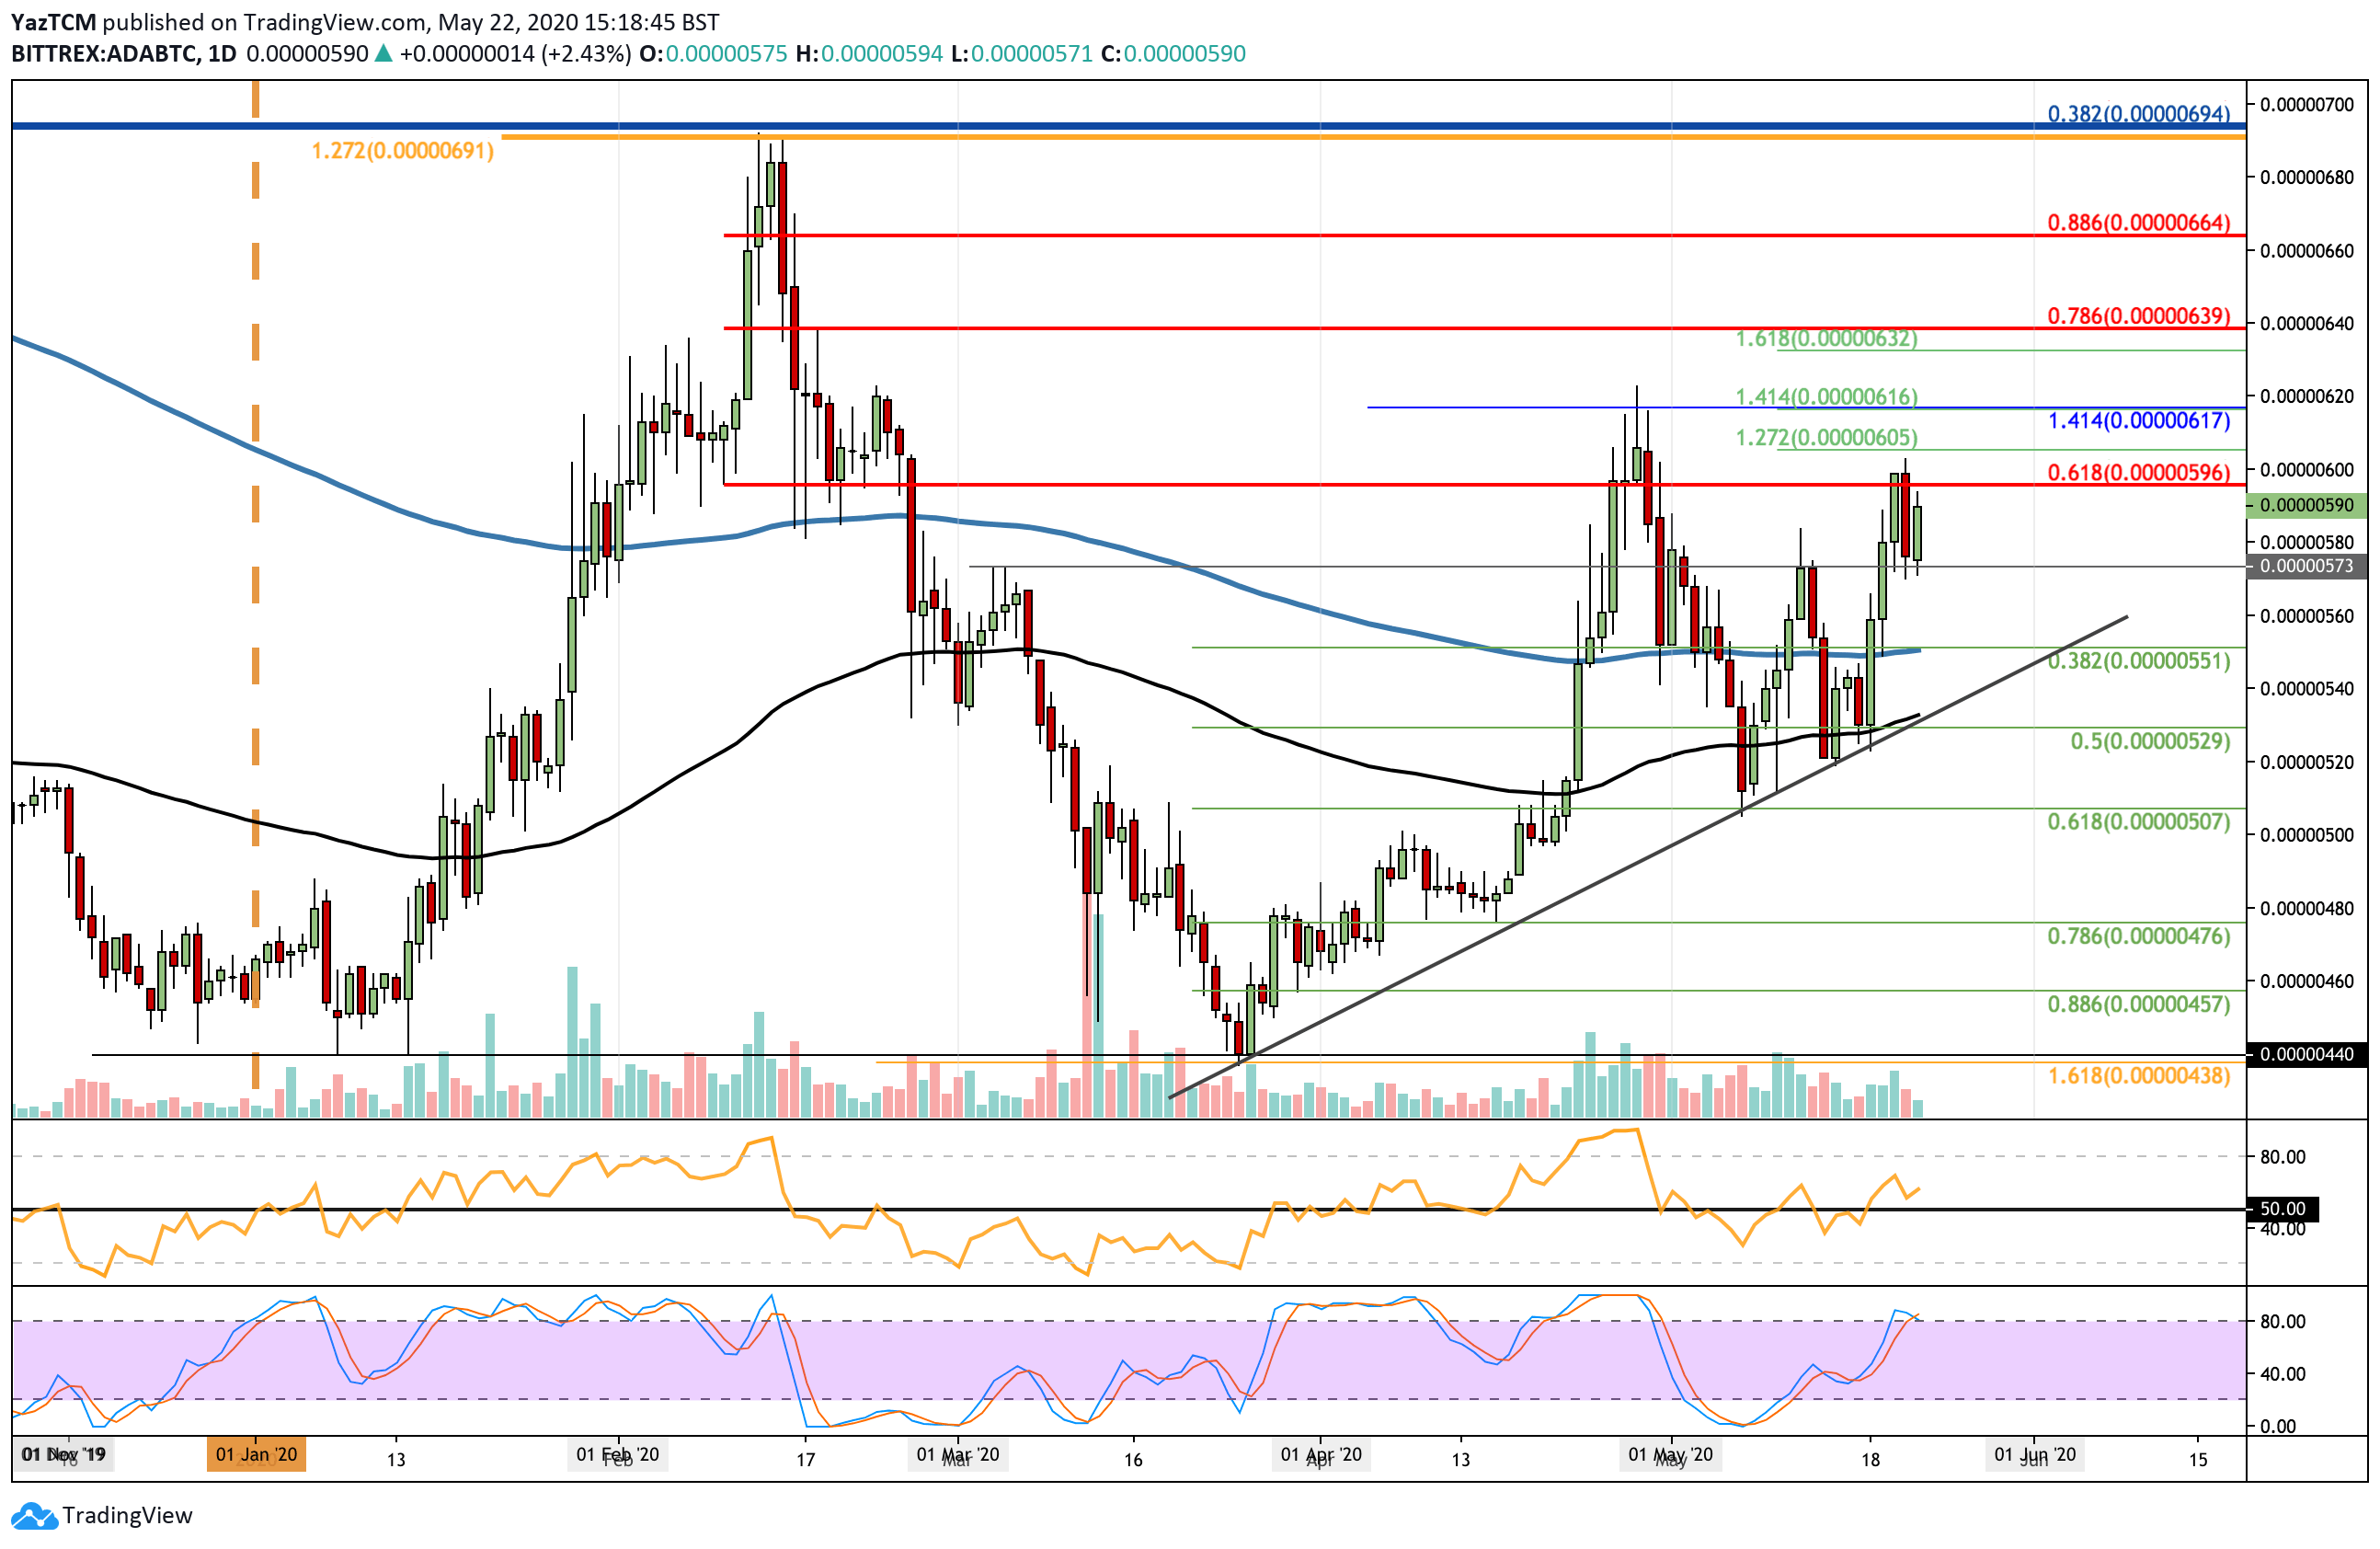
Against Bitcoin, ADA managed to surge by a total of 9% as it increased from 535 SAT to reach the current 587 SAT level. The coin had managed to rise as high as 600 SAT during the week but went on to drop lower into the 575 SAT support where it rebounded.
Looking ahead, if the buyers break 600 SAT, resistance is located at 605 SAT (1.272 Fib Extension), 616 SAT (1.414 Fib Extension), and 640 (bearish .786 Fib Retracement). Additional resistance lies at 664 SAT (bearish .886 Fib retracement), 680 SAT, and 700 SAT.
Alternatively, if the sellers push lower, support lies at 575 SAT, 560 SAT, and 550 SAT (200-days EMA). Beneath this, added support lies at 530 SAT, the rising trend line, and 500 SAT.
TFUEL
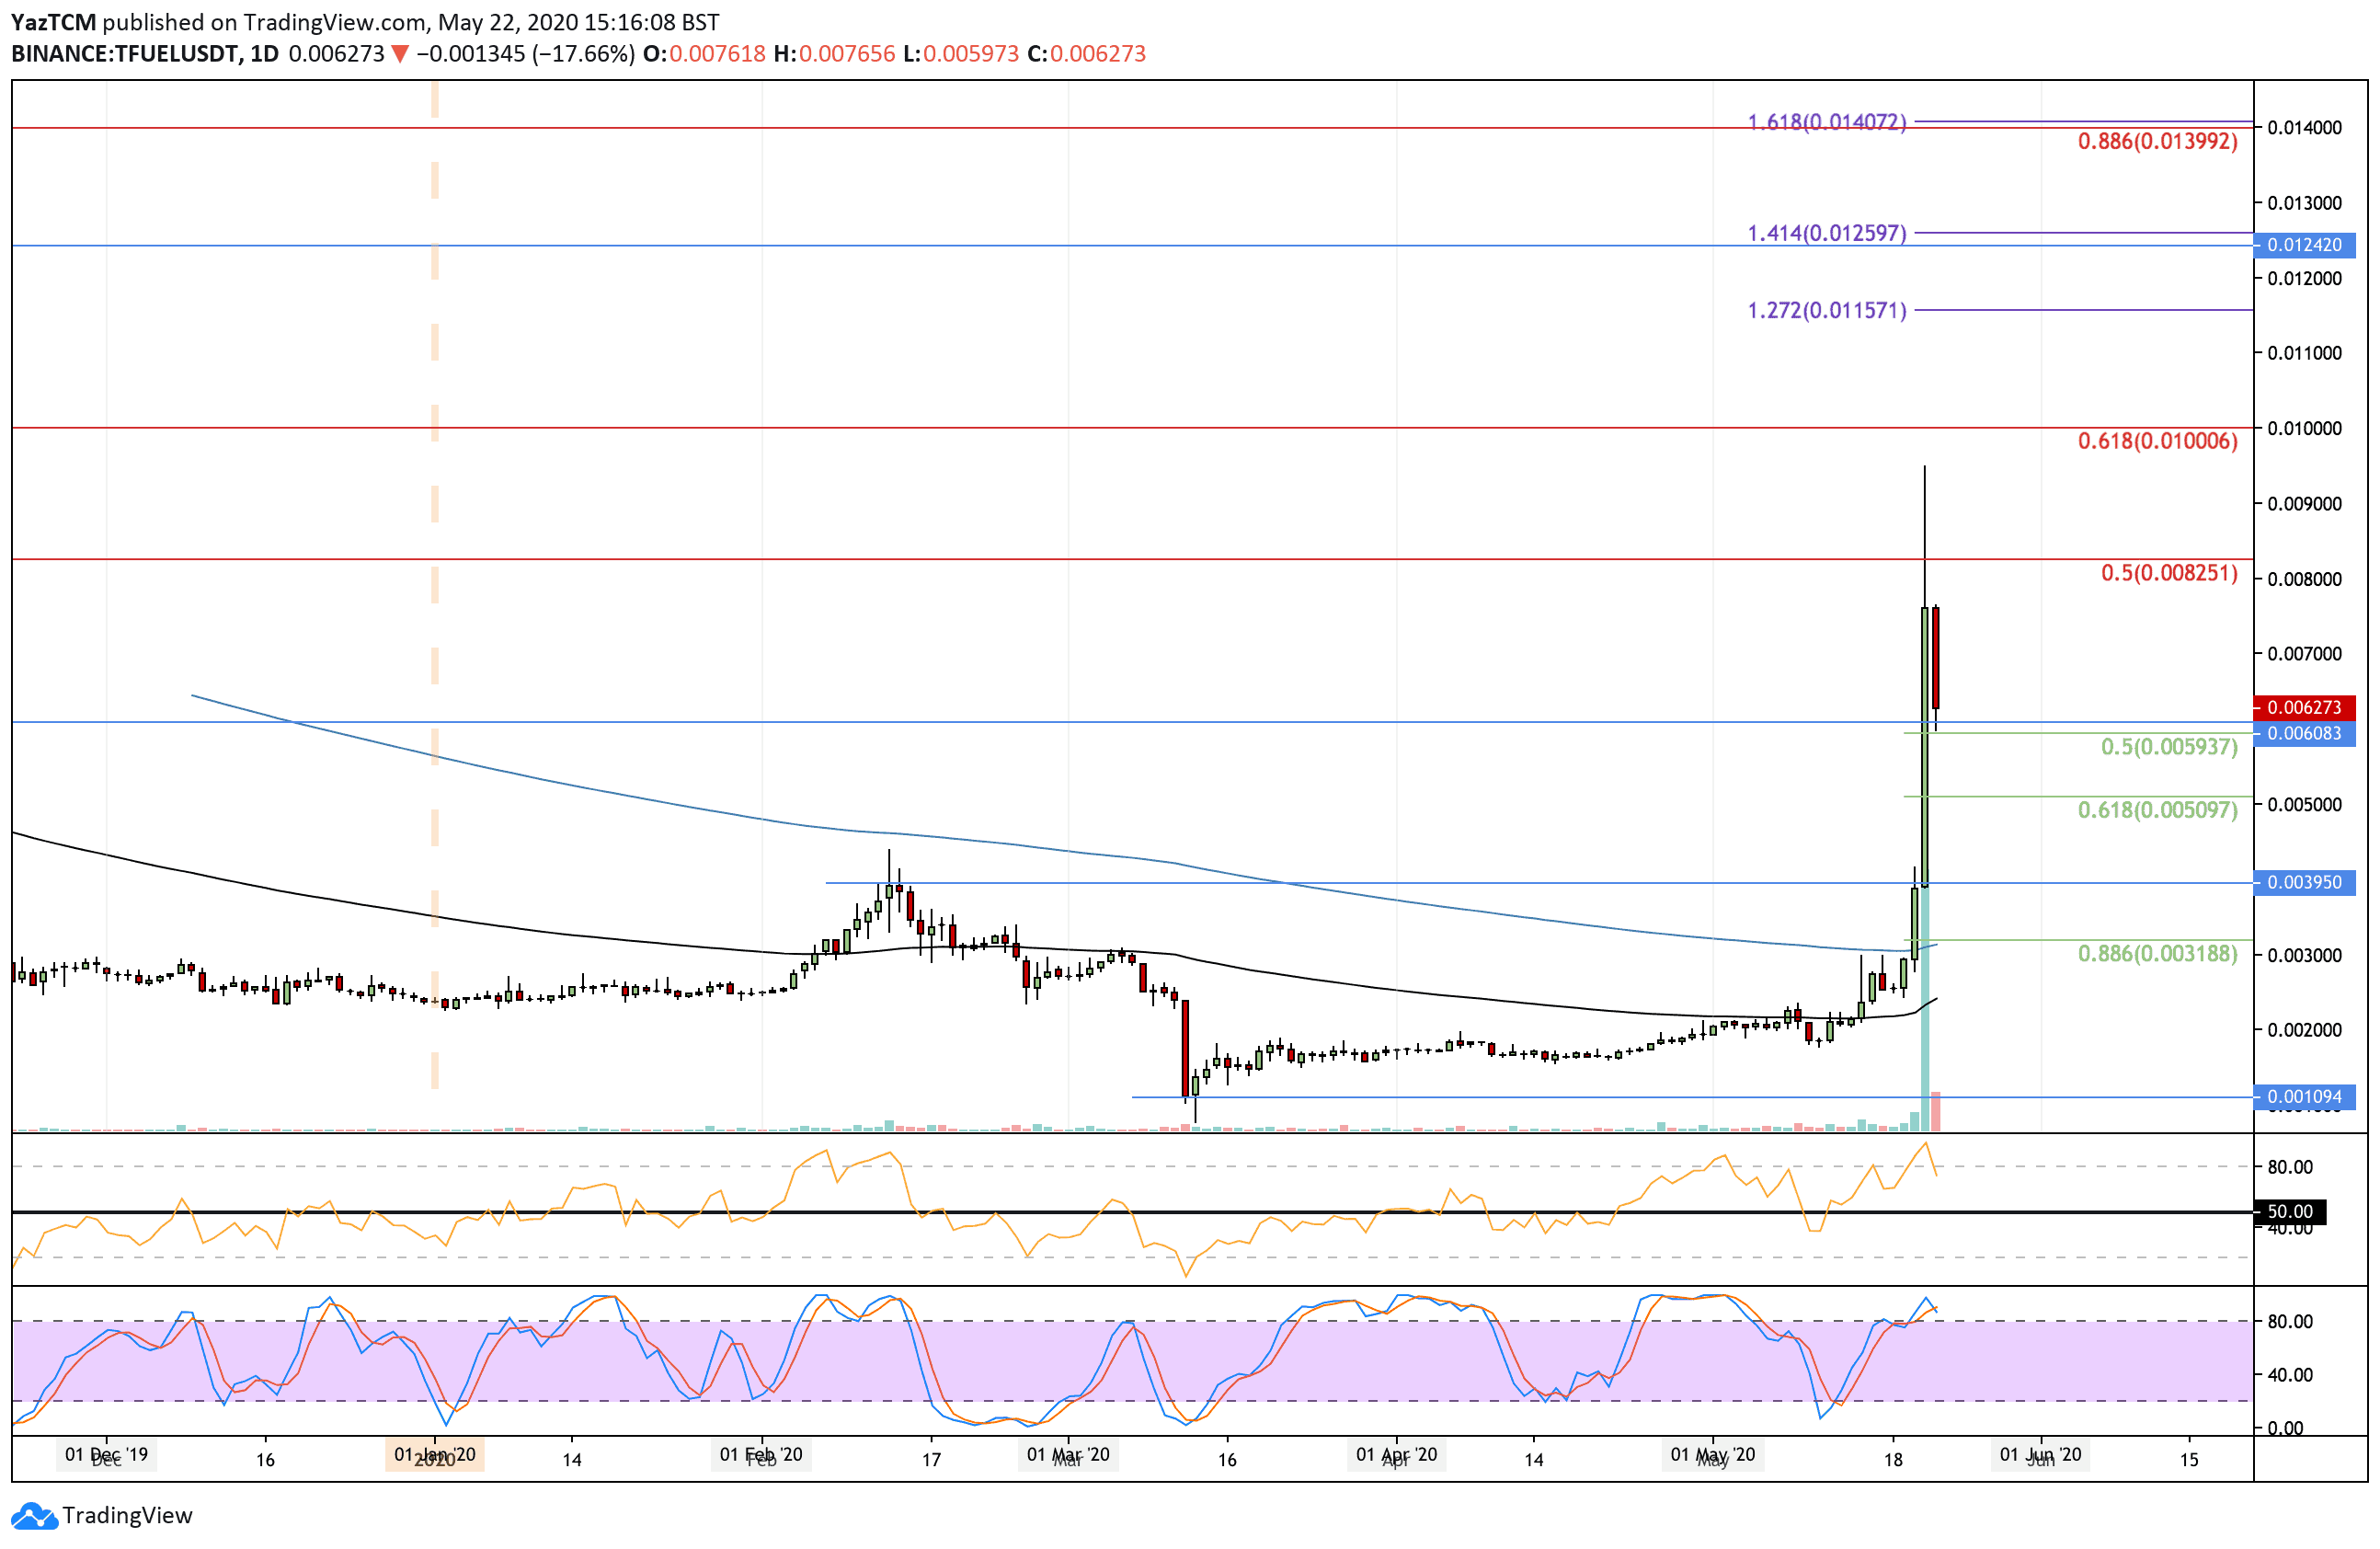
Theta Fuel saw an impressive 168% price explosion this week as the cryptocurrency went from $0.002 to as high as $0.0095. This movement created a fresh 11-month-high for TFUEL as it reached a price that has not been seen since July 2019. The gas-like token for the Theta Network has since dropped slightly as it fell into the $0.00627 level today.
Moving forward, if the buyers rebound from $0.0062 and push higher, the first level of resistance is located at $0.00825 (bearish .5 Fib Retracement). Above this, resistance lies at $0.009, $0.01 (bearish .618 Fib Retracement), $0.0115 (1.272 Fib Extension), and $0.0124.
On the other side, if the sellers push beneath $0.006, support lies at $0.005, $0.00395, $0.00318 (.886 Fib Retracement), and $0.0030.
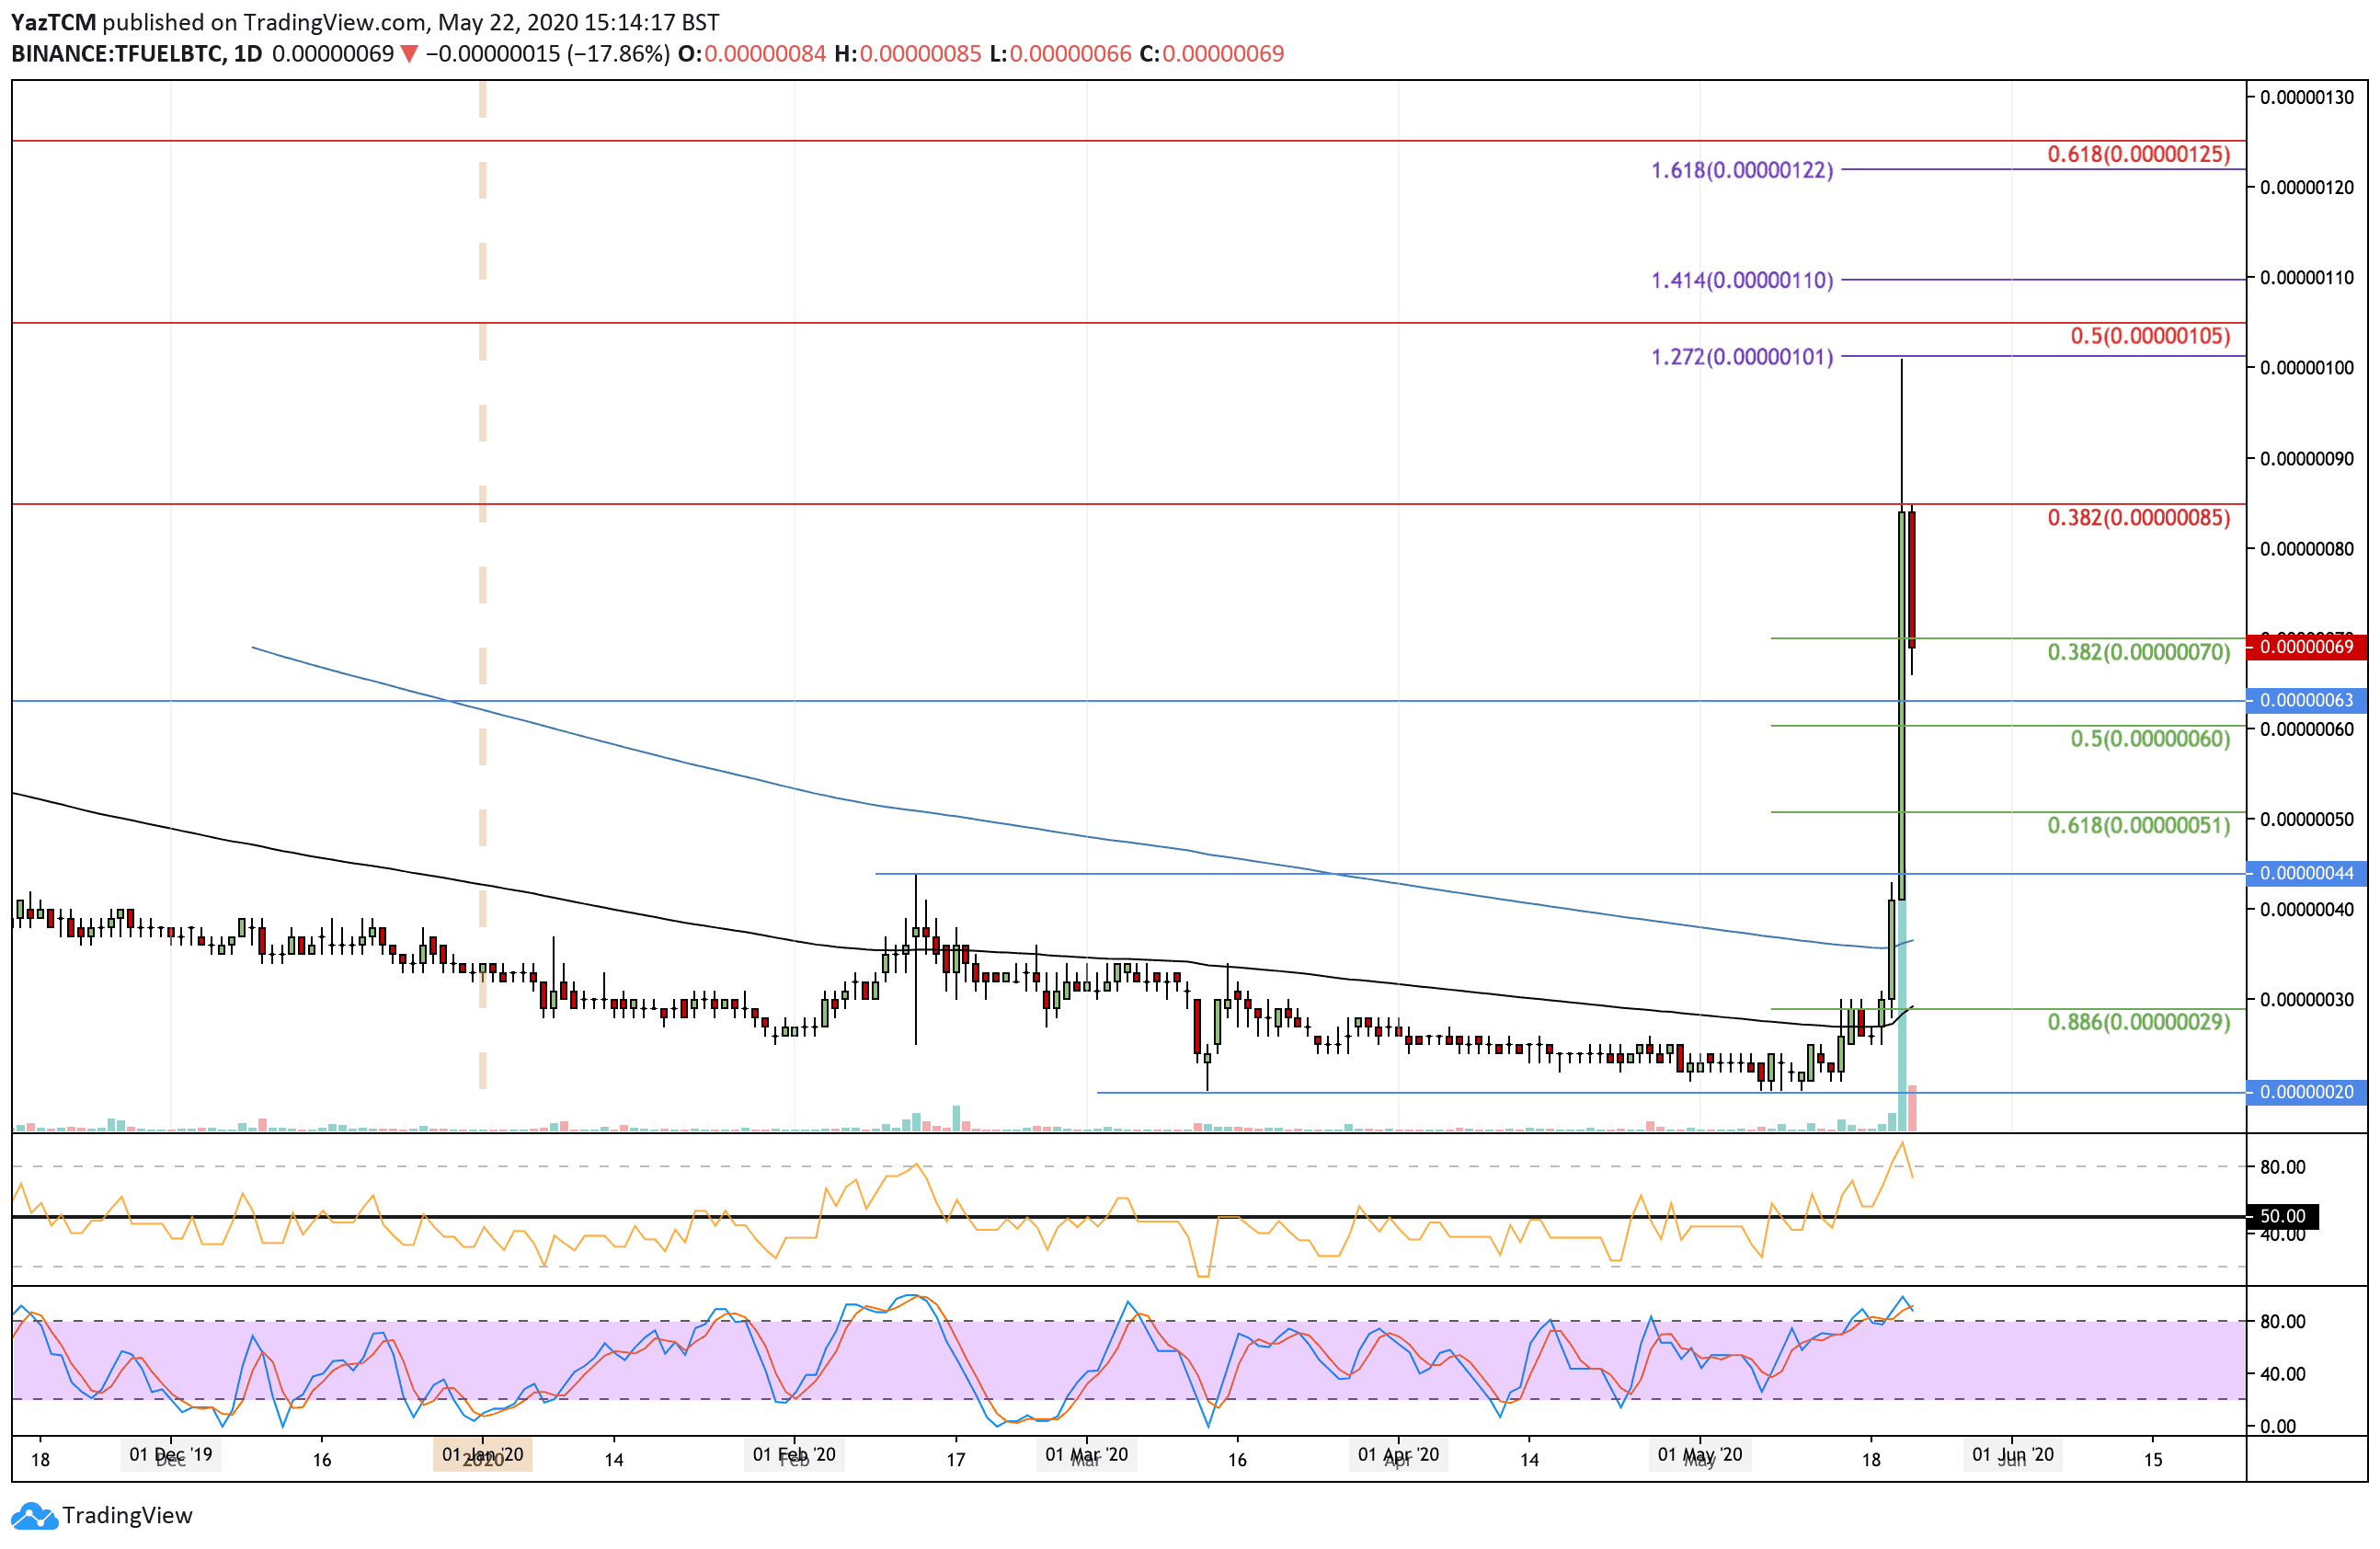
TFUEL managed to increase by a total of 178% against Bitcoin this week as it surged from the 25 SAT level to reach as high as 100 SAT. It has since dropped slightly to reach 70 SAT.
Looking ahead, if the buyers can rebound from 70 SAT and push higher, resistance is located at 80 SAT, 85 SAT (bearish .382 Fib Retracement), 90 SAT, and 100 SAT. Beyond 100 SAT, resistance lies at 105 SAT (bearish .5 Fib Retracement), 110 SAT (1.414 Fib Extension), and 125 SAT (bearish .618 Fib Retracement).
Alternatively, if the sellers push beneath 70 SAT, support is located at 63 SAT, 60 SAT (.5 Fib Retracement), 50 SAT (.618 Fib Retracement), and 44 SAT.
