BitcoinBitcoin saw a small 4% price drop this week as it headed into the ,300 support (downside 1.272 Fib Extension). During the week, the coin broke beneath the August rising trend line. The bulls attempted to recover, but the previous support flipped into resistance and the buyers failed to overcome it.On Tuesday, Bitcoin plummeted by 6% from ,770 to a low of ,150 (.382 Fib Retracement). Luckily, the bulls pushed higher to close the daily candle above the ,300 support (downside 1.272 Fib Extension). Since reaching this support, the buyers have closed every daily candle above this level.Looking ahead, if the bulls can rebound from here, the first level of resistance is expected at ,650. This is followed by resistance at ,800, ,000, and ,300.On the other side, if
Topics:
Yaz Sheikh considers the following as important: Bitcoin (BTC) Price, BTC Analysis, BTCEUR, BTCGBP, btcusd, btcusdt, Chainlink (LINK) Price, DOTUSD, DOTUSDT, ETH Analysis, ETHBTC, Ethereum (ETH) Price, ethusd, LINKBTC, LINKUSD, Market Updates, polkadot, Price Analysis, Ripple (XRP) Price, XRP Analysis, xrpbtc, xrpusd
This could be interesting, too:
Chayanika Deka writes XRP, SOL, and ADA Inclusion in US Crypto Reserve Pushes Traders on Edge
Chayanika Deka writes Why Arthur Hayes Is Bullish on Bitcoin Under Trump’s Economic Strategy
Mandy Williams writes Why the Bitcoin Market Is Stuck—and the Key Metric That Could Change It: CryptoQuant CEO
Wayne Jones writes Metaplanet Acquires 156 BTC, Bringing Total Holdings to 2,391
Bitcoin
Bitcoin saw a small 4% price drop this week as it headed into the $11,300 support (downside 1.272 Fib Extension). During the week, the coin broke beneath the August rising trend line. The bulls attempted to recover, but the previous support flipped into resistance and the buyers failed to overcome it.
On Tuesday, Bitcoin plummeted by 6% from $11,770 to a low of $11,150 (.382 Fib Retracement). Luckily, the bulls pushed higher to close the daily candle above the $11,300 support (downside 1.272 Fib Extension). Since reaching this support, the buyers have closed every daily candle above this level.
Looking ahead, if the bulls can rebound from here, the first level of resistance is expected at $11,650. This is followed by resistance at $11,800, $12,000, and $12,300.
On the other side, if $11,300 breaks, support lies at $11,150 (.382 Fib Retracement), $11,000, and $10,740 (.5 Fib Retracement).

Ethereum
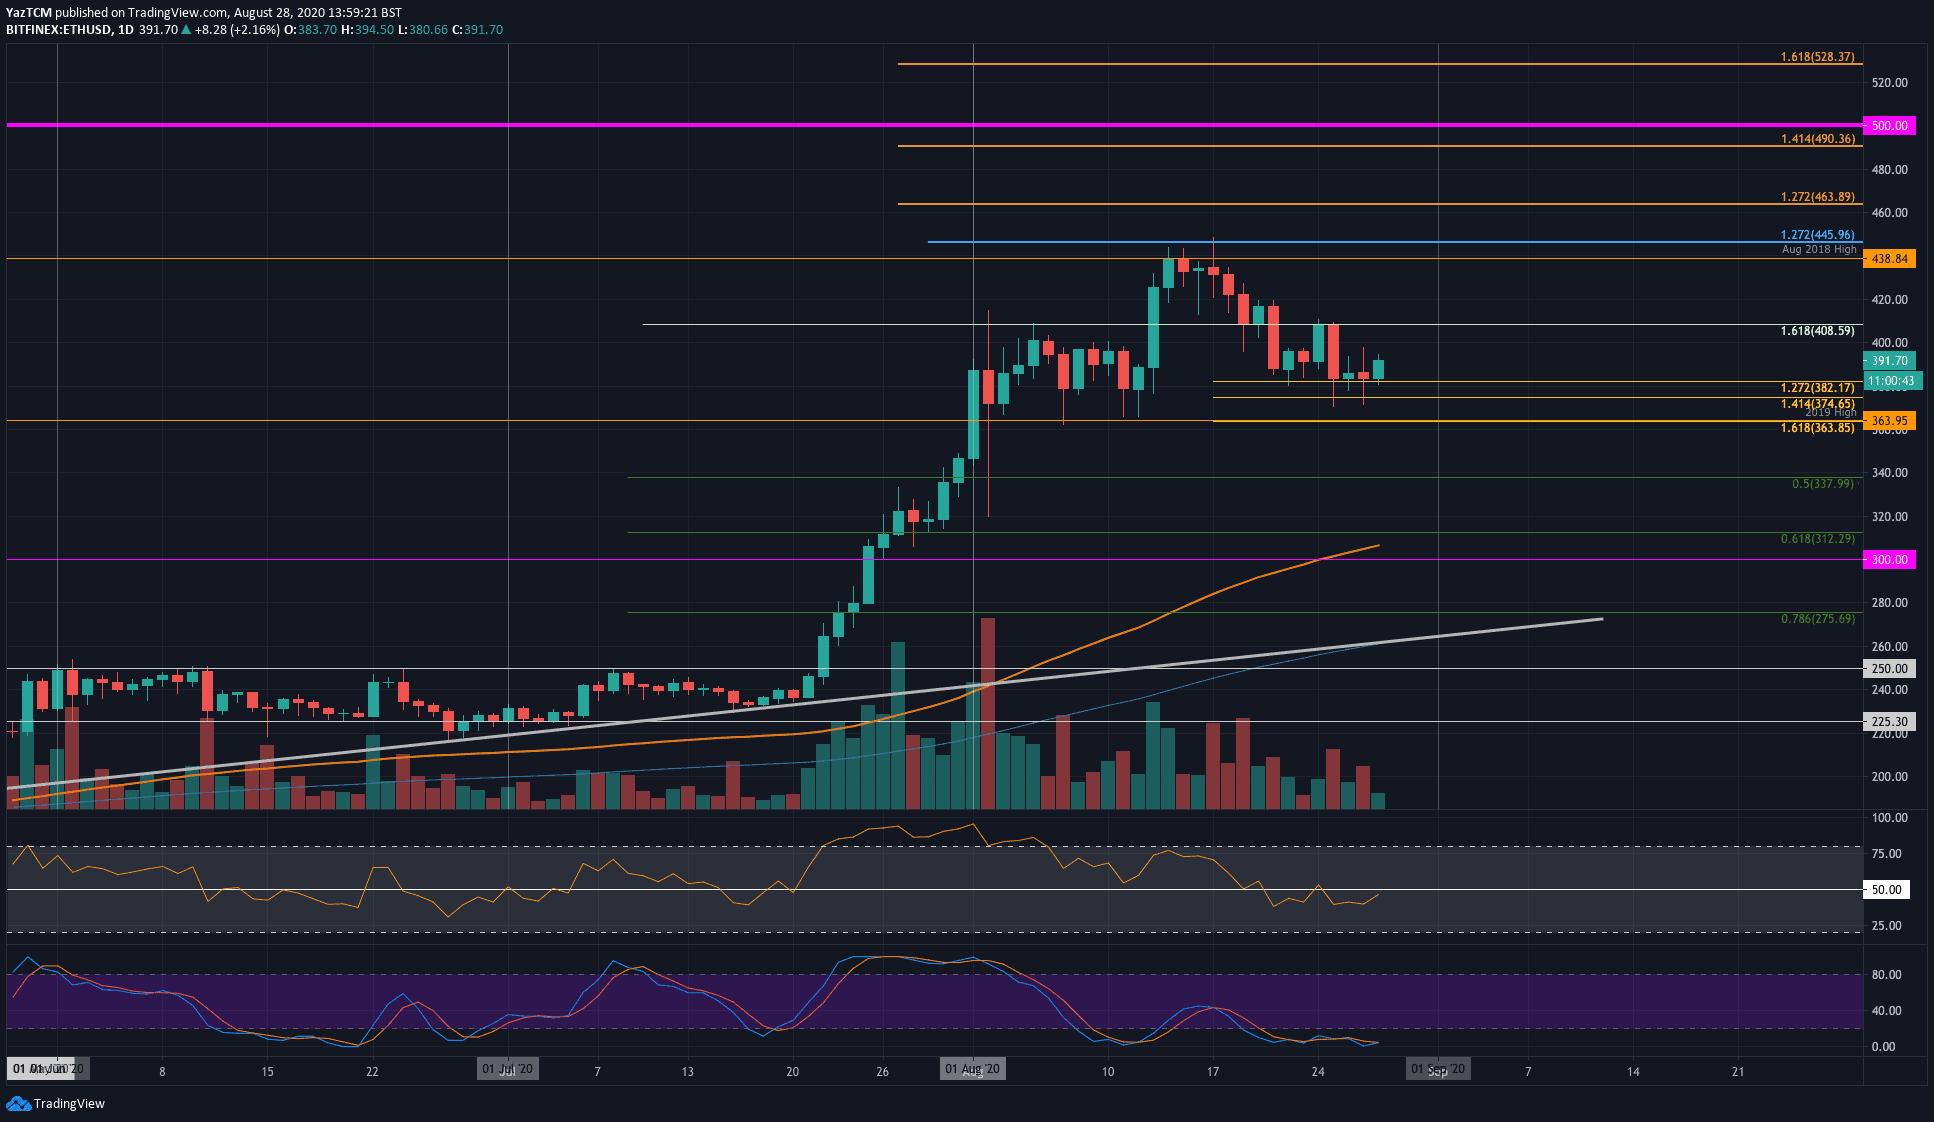
Ethereum saw a slightly steeper 6.6% price drop this past week as it reached the $382 support (downside 1.272 Fib Extension). Last week, the coin slipped beneath the $400 level as the selling pressure started to mount.
After breaking $400, Ethereum dropped until the aforementioned $382 support was found. The sellers pushed beneath this on multiple occasions, but the bulls always recovered to close each daily candle above the support.
The bulls are looking to rebound from this support. If they continue higher, the first two levels of resistance lie at $400 and $410. This is followed by resistance at $438 (August 2018 High), $450, and $463.
Alternatively, if the support at $382 breaks, additional support lies at $375 (downside 1.414 Fib Extension), $363 (2019 High and .382 Fib Retracement), and $342 (August 2020 Opening Price).
Against Bitcoin, Etheruem was trading in a descending price channel since mid-August. The coin has continuously fallen in this price channel over the past two weeks. Support was found around the 0.0337 BTC level (March 2019 Support) as the bulls battled to keep above it.
Over the past 24-hours, Ethereum managed to penetrate this channel’s upper boundary, indicating a potential push higher.
If the bulls continue, resistance lies at 0.0347 BTC, 0.0352 BTC, and 0.0361 BTC (March 2019 High).
Alternatively, support lies at 0.003 BTC, 0.0329 BTC (.382 Fib Retracement), and 0.032 BTC.

Ripple
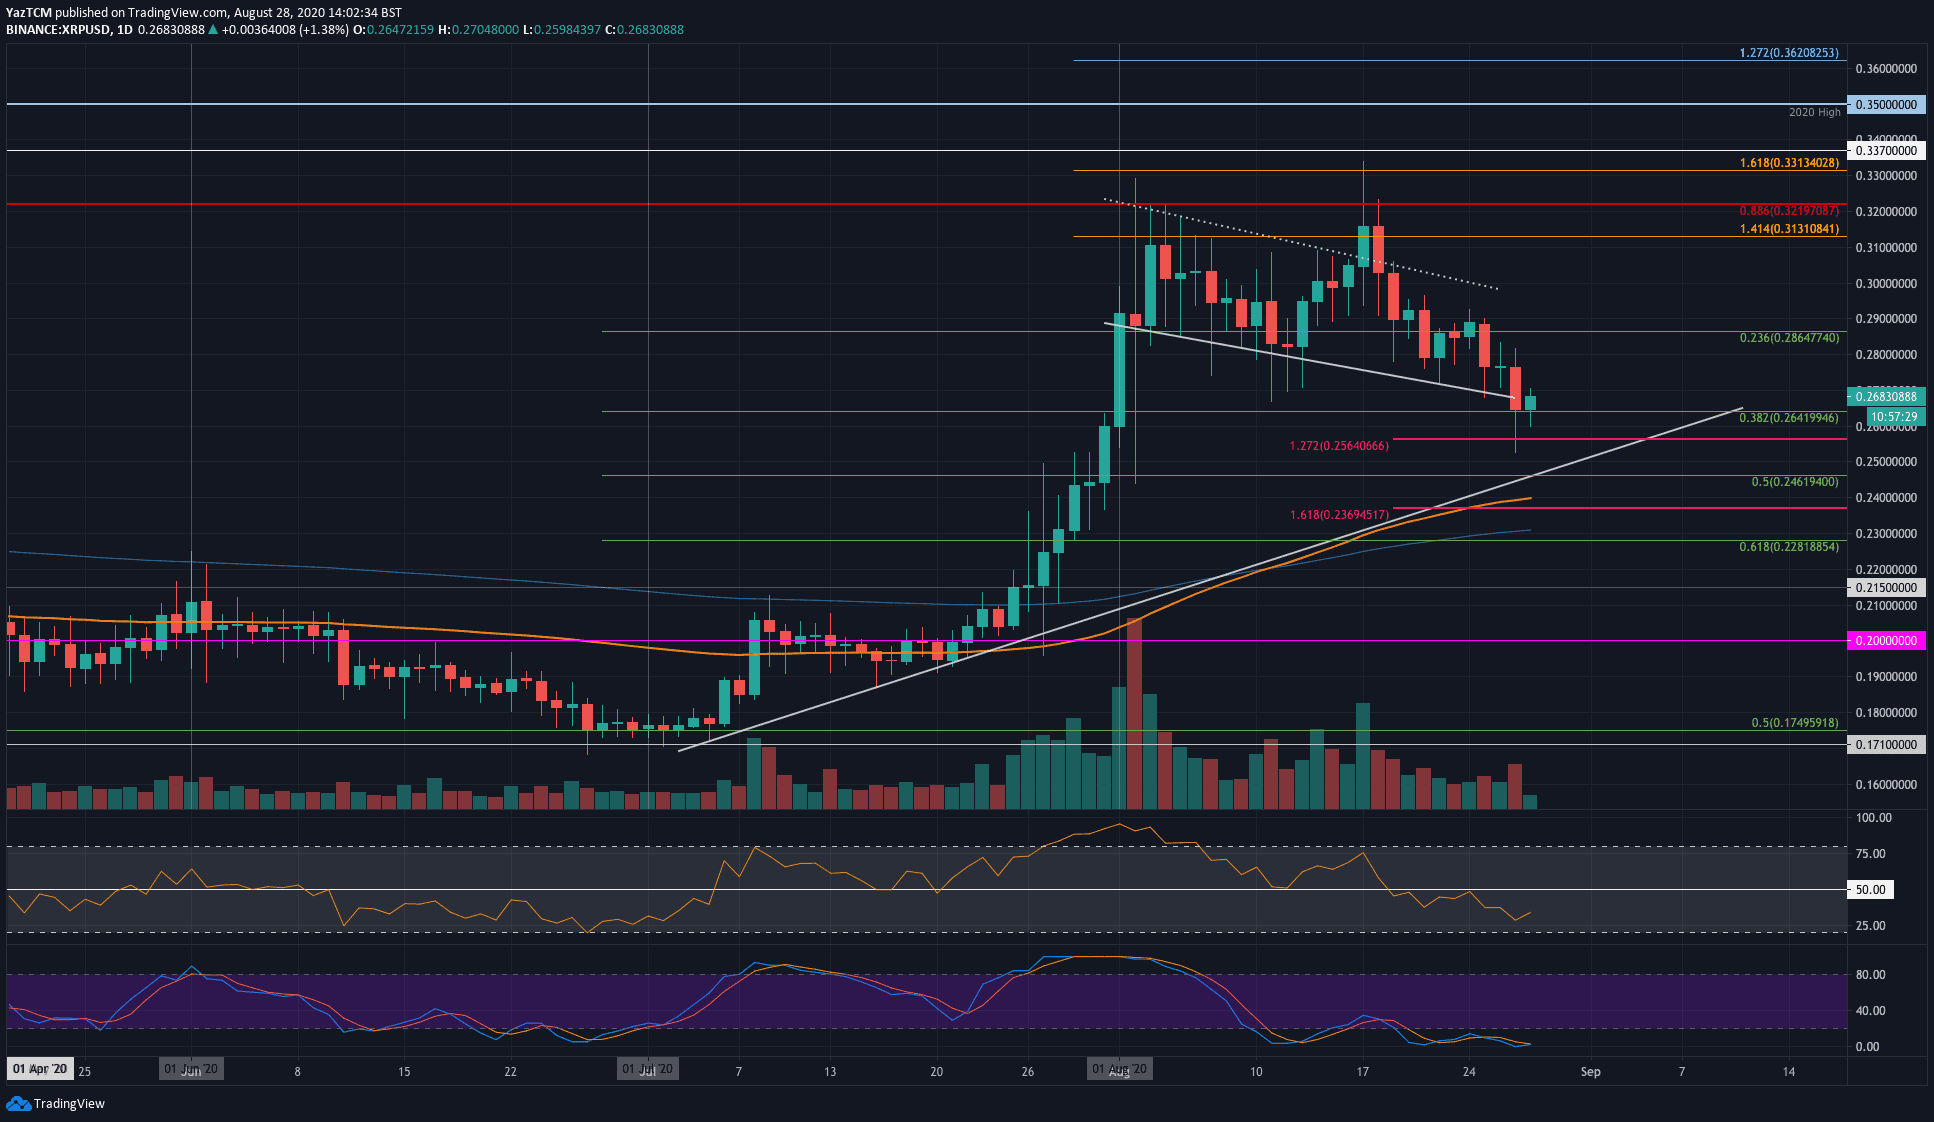
XRP suffered an even steeper 8.88% price drop over the past week as it fell into the $0.364 support (.382 Fib Retracement). XRP was trading in a falling price channel throughout the entire period of August.
Yesterday, it fell by 10% as it dropped from $0.28 to $0.251. The bulls did quickly recover to allow XRP to close the daily candle above the .382 Fib Retracement. Nevertheless, XRP penetrated beneath the price channel as the bearish outlook continues.
If the sellers push beneath $0.264 (.382 Fib Retracement), support lies at $).256 (downside 1.272 Fib Extension), $0.245 (.5 Fib Retracement & rising trend line), and $0.246 (.5 Fib Retracement).
On the other side, resistance lies at $0.28, $0.292, and $0.3.
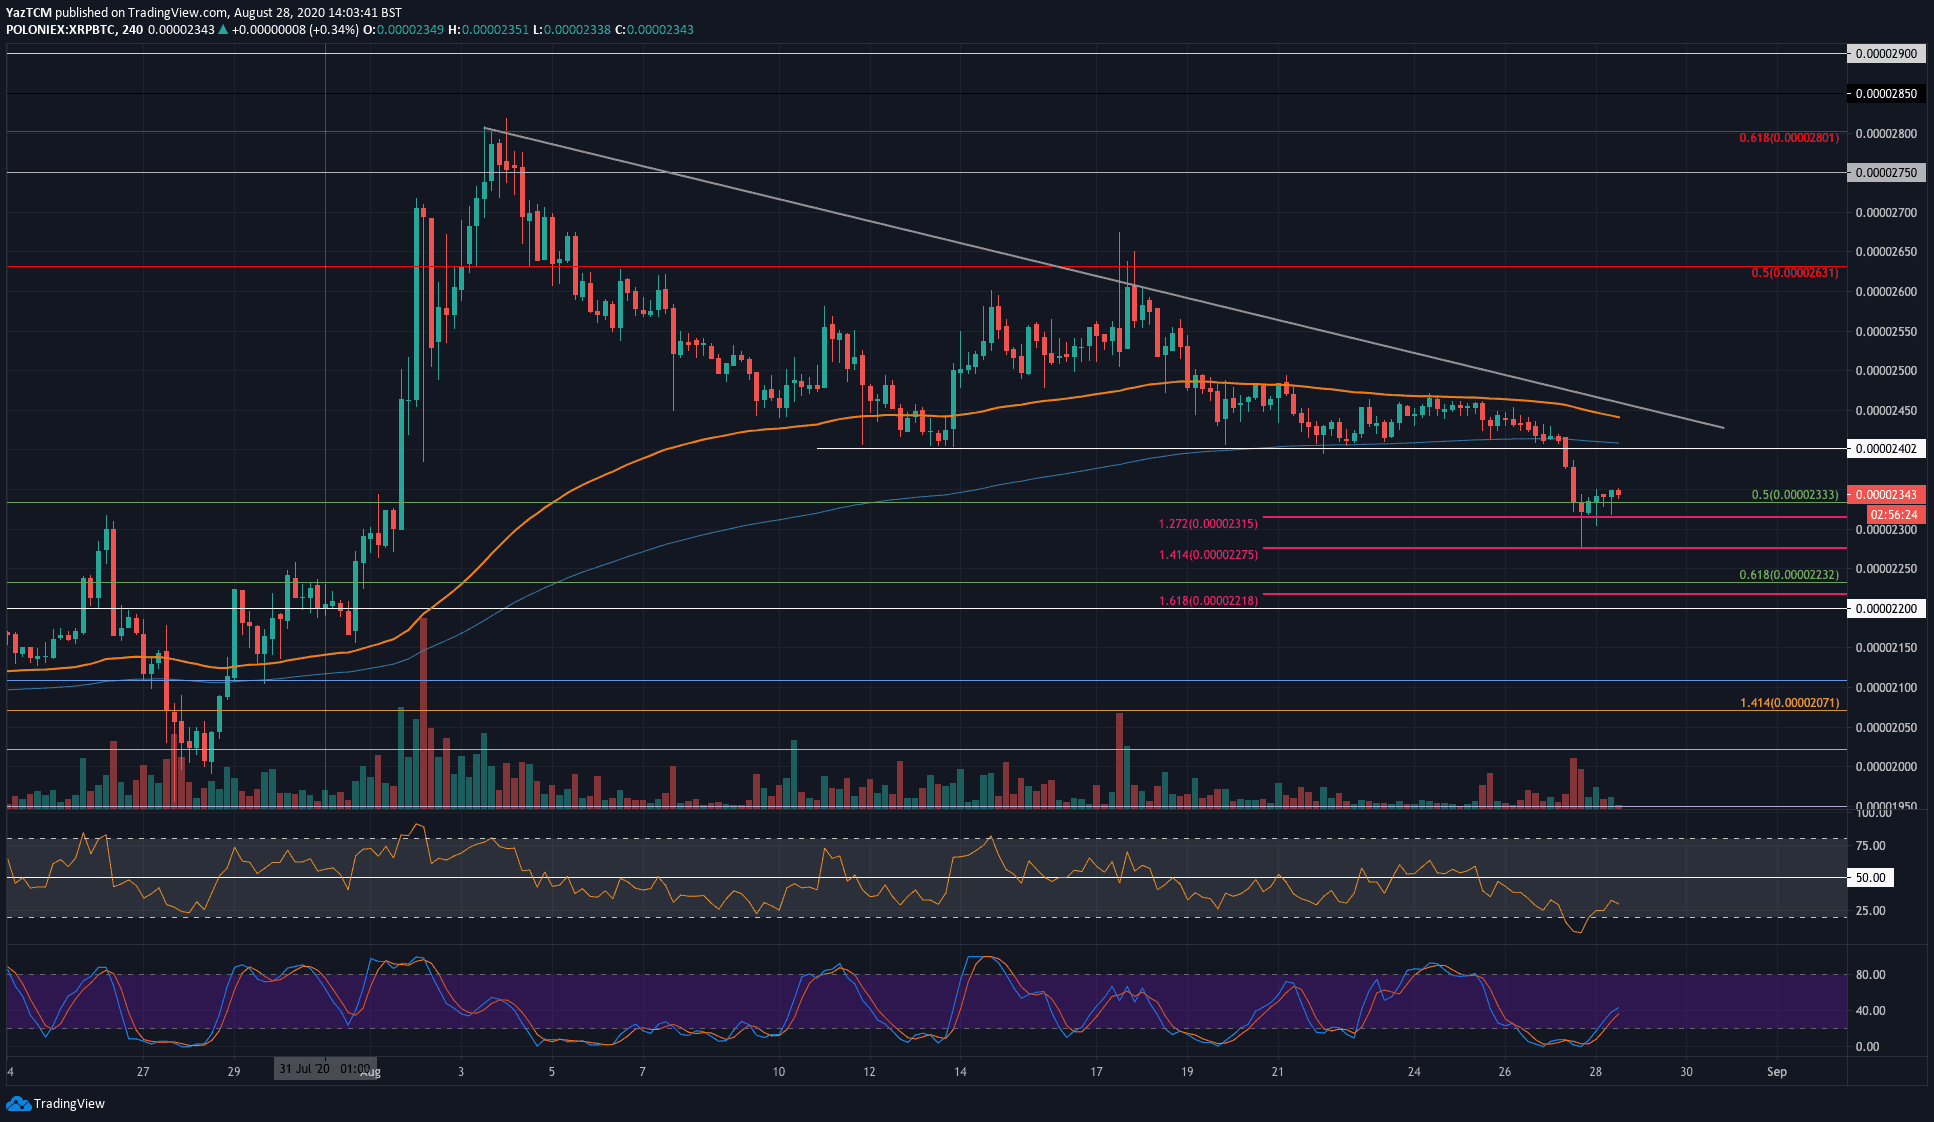
Against Bitcoin, XRP was trading in a descending triangle throughout August. The coin established a base at the 2400 SAT level toward the middle of the month. Unfortunately, the sellers penetrated beneath this support yesterday as they pushed XRP into the 2315 SAT support (downside 1.272 Fib Extension).
The bulls have since rebounded as the price is trading at 2350 SAT.
Moving forward, if the sellers continue beneath 2315 SAT, support lies at 2275 SAT (downside 1.414 Fib Extension), 2232 SAT (.618 Fib Retracement), and 2150 SAT (August 2020 low).
On the other side, resistance lies at 2400 SAT, 2500 SAT, and 2630 SAT.
Chainlink
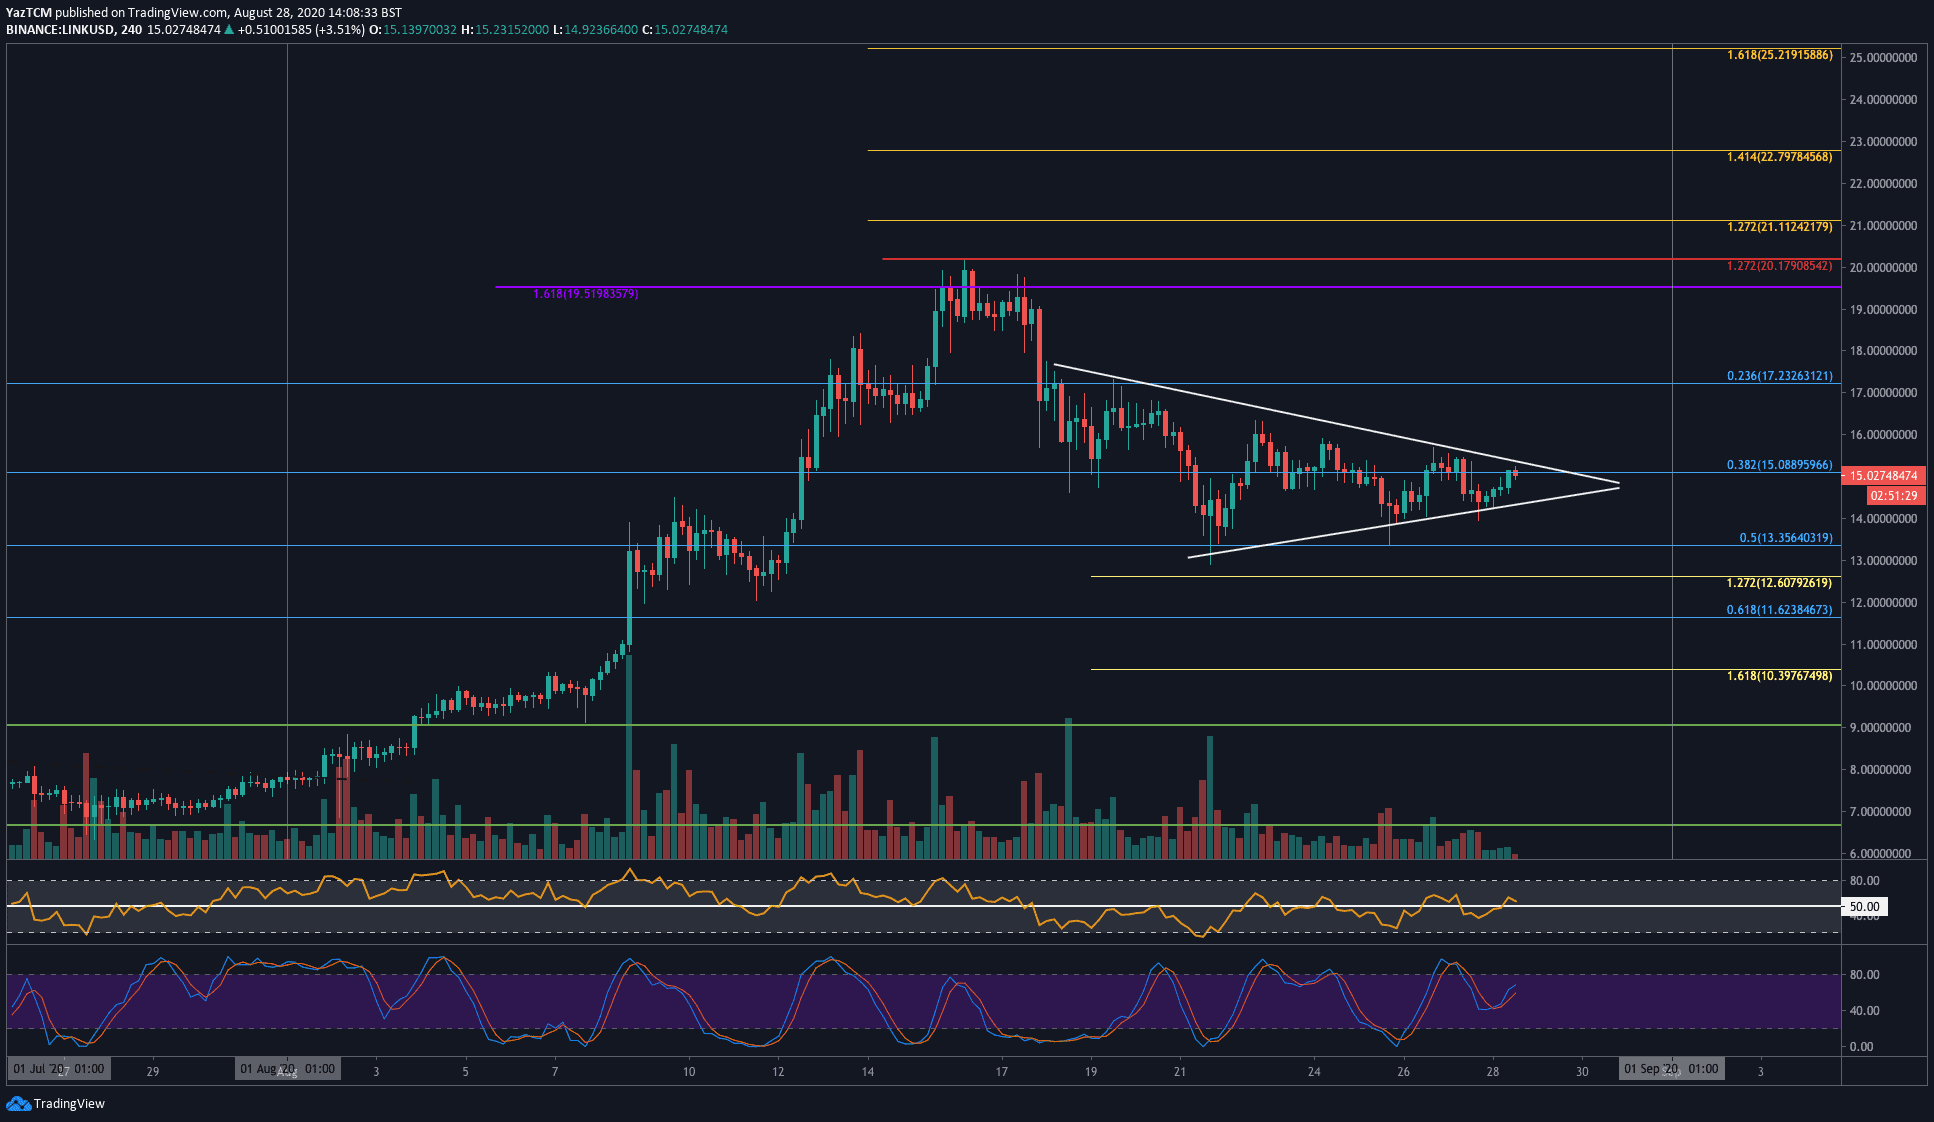
Chainlink fell by almost 10% this week as it drops into the $15 level. During the week, LINK found strong support at the .5 Fib Retracement level at $13.35 and rebounded higher from here.
The coin is trading within a short-term symmetrical triangle on the 4HR chart and must break this consolidation pattern to dictate the market’s next direction.
If the bulls break the triangle’s upper boundary, resistance lies at $16, $17.23, and $20.17 (1.272 Fib Extension).
On the other side, if the sellers break beneath the triangle, support lies at $14, $13.35 (.5 Fib Retracement), and $12.60 (Downside 1.272 Fib Extension).
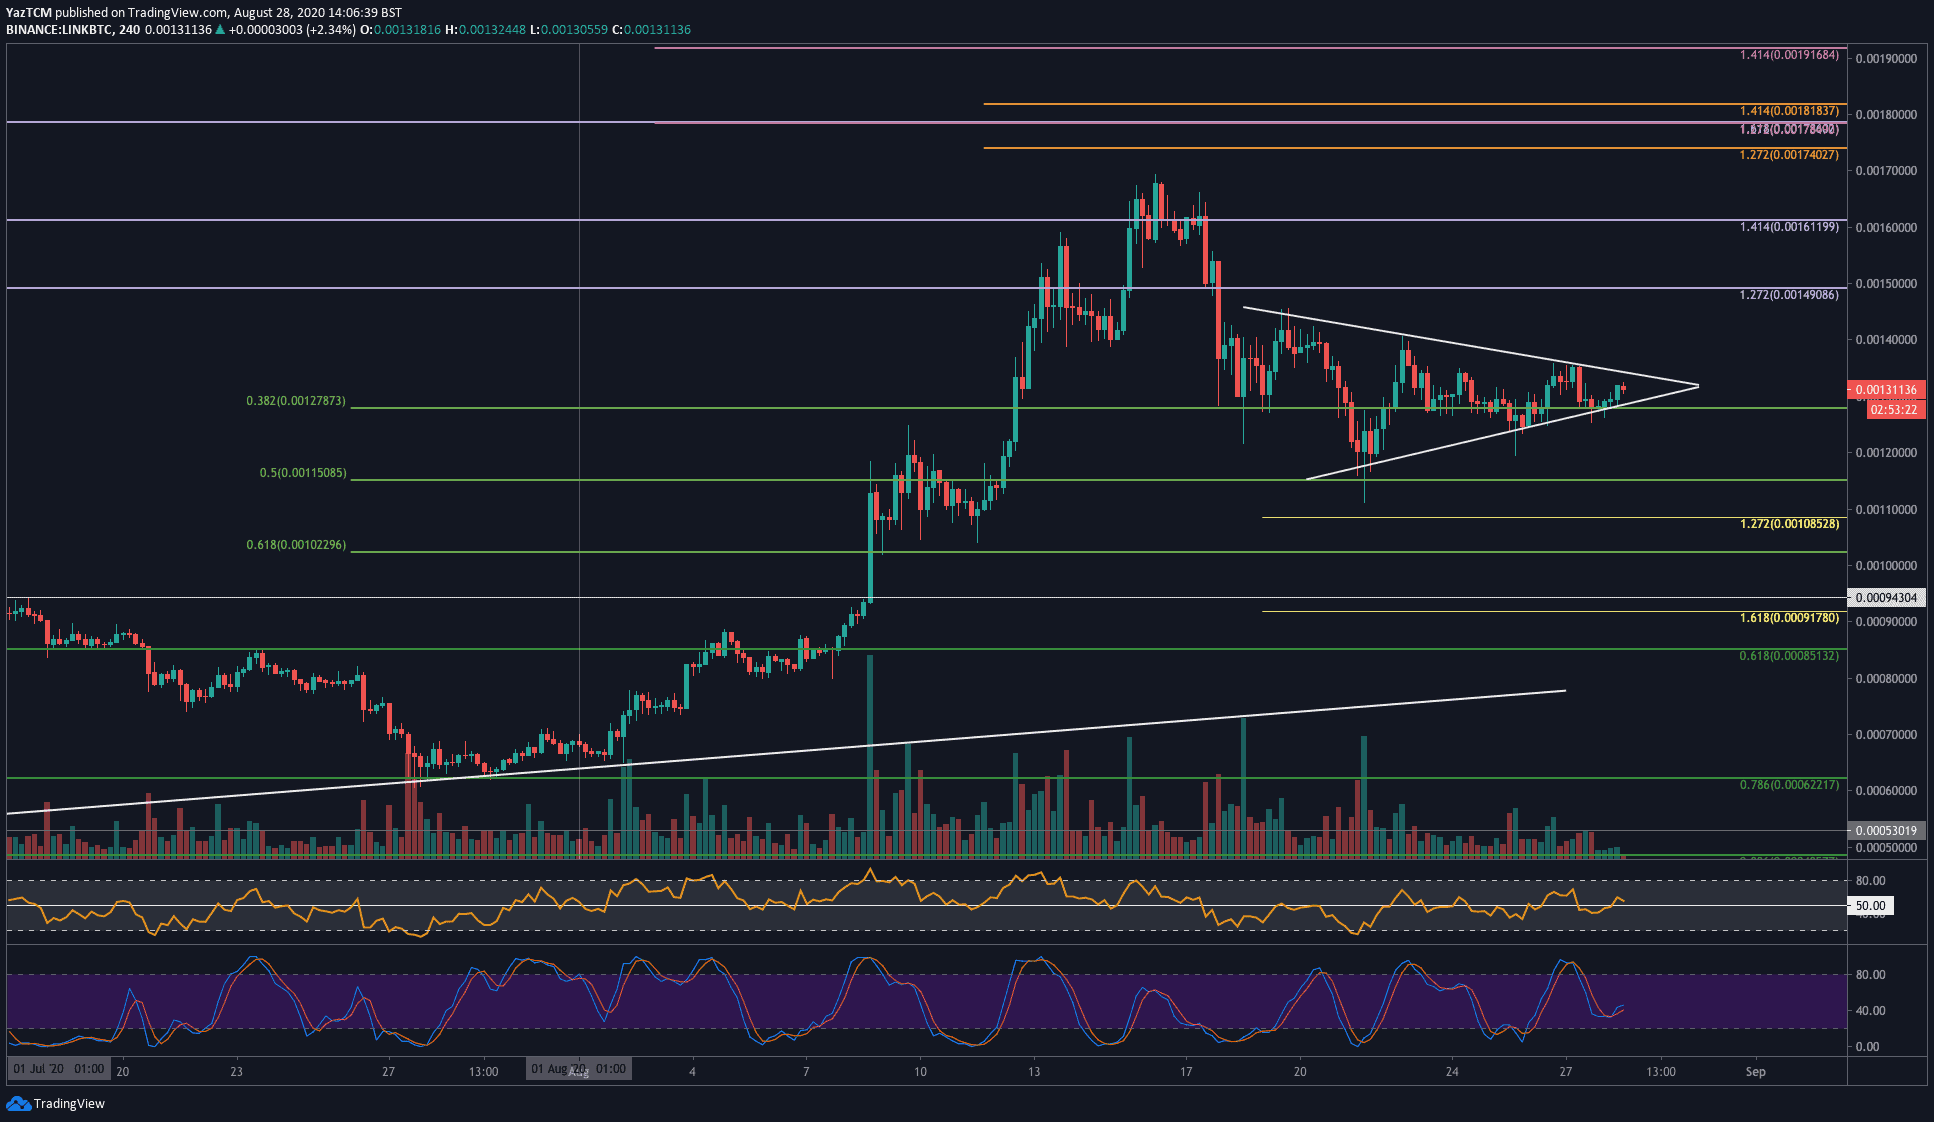
The situation is relatively similar to LINK against Bitcoin. During the week, it found support at the .5 Fib Retracement at 0.00115 BTC as the coin rebounded. From there, it created a symmetrical triangle pattern and has been trapped within the boundaries since.
If the bulls can break the upper boundary of this consolidation, resistance lies at 0.0014 BTC, 0.00149 BTC, and 0.0017 BTC.
On the other side, if the sellers break beneath the triangle, support lies at 0.0012 BTC, 0.00115 BTC (.5 Fib Retracement), and 0.00108 BTC (downside 1.272 Fib Extension).
Polkadot
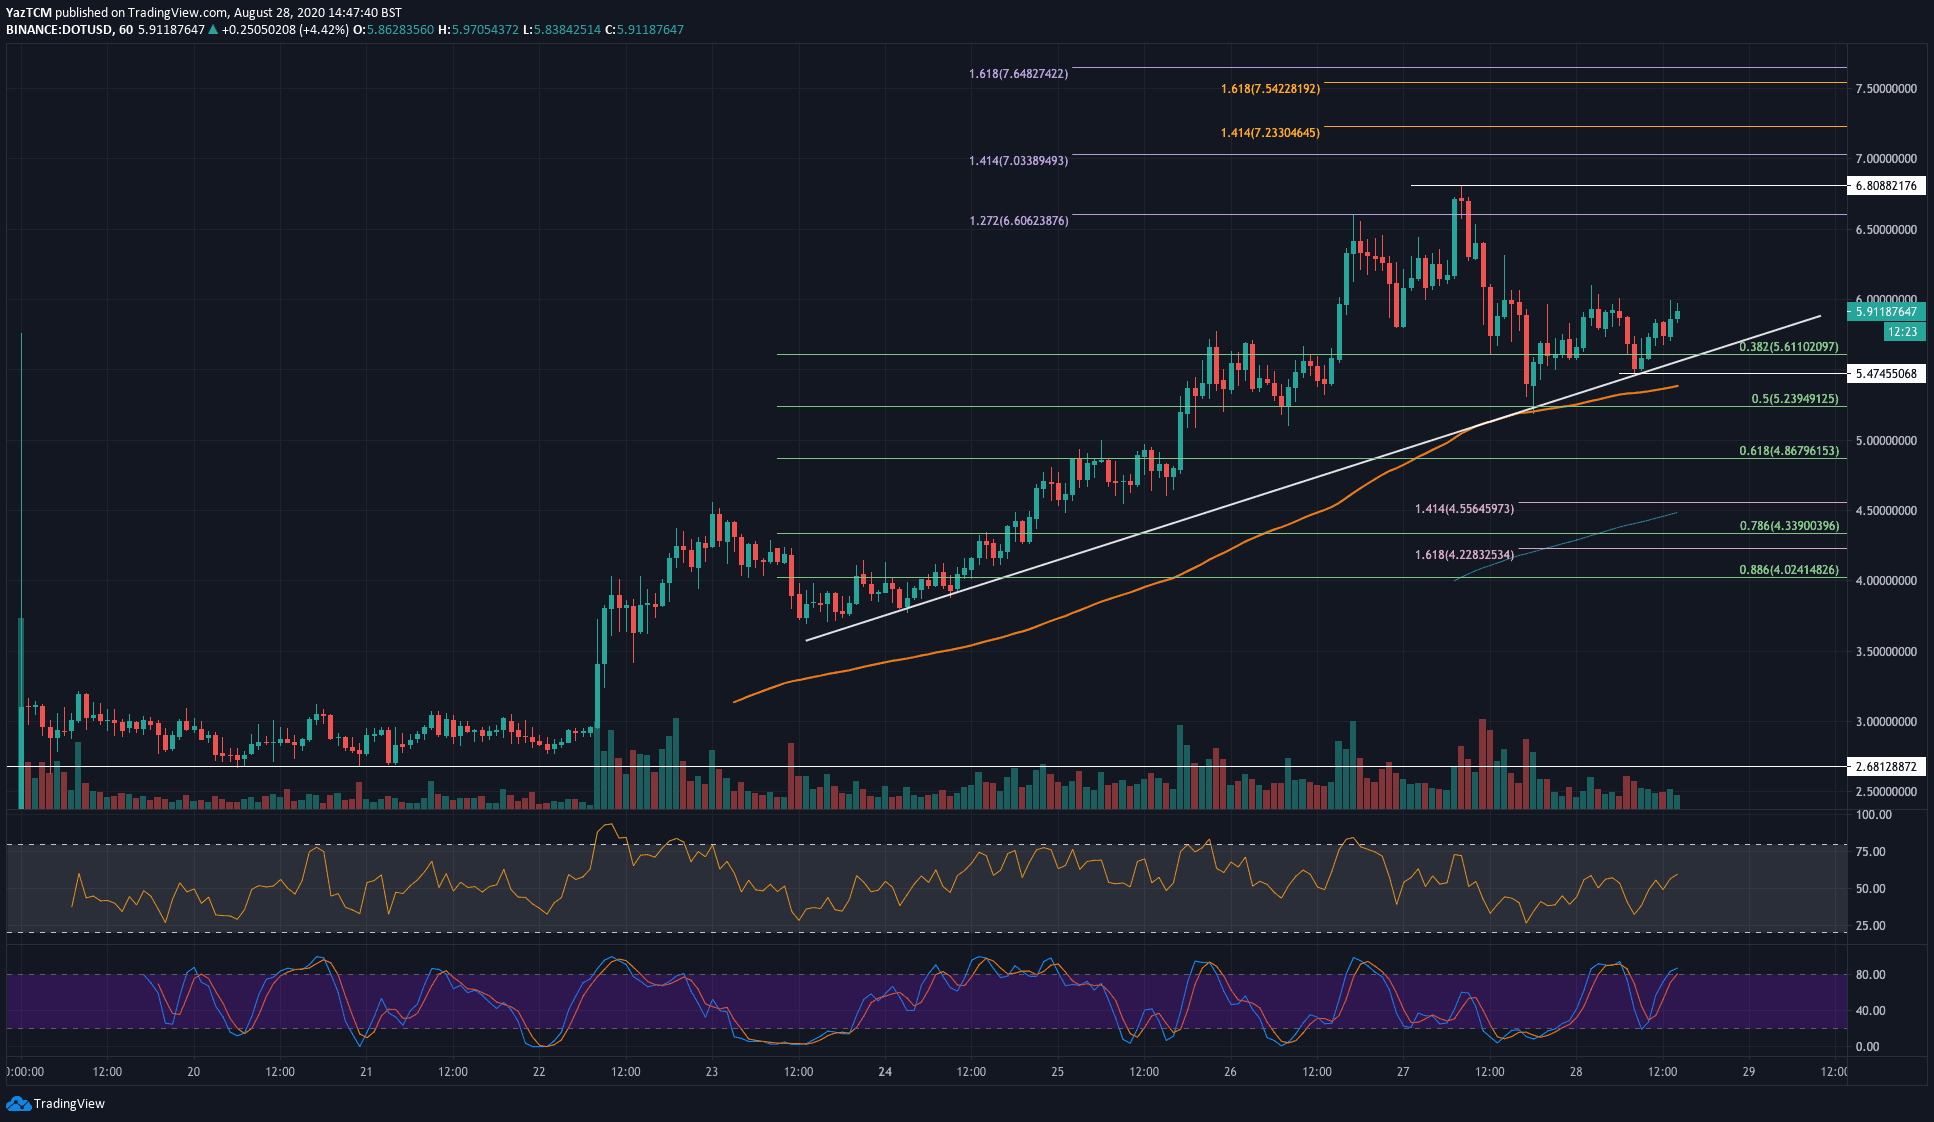
Polkadot just started coming onto exchanges earlier this week and has already managed to reach the top 5 ranked projects. The coin began trading on Binance at the $2.70 level as it started to push higher through the week.
It reached as high as $6.80 a couple of days ago and has since dropped into the .5 Fib support at $5.23. The support here was further bolstered by a rising trend line, which allowed DOT to rebound to the current $5.91 level.
Looking ahead, if the bulls can break the $6.00 level, resistance is located at $6.60, $6.90, and $7.00 (1.414 Fib Extension). Added resistance lies at $7.23, $7.54, and $7.64.
On the other side, support is first found at $5.60 (.382 Fib Retracement & and rising trend line). Beneath this, support lies at $5.24 (.5 Fib Retracement), $4.86 (.618 Fib Retracement), and $4.55.
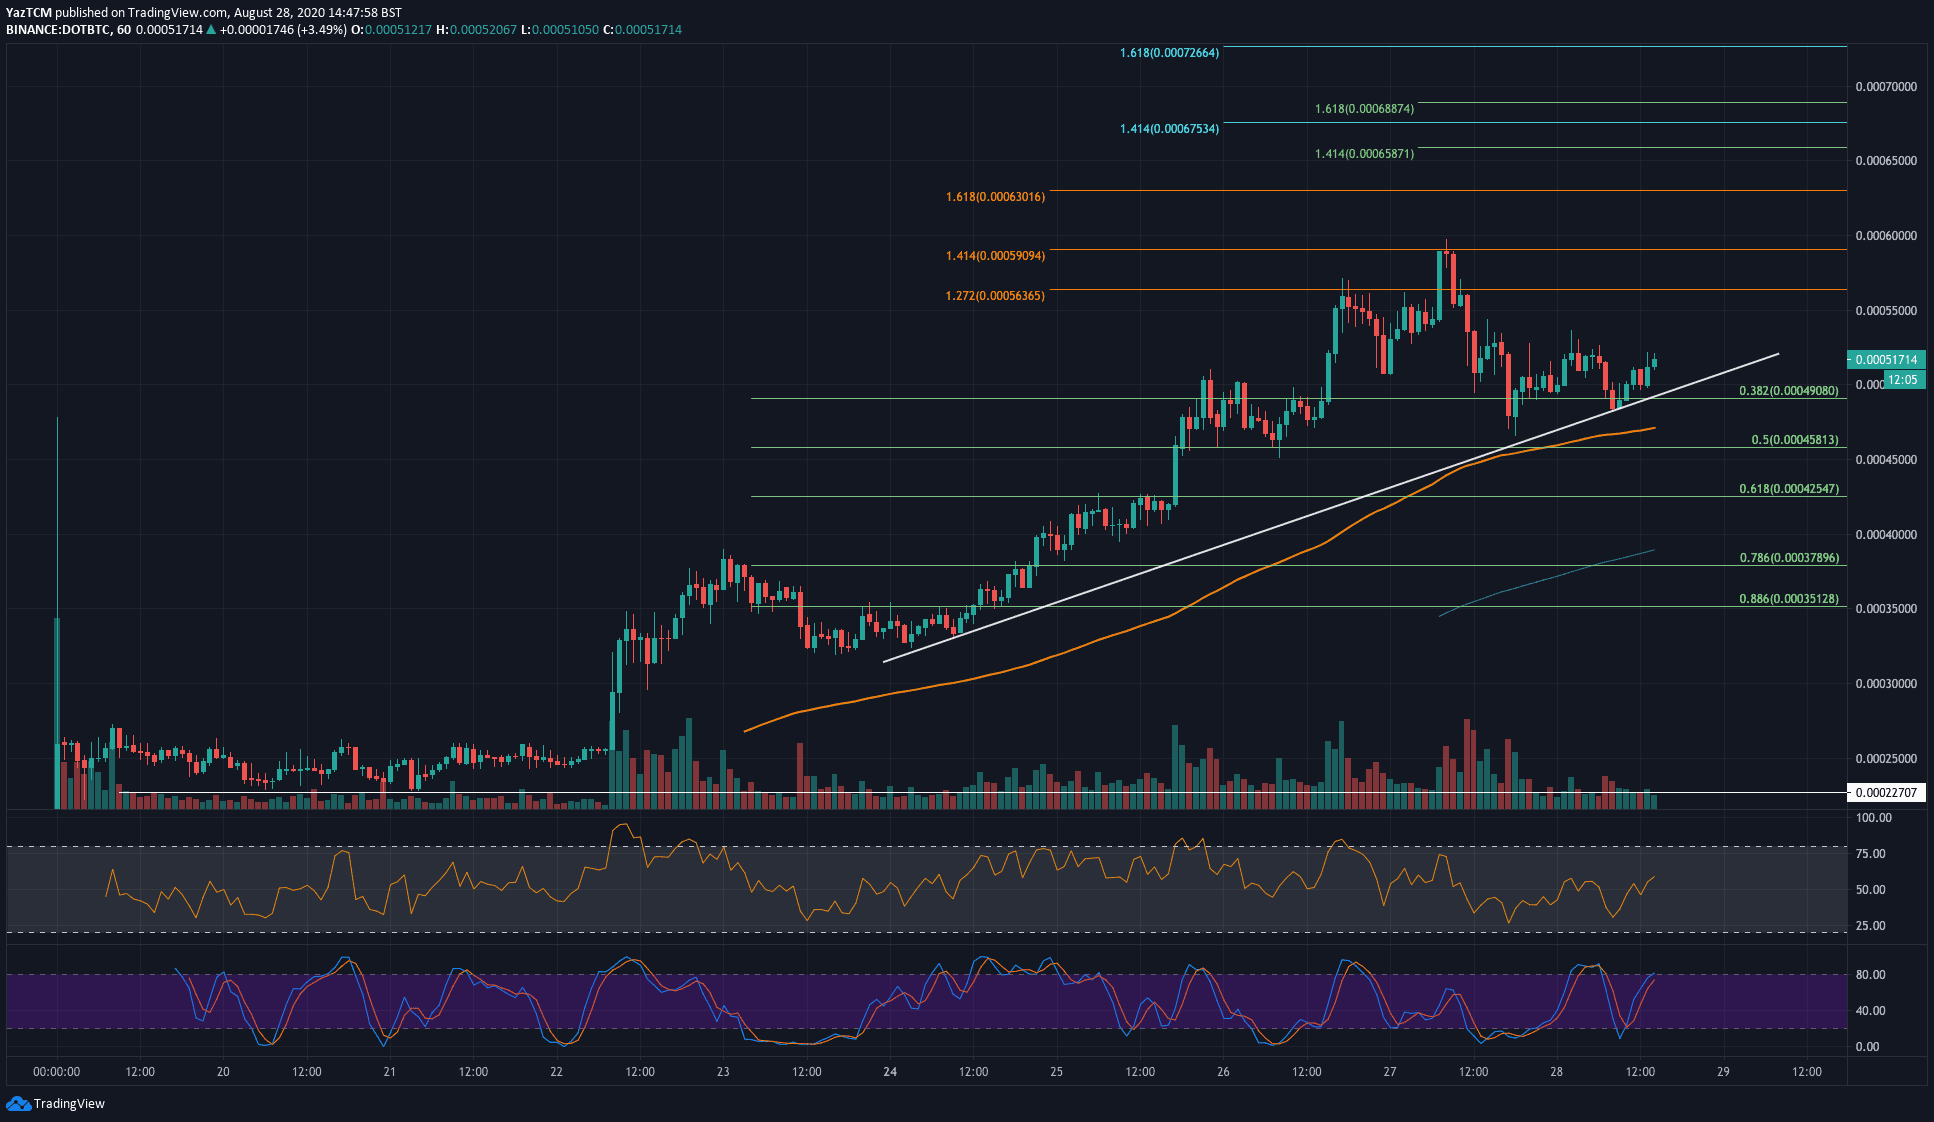
Against Bitcoin, DOT is following a similar trading pattern. It reached the 59,000 SAT (1.414 Fib Extension) high earlier in the week and started to head lower from there until it found support at the rising trend line and rebounded.
If the bulls can break the current 53,000 SAT level, resistance is expected at 56,400 SAT (1.272 Fib Extension), 59,000 SAT (1.414 Fib Extension), and 63,000 SAT (1.618 Fib extension).
On the other side, support first lies at the rising trend line. Beneath this, added support is found at 49,000 SAT, 45,800 SAT (.5 Fib Retracement), and 43,500 SAT (.618 Fib Retracement).