BitcoinBitcoin saw an impressive 11.5% price surge over the past 7 days of trading as the cryptocurrency manages to reach as high as ,000 again. During the week, the coin managed to break above the previous resistance at ,000 and continued above further resistance at ,426 and ,815 to reach the ,000 level.Looking ahead, if the buyers break above ,000, resistance is located at ,226 (1.618 Fib Extension) and ,430 (2020 high). Above this, resistance is located at ,810, ,000, and ,276.On the other side, if the sellers push lower, the first level of support lies at ,815. Beneath this, support is expected at ,500, ,426, ,150, and ,000. Beneath ,000, added support could be found at ,870 and ,500.BTC/USD. Source: TradingViewEthereumEthereum saw a pretty
Topics:
Yaz Sheikh considers the following as important: BTC Analysis, btcusd, ETH Analysis, ETHBTC, ethusd, Market Updates, Price Analysis, TRXBTC, TRXUSD, XMRBTC, XMRUSD, XRP Analysis, xrpbtc, xrpusd
This could be interesting, too:
Chayanika Deka writes Why Arthur Hayes Is Bullish on Bitcoin Under Trump’s Economic Strategy
Mandy Williams writes Why the Bitcoin Market Is Stuck—and the Key Metric That Could Change It: CryptoQuant CEO
Wayne Jones writes Metaplanet Acquires 156 BTC, Bringing Total Holdings to 2,391
Jordan Lyanchev writes Liquidations Top 0M as Bitcoin Falls K, Reversing Trump-Driven Rally
Bitcoin
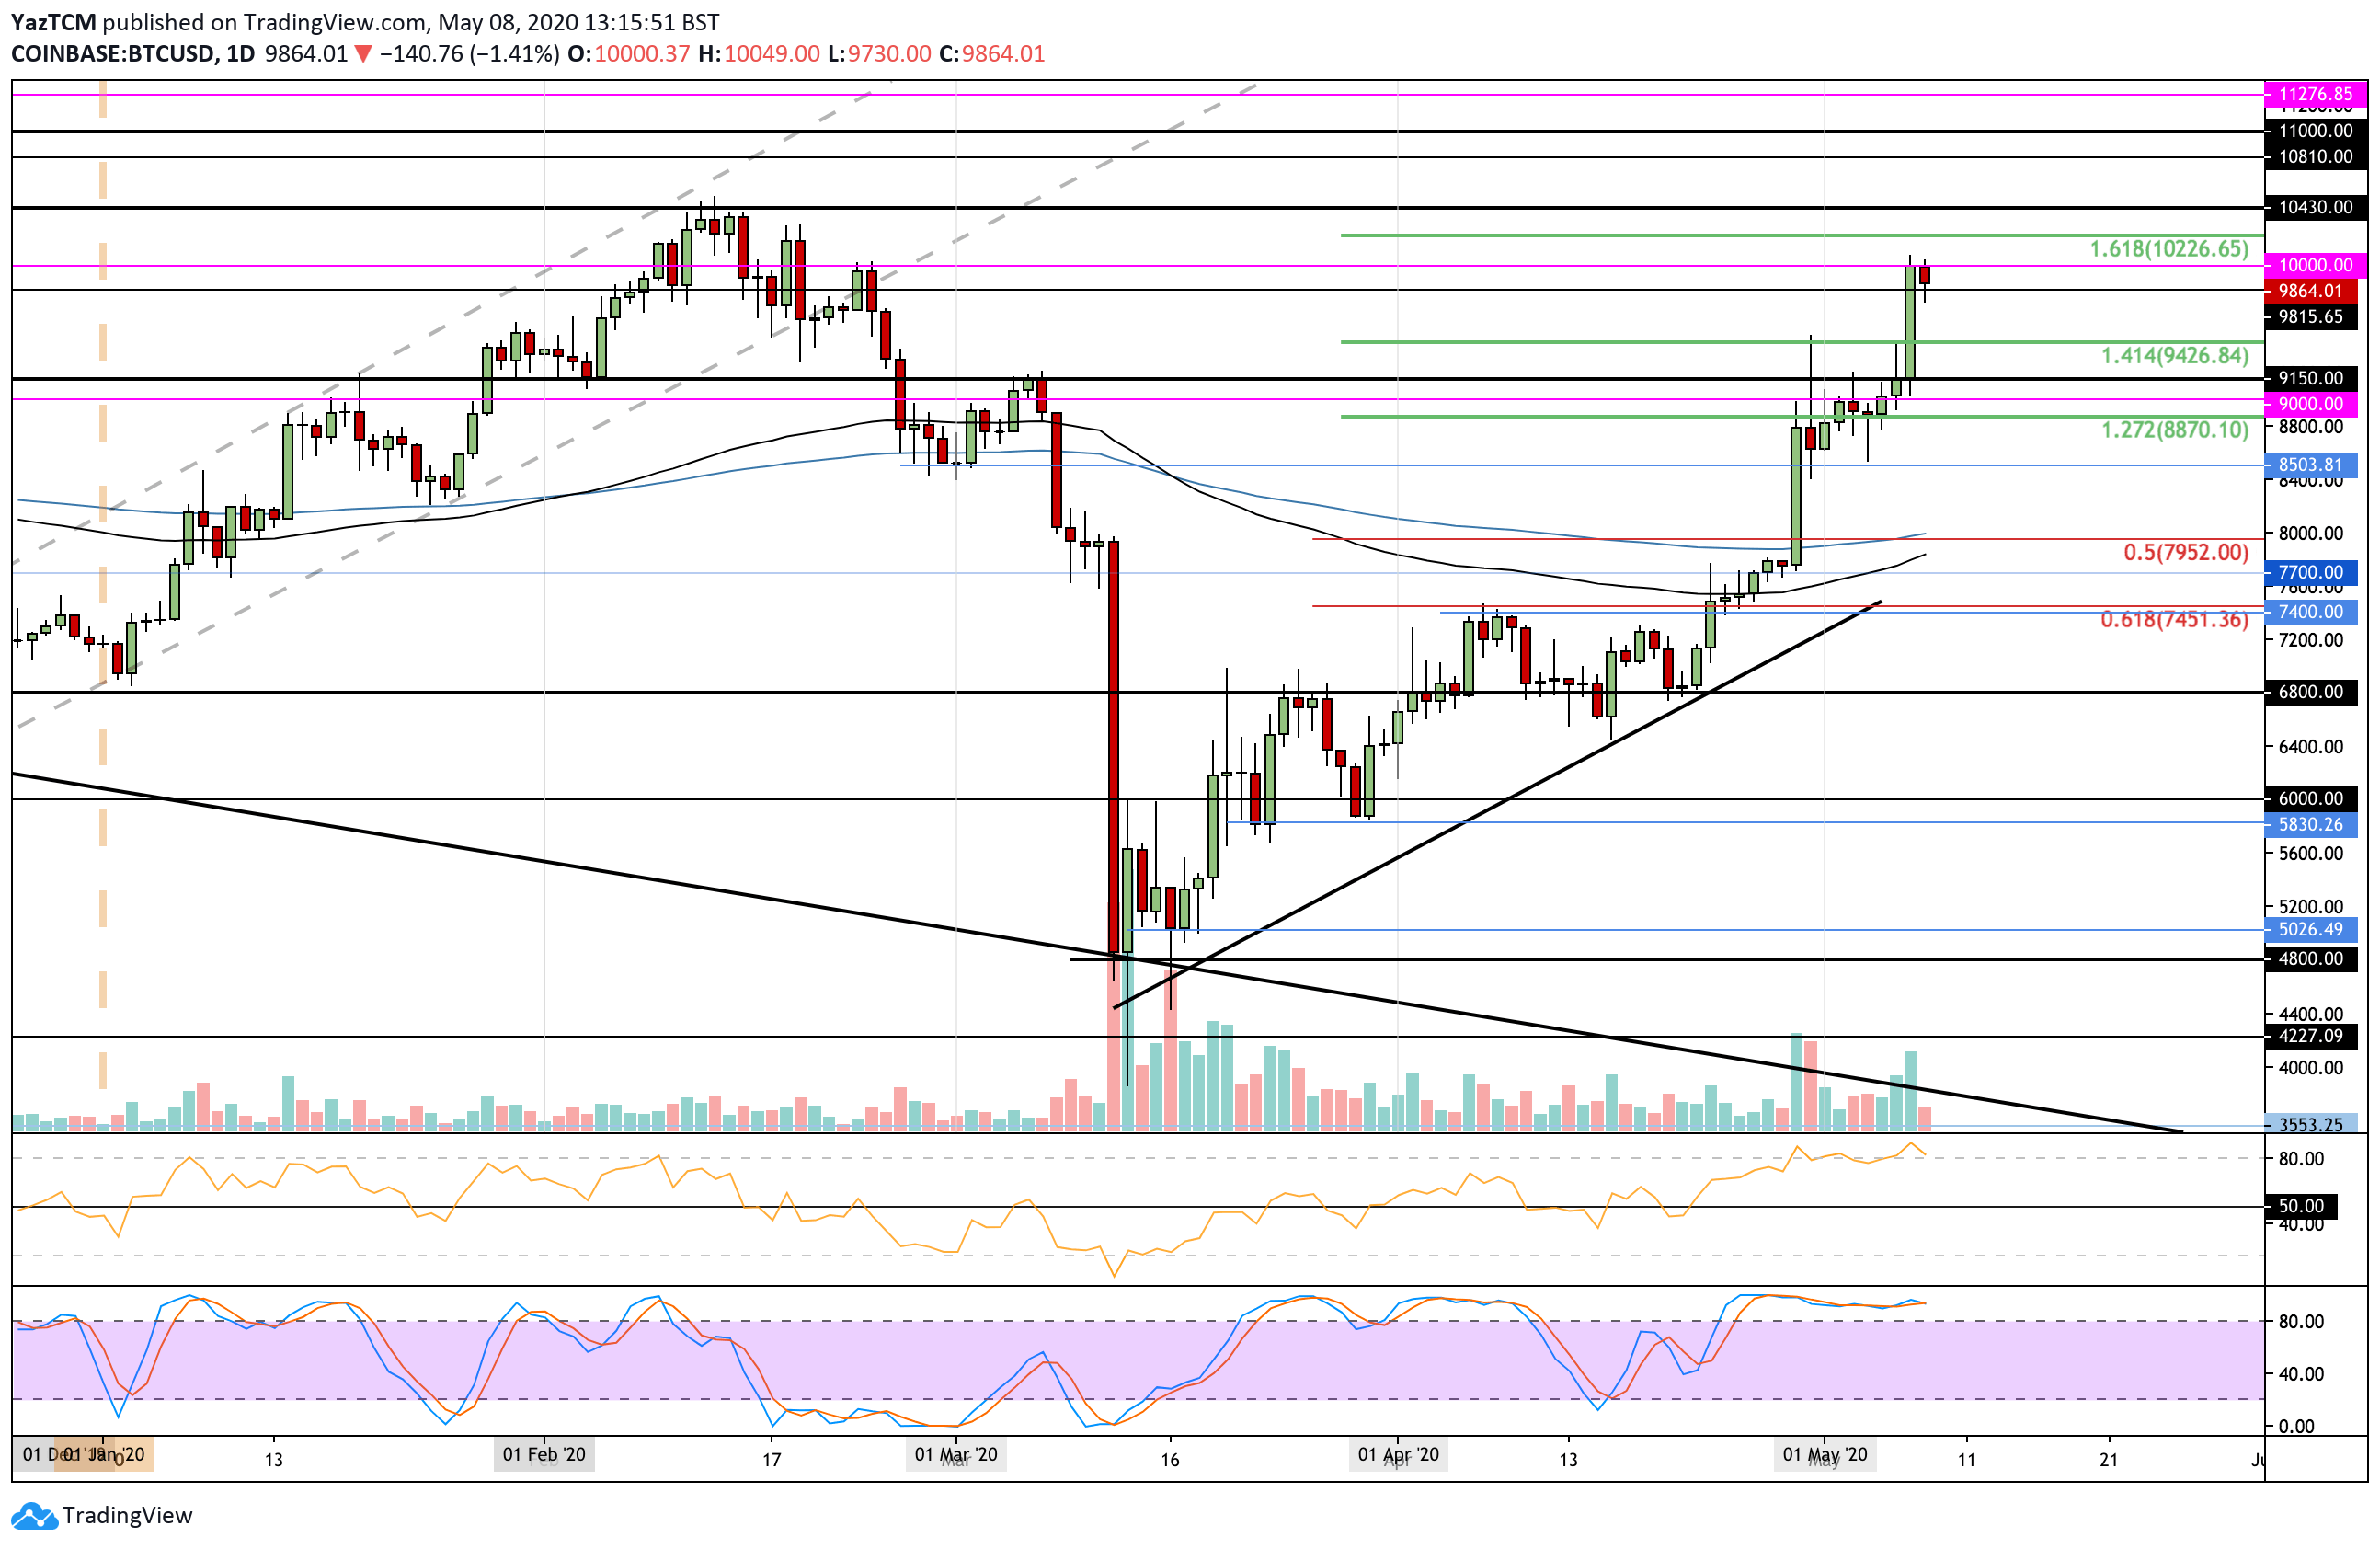
Bitcoin saw an impressive 11.5% price surge over the past 7 days of trading as the cryptocurrency manages to reach as high as $10,000 again. During the week, the coin managed to break above the previous resistance at $9,000 and continued above further resistance at $9,426 and $9,815 to reach the $10,000 level.
Looking ahead, if the buyers break above $10,000, resistance is located at $10,226 (1.618 Fib Extension) and $10,430 (2020 high). Above this, resistance is located at $10,810, $11,000, and $11,276.
On the other side, if the sellers push lower, the first level of support lies at $9,815. Beneath this, support is expected at $9,500, $9,426, $9,150, and $9,000. Beneath $9,000, added support could be found at $8,870 and $8,500.
Ethereum
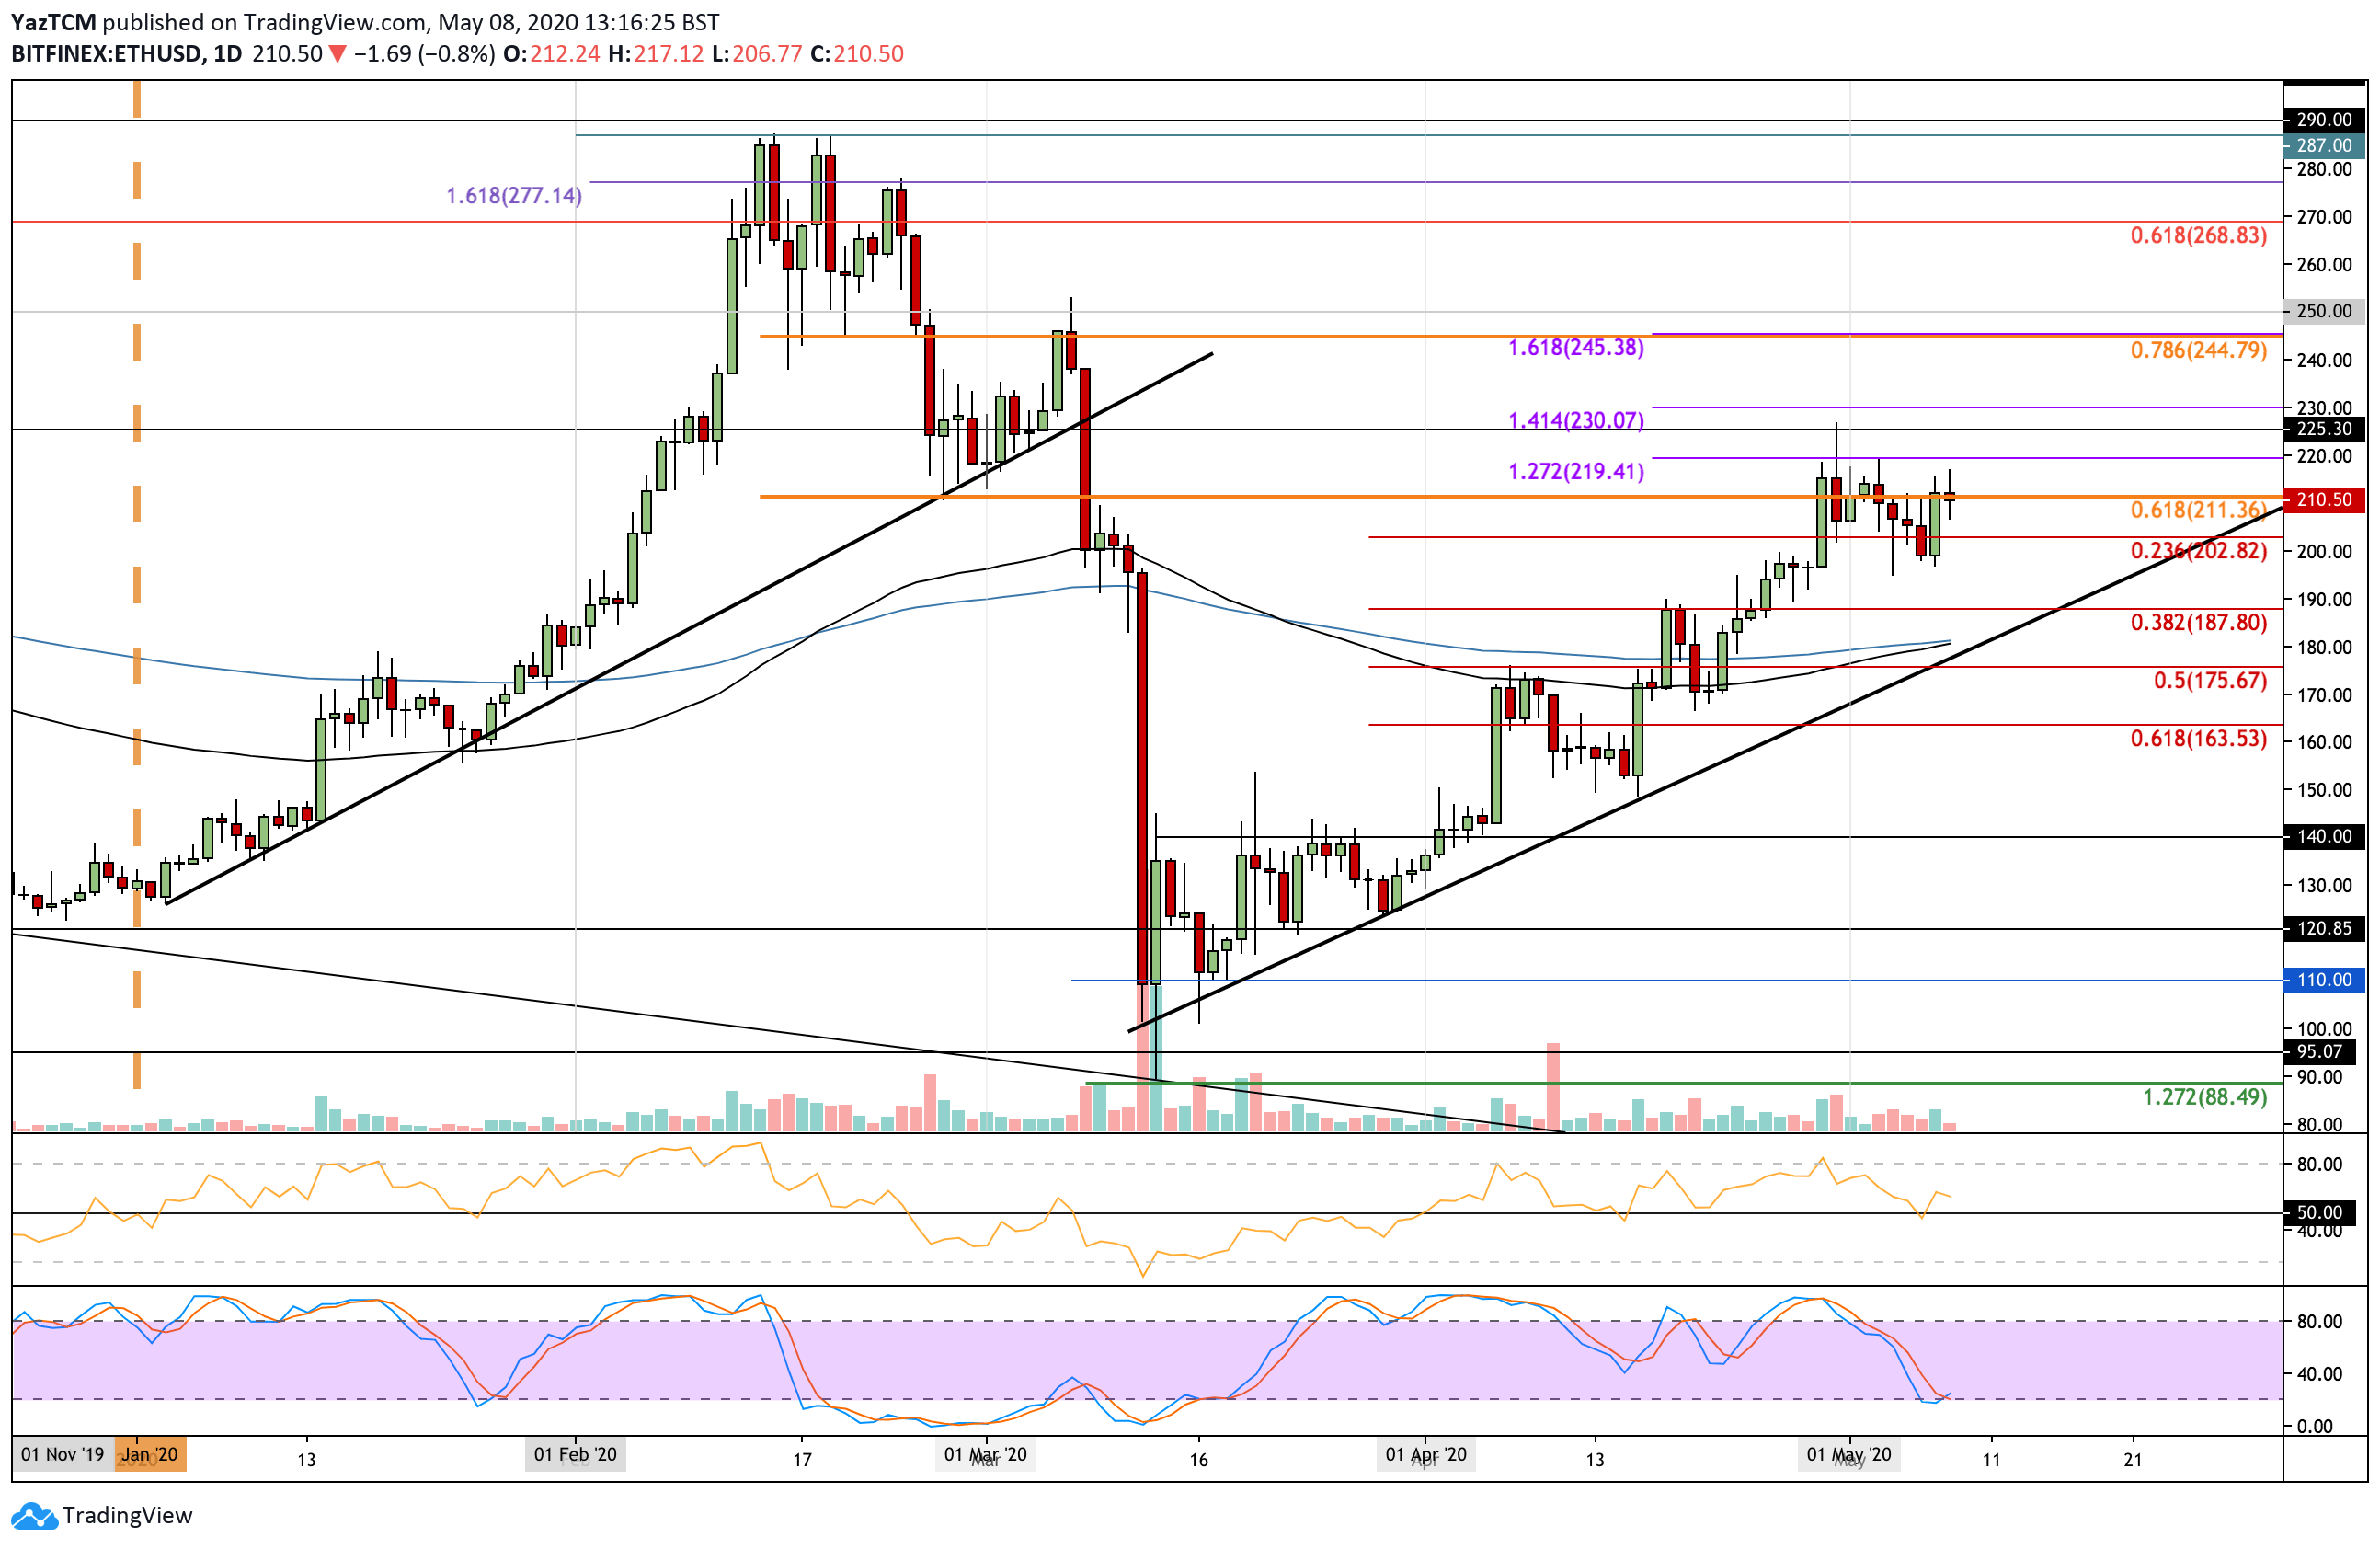
Ethereum saw a pretty stagnant week as the cryptocurrency dropped by a small 1%. The coin had previously been trapped by resistance at $220, which caused it to roll over and head lower. During the week, ETH spiked as low as $194 but quickly recovered from here. The lowest closing price was around $200, and ETH rebounded from here to reach the current $210.50 level.
If the buyers break $211, the first level of strong resistance lies at $220 (1.272 Fib Extension). Above this, resistance is located at $225, $230 (1.414 Fib Extension), and $245 (bearish .786 Fib Retracement).
On the other side, the first levels of support lie at $202 and $200. Beneath this, support is located at $194, $189 (.382 Fib Retracement), and $180 (200-days EMA).
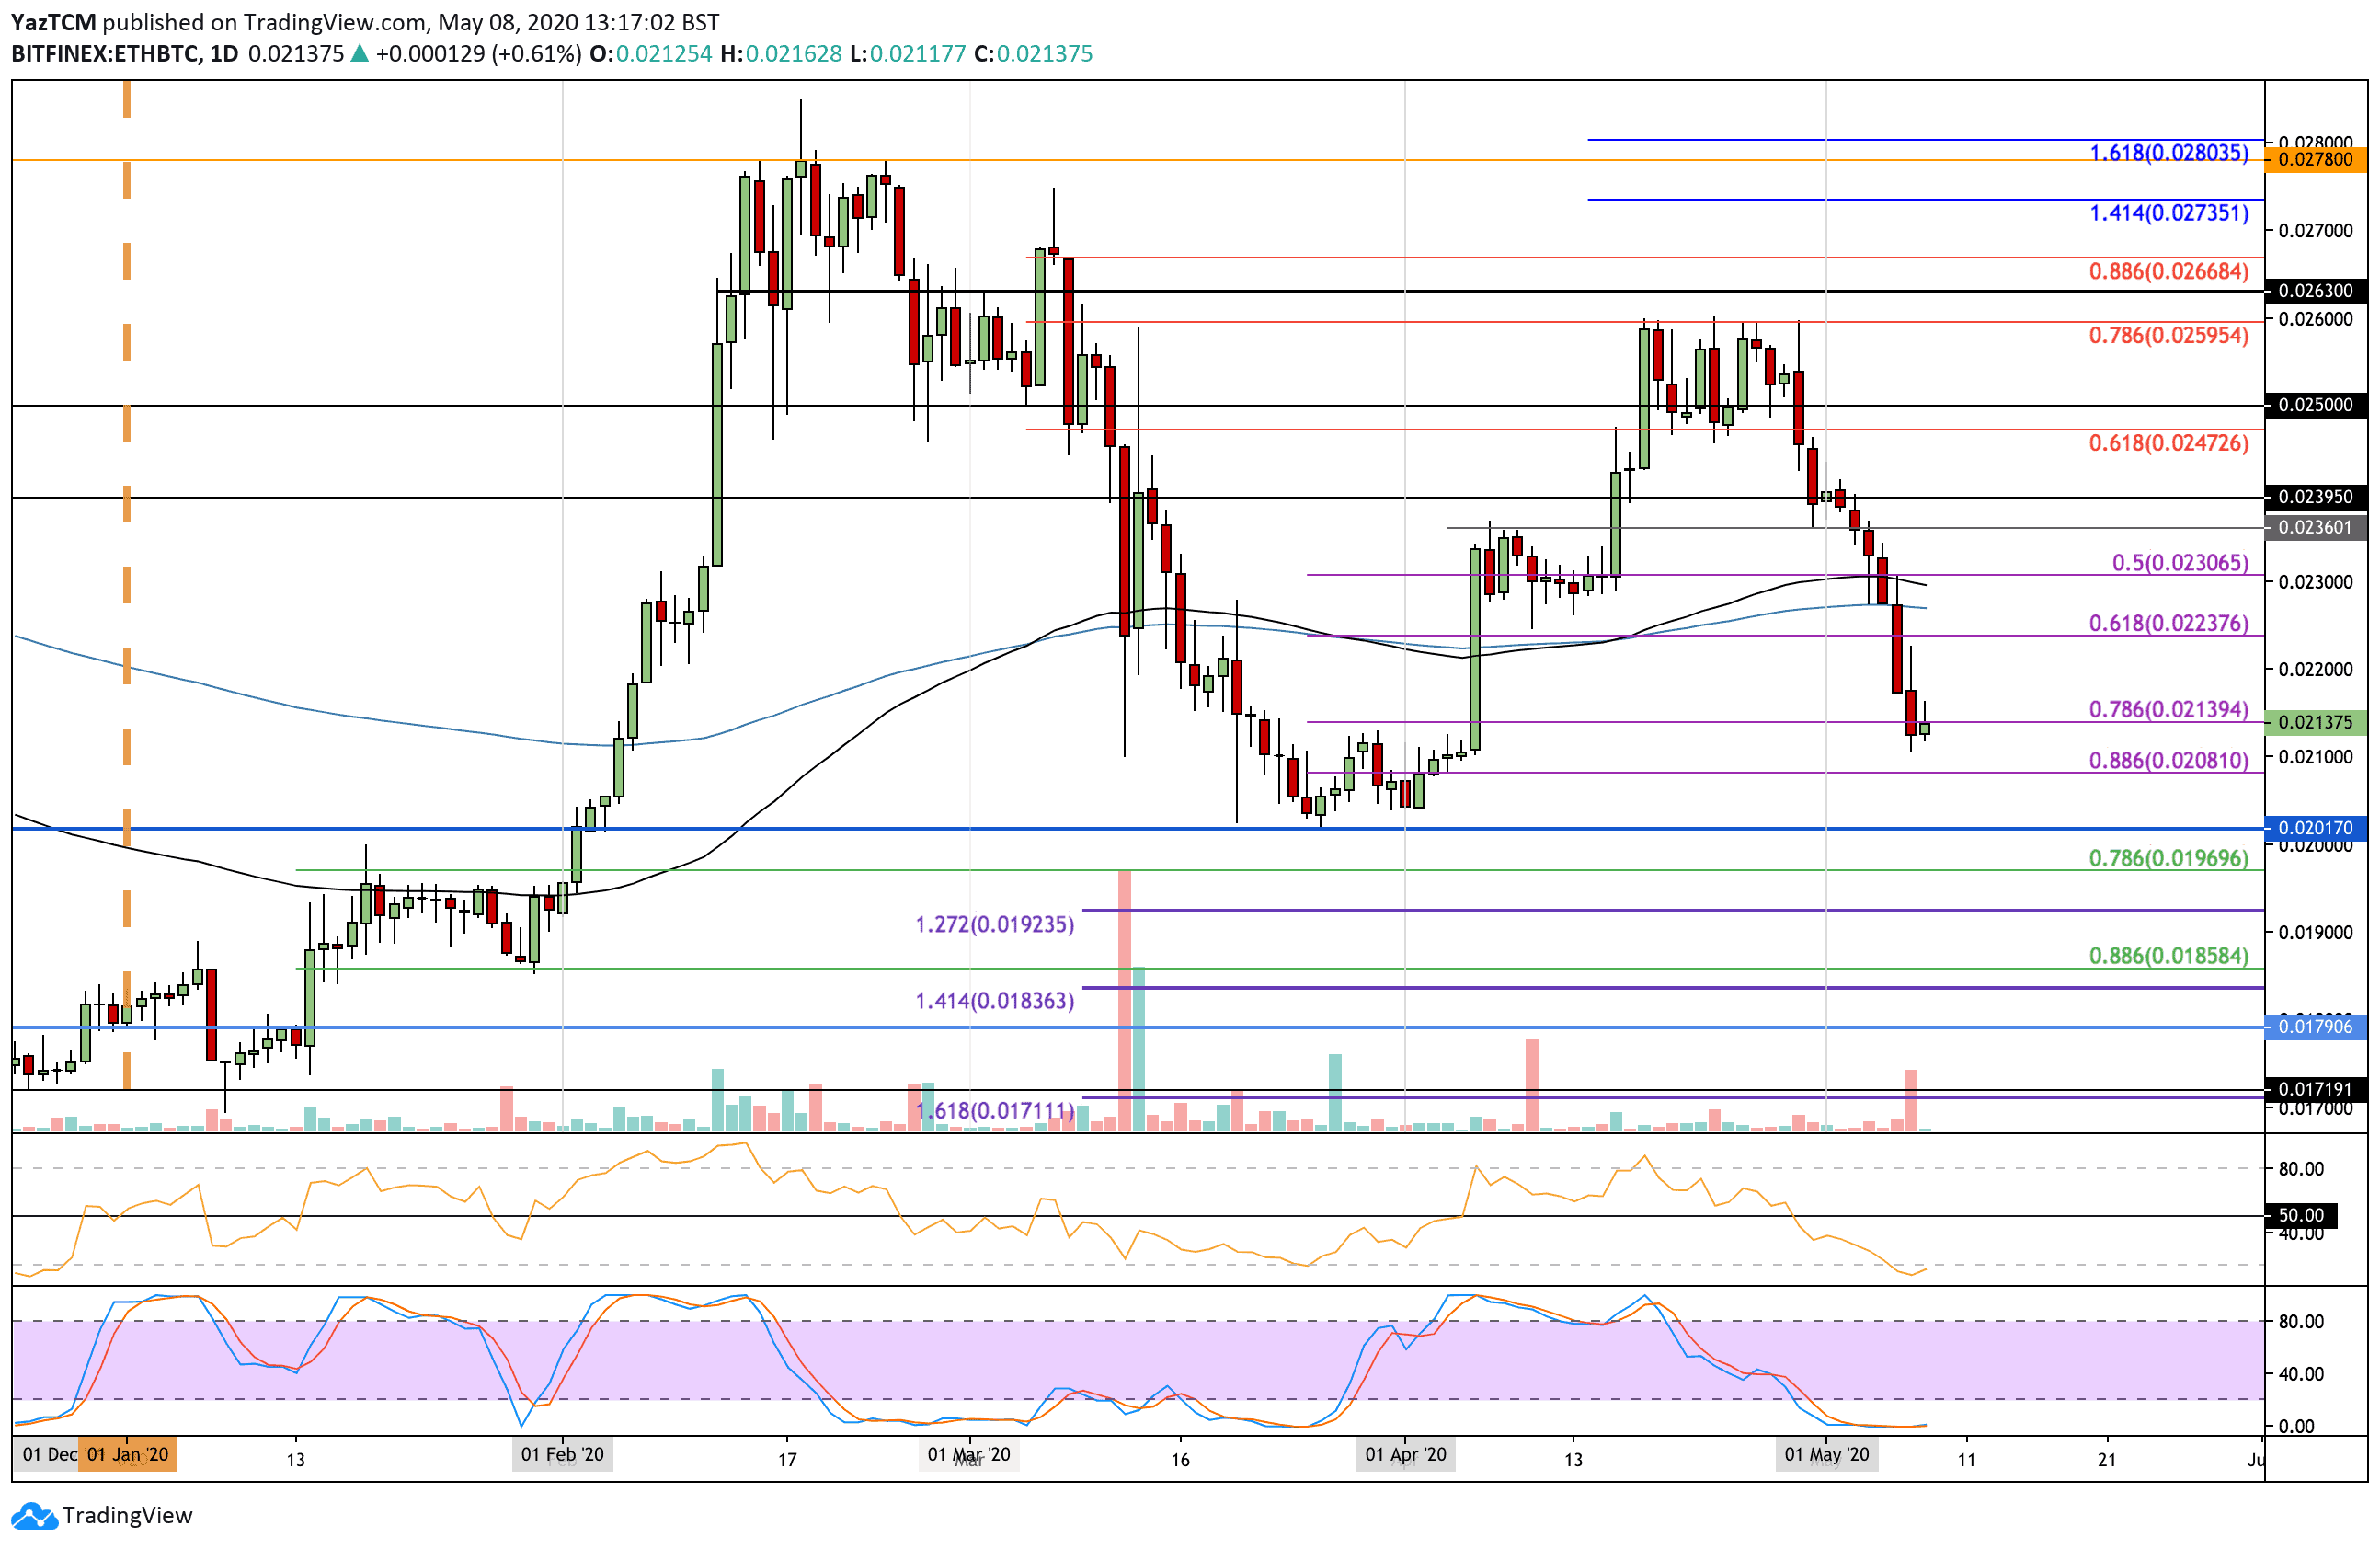
Against Bitcoin, ETH broke beneath the previous support at 0.0239 BTC and started to plummet. It went on to break beneath the 100-days EMA at 0.023 BTC and the 200-days EMA at 0.0225 BTC and continued further lower from here. It penetrated beneath the 0.022 BTC level to reach the current support at 0.0210 BTC.
Looking ahead, if the sellers continue to drive ETH lower, support is found at 0.021 BTC, 0.0208 BTC (.886 Fib Retracement), and 0.020 BTC. Beneath this, added support lies at 0.0196 BTC and 0.0192 BTC.
On the other side, if the buyers regroup and push higher, resistance is expected at 0.022 BTC. Above this, added resistance lies at 0.0227 BTC (200-days EMA), 0.023 BTC (100-days EMA), and 0.0236 BTC.
Ripple
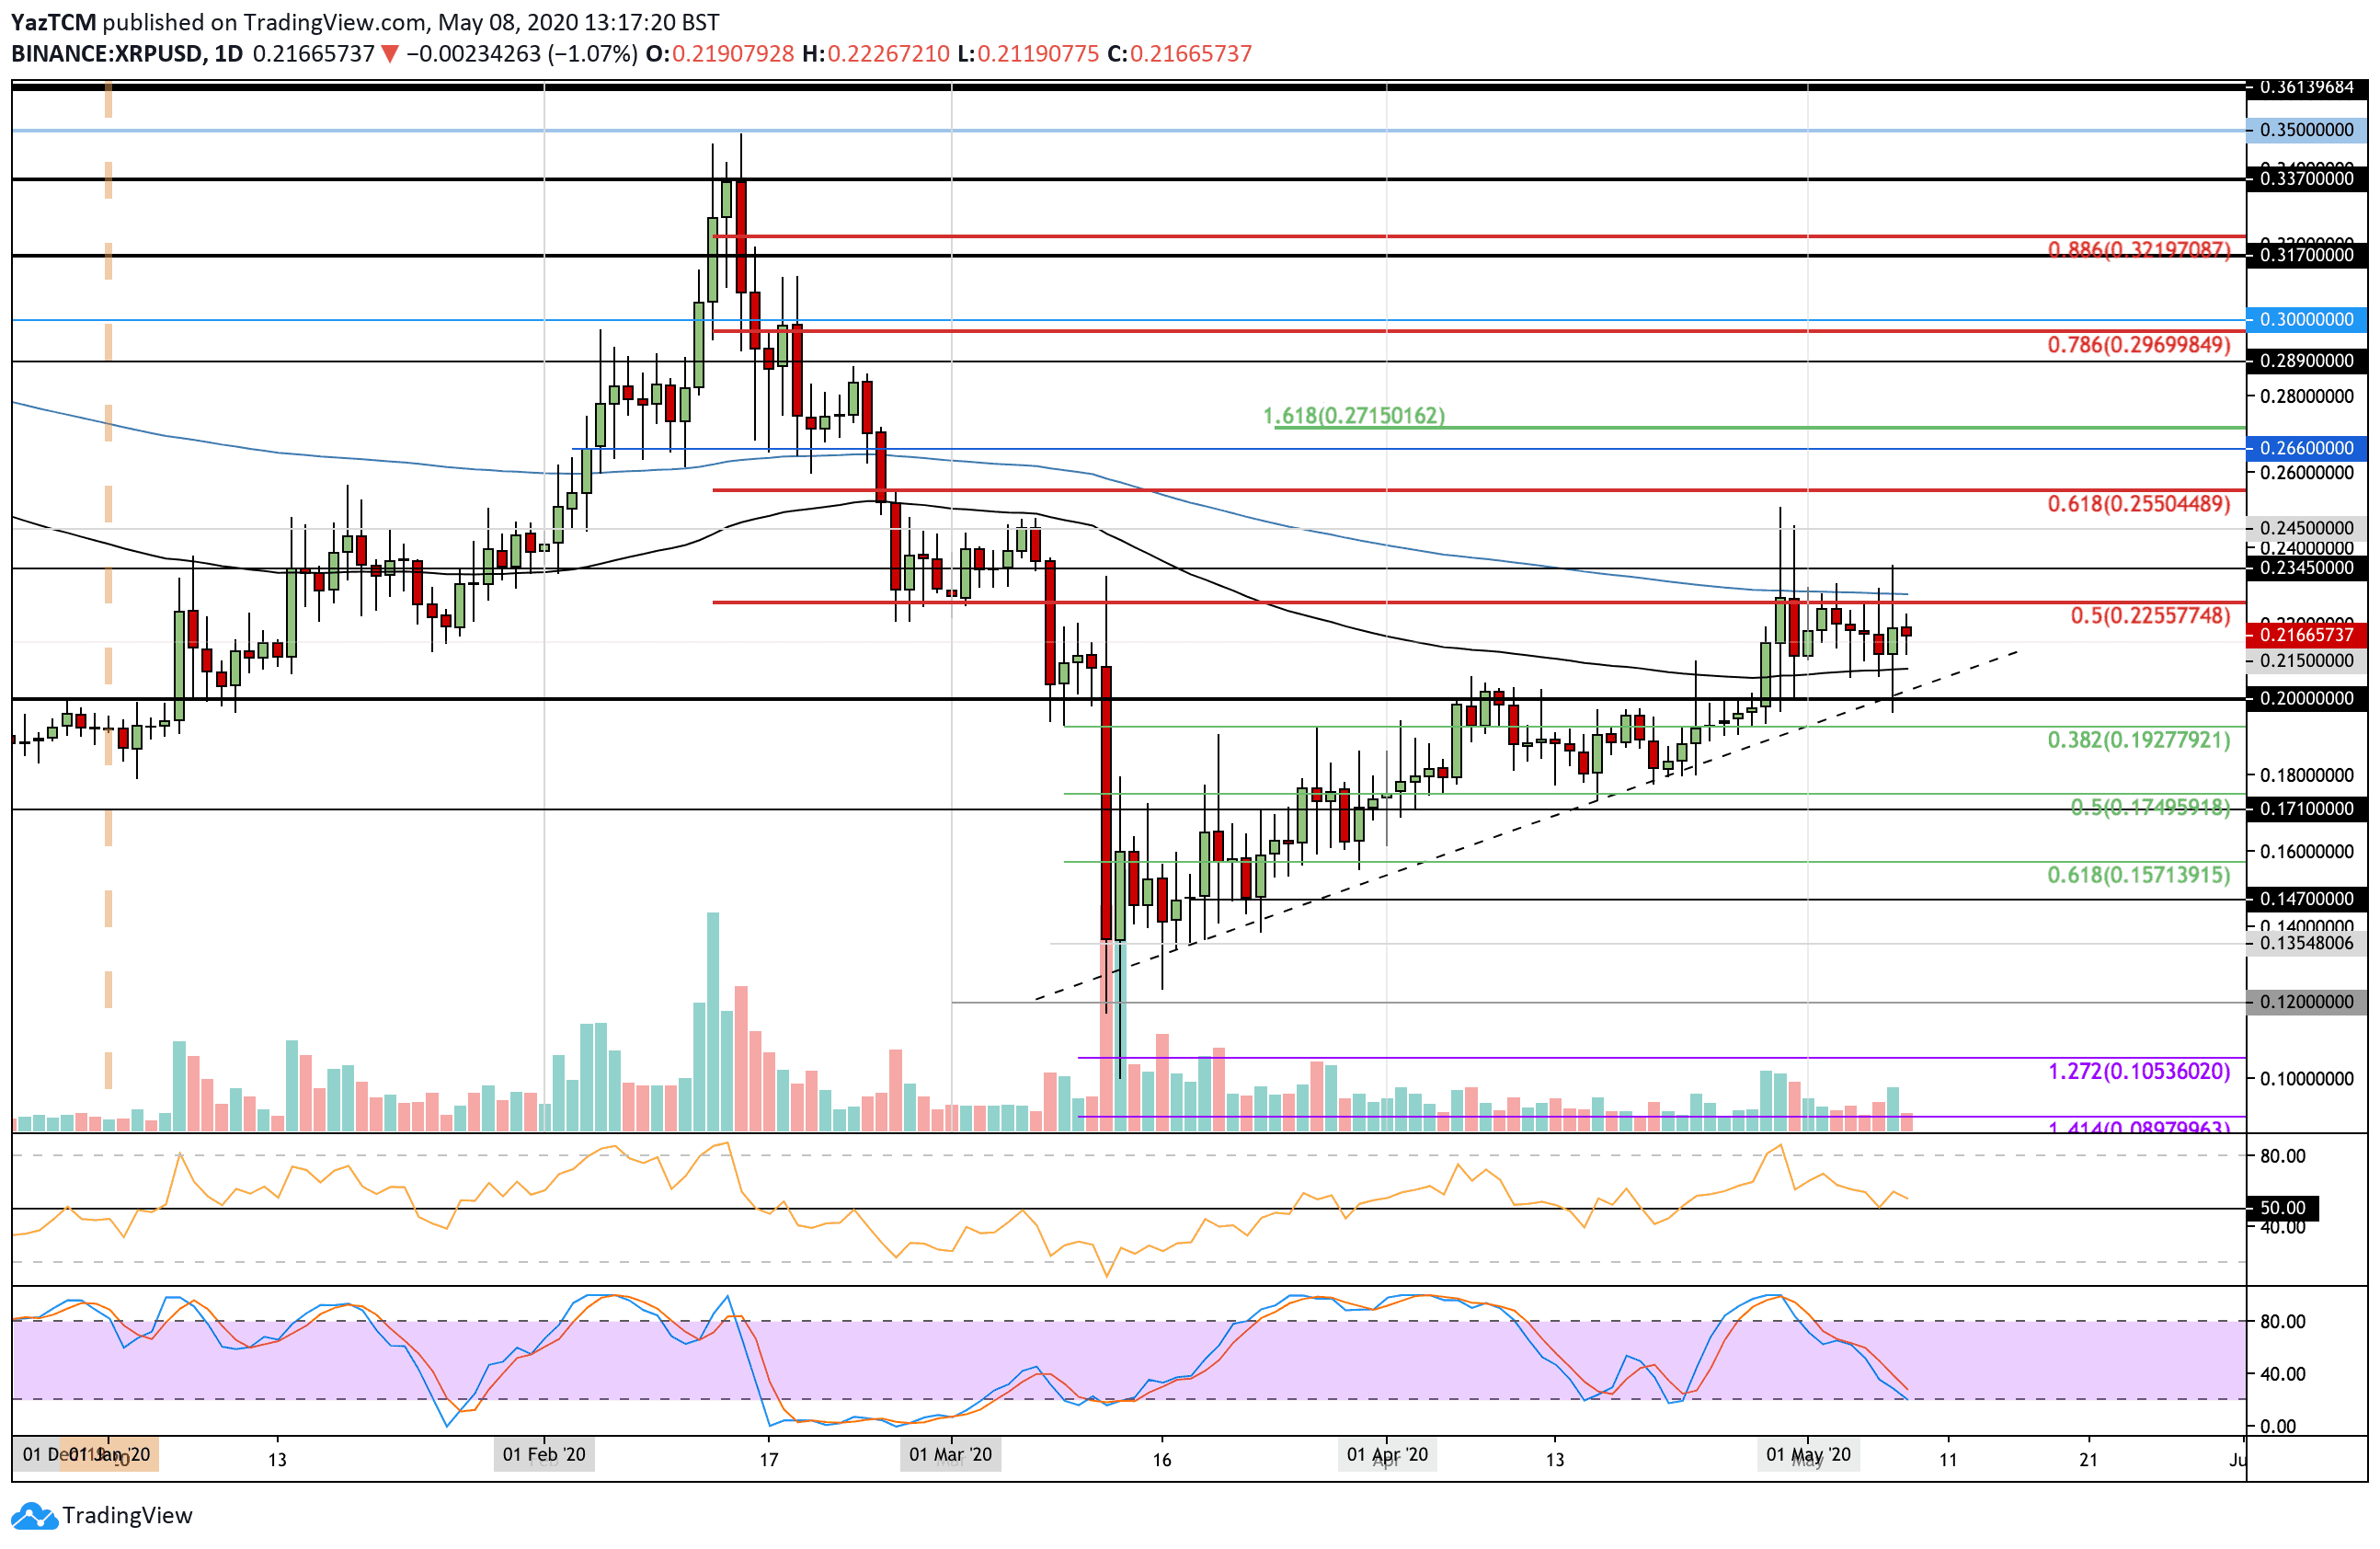
XRP also moved sideways this week after dropping by a marginal 1.3% to reach the current trading level at around $0.216. The cryptocurrency is actually trapped within a range between the 100-day EMA and the 200-day EMA and must break these boundaries to dictate the next direction for the market.
If the buyers push higher, the first level of resistance lies at $0.226 (200-days EMA). Above this, added resistance lies at $).235, $0.245, and $0.255 (bearish .618 Fib Retracement).
On the other side, if the sellers push lower, the first level of support lies at $0.207 (100-days EMA). This is followed by support at the rising trend line, $0.20, and $0.192 (.382 Fib Retracement). If the sellers continue, added support is located at $0.18 and $0.175 (.5 Fib Retracement).
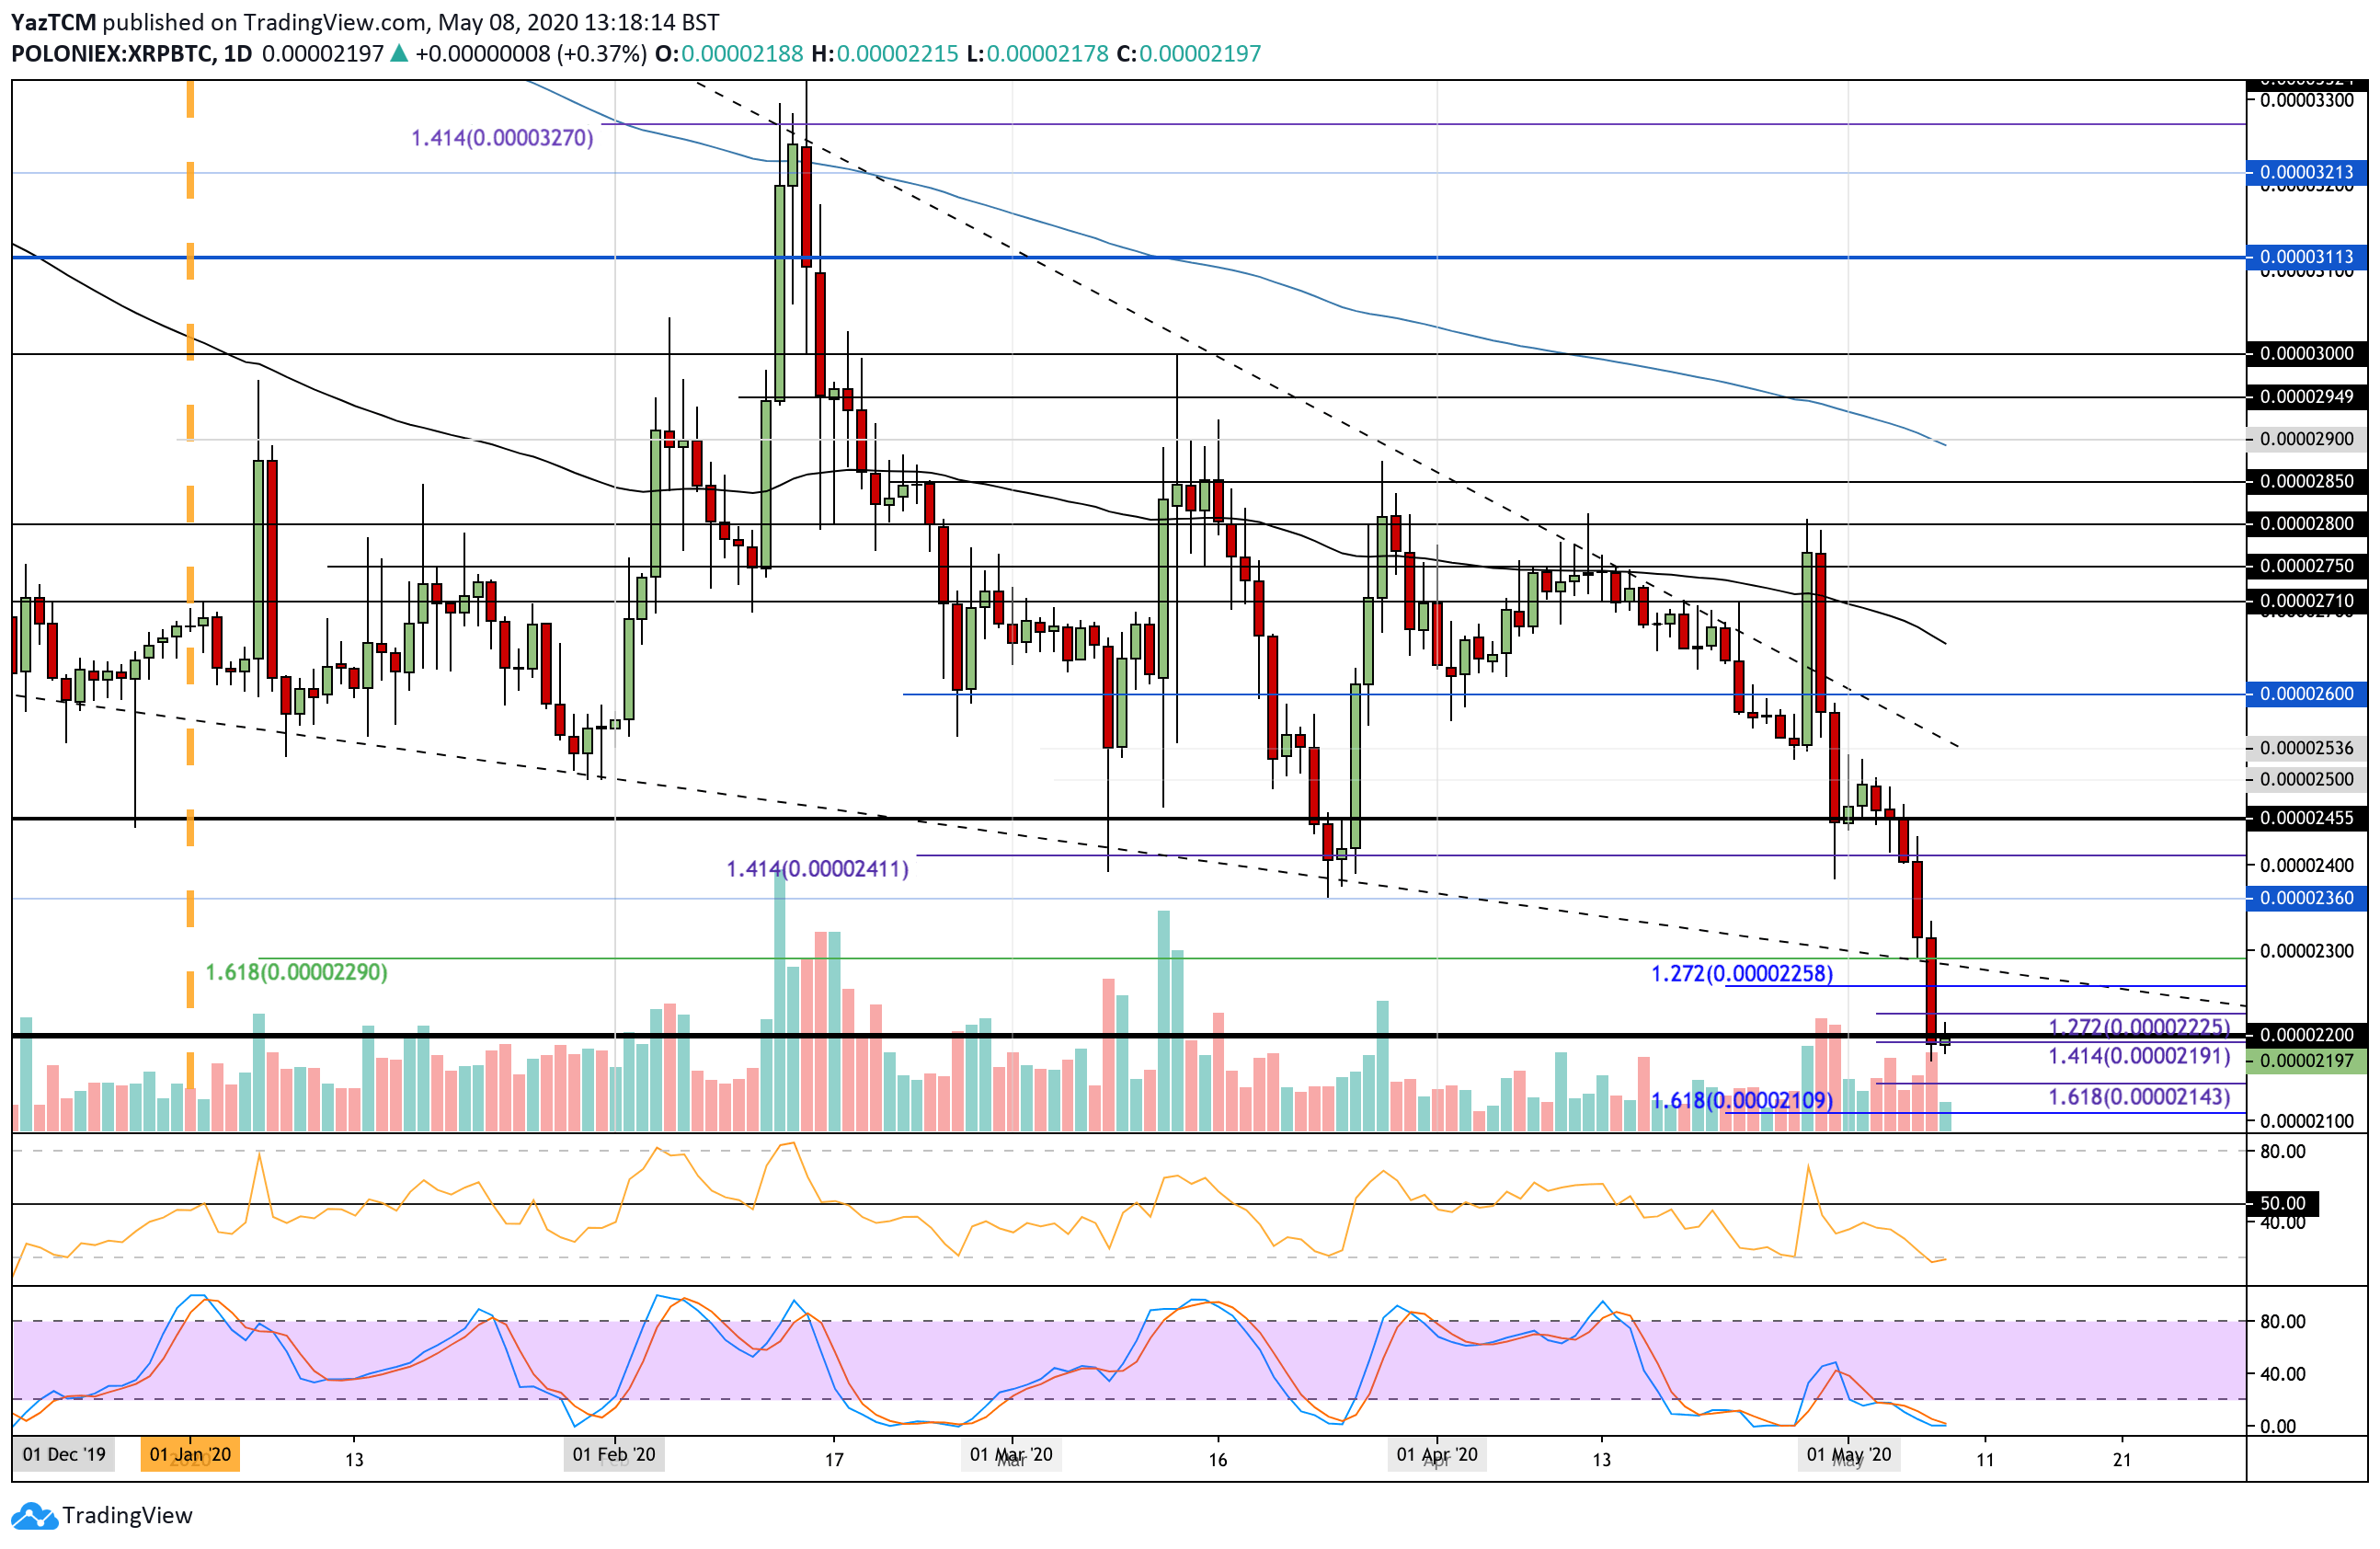
Against Bitcoin, XRP suffered a catastrophic this week as it penetrated beneath the 2020 low at 2360 SAT and continued further lower to break beneath 2200 SAT and reach a low that has not been seen since December 2017. It found support today at a short term downside 1.414 Fib Extension level at 2191 SAT.
If the sellers continue lower beneath the 2191 SAT level, support is located at 2143 SAT and 2109 SAT. This is followed by support at 2100 SAT and 2050 SAT.
On the other hand, if the buyers regroup and push higher, resistance is located at 2200 SAT, 2250 SAT, 2300 SAT, and 2360 SAT. This is followed by additional resistance at 2400 SAT and 2455 SAT.
Monero
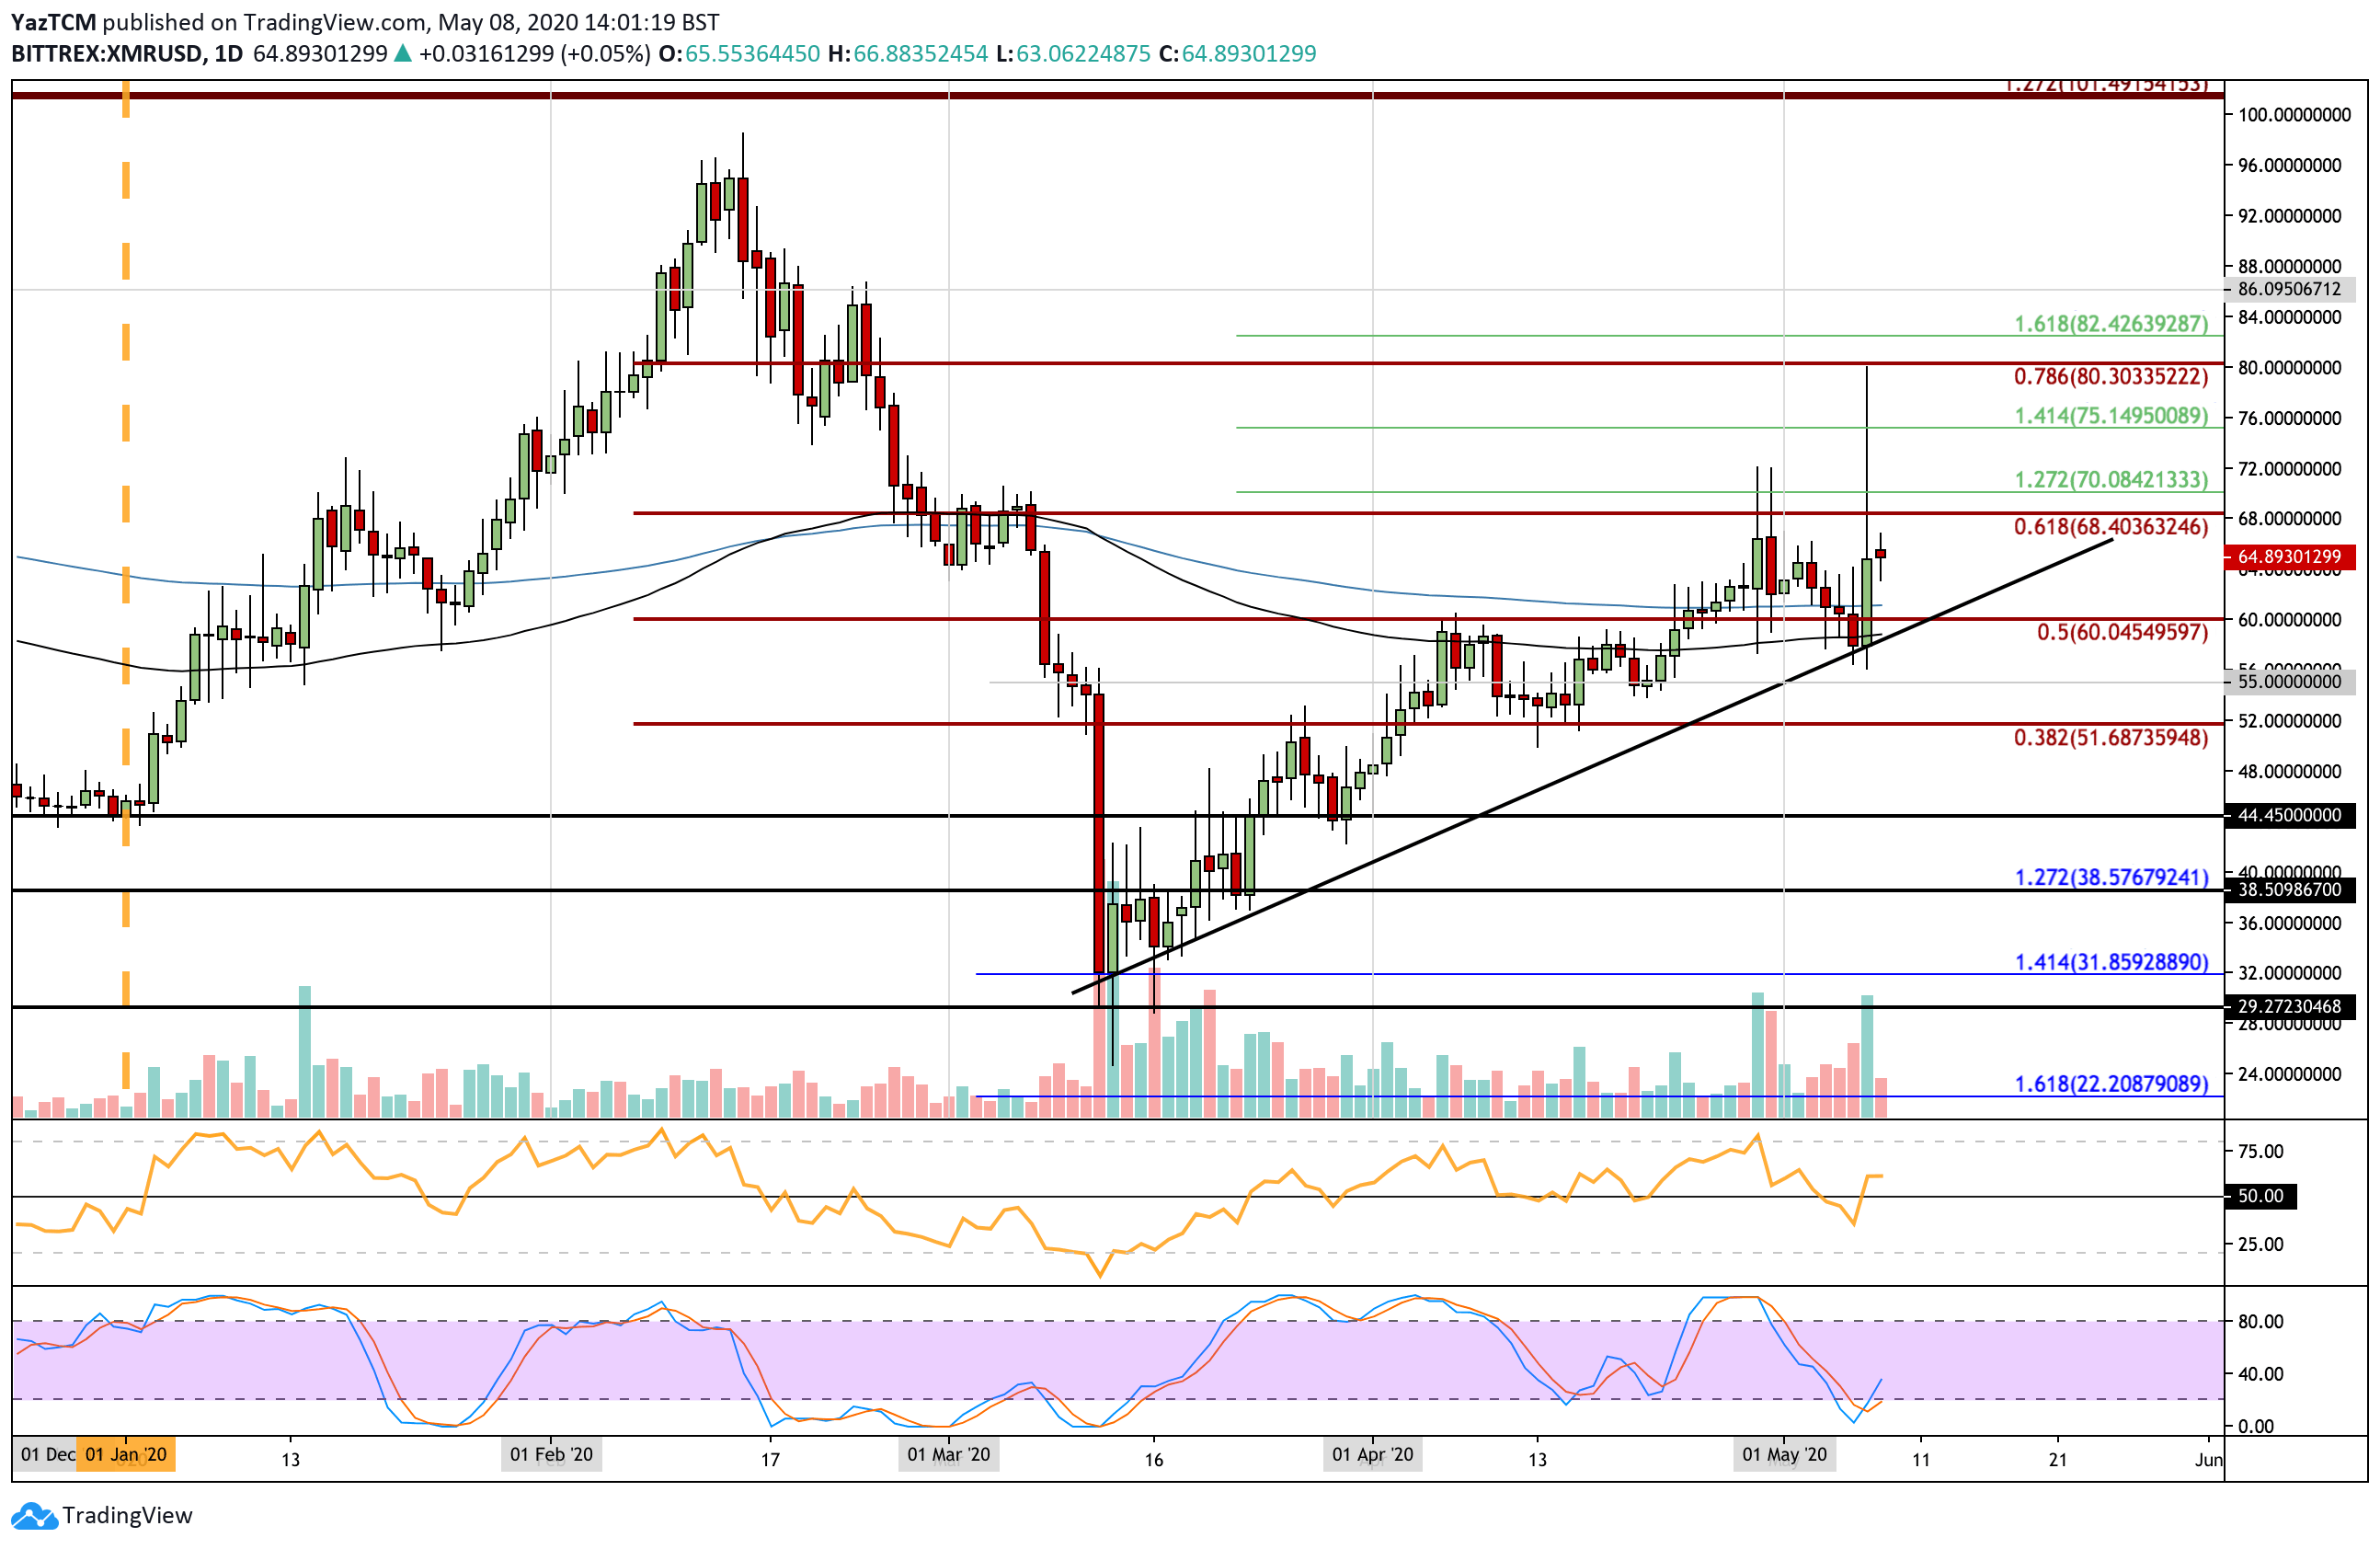
Monero saw an exciting week of trading as the cryptocurrency moved higher by a small 1%. However, during the week, XMR managed to rebound from a rising trend line and spike as high as $80.30, where it ran into resistance at the bearish .786 Fib Retracement. It has since dropped lower and is trading at $65.
Looking ahead, if the buyers push higher, the first level of resistance is located at $68.40 (bearish .618 Fib Retracement). Above this, resistance lies at $70, $75 (1.414 Fib Extension), $80 (bearish .786 Fib Retracement), and $86.
On the other side, if the sellers push lower, the first level of support lies at $61 (200-days EMA). Beneath this, support lies at $60, $58 (the rising trend line & 100-days EMA), and $55.
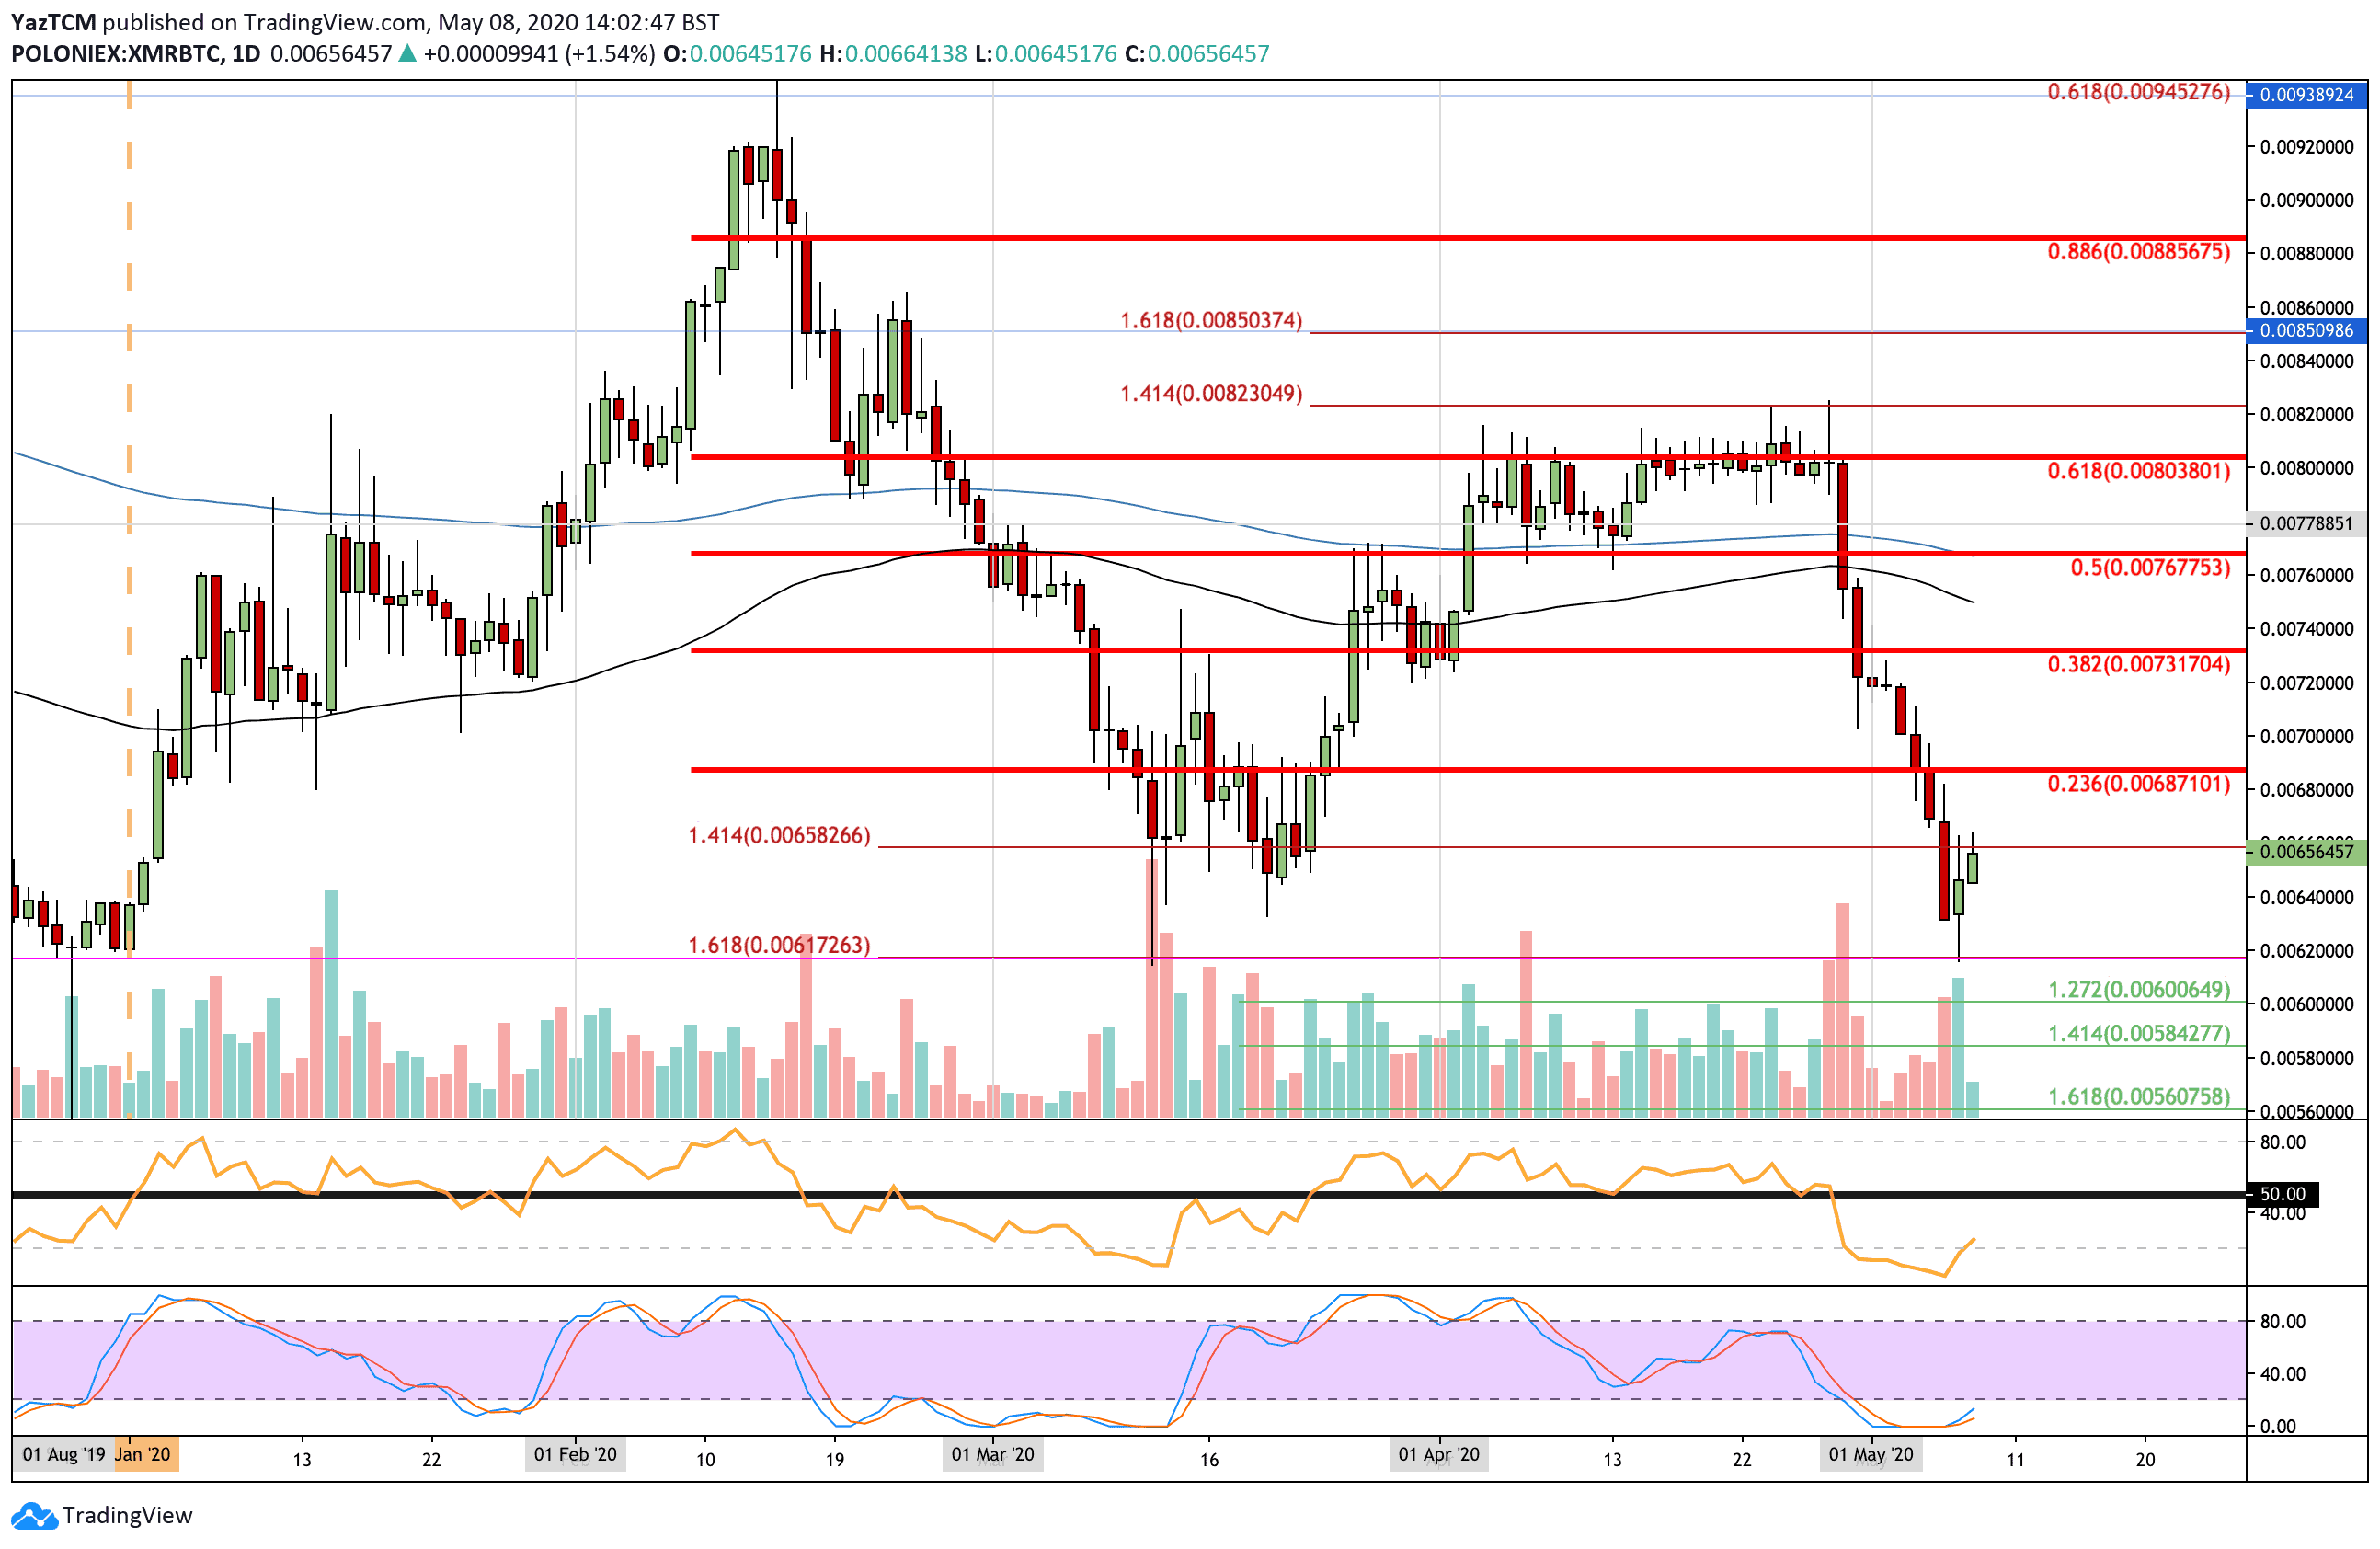
Against BTC, XMR was declining all week as it dropped beneath 0.00072 BTC and fell into the 2020 low at 0.00617 BTC. It managed to rebound higher from here as it currently trades at 0.0065 BTC.
If the buyers manage to push higher, the first level of strong resistance is located at 0.00687 BTC (Bearish .236 Fib Retracement). Above this, resistance lies at 0.007 BTC, 0.0073 BTC (bearish .382 Fib Retracement), 0.0075 BTC (100-days EMA), and 0.00767 BTC (200-days EMA).
On the other side, if the sellers push lower, the first level of support lies at 0.0064 BTC. Beneath this, support is located at 0.00617 BTC (2020 low), 0.0060 BTC (downside 1.272 Fib Extension), and 0.00584 BTC (downside 1.414 Fib Extension).
Tron
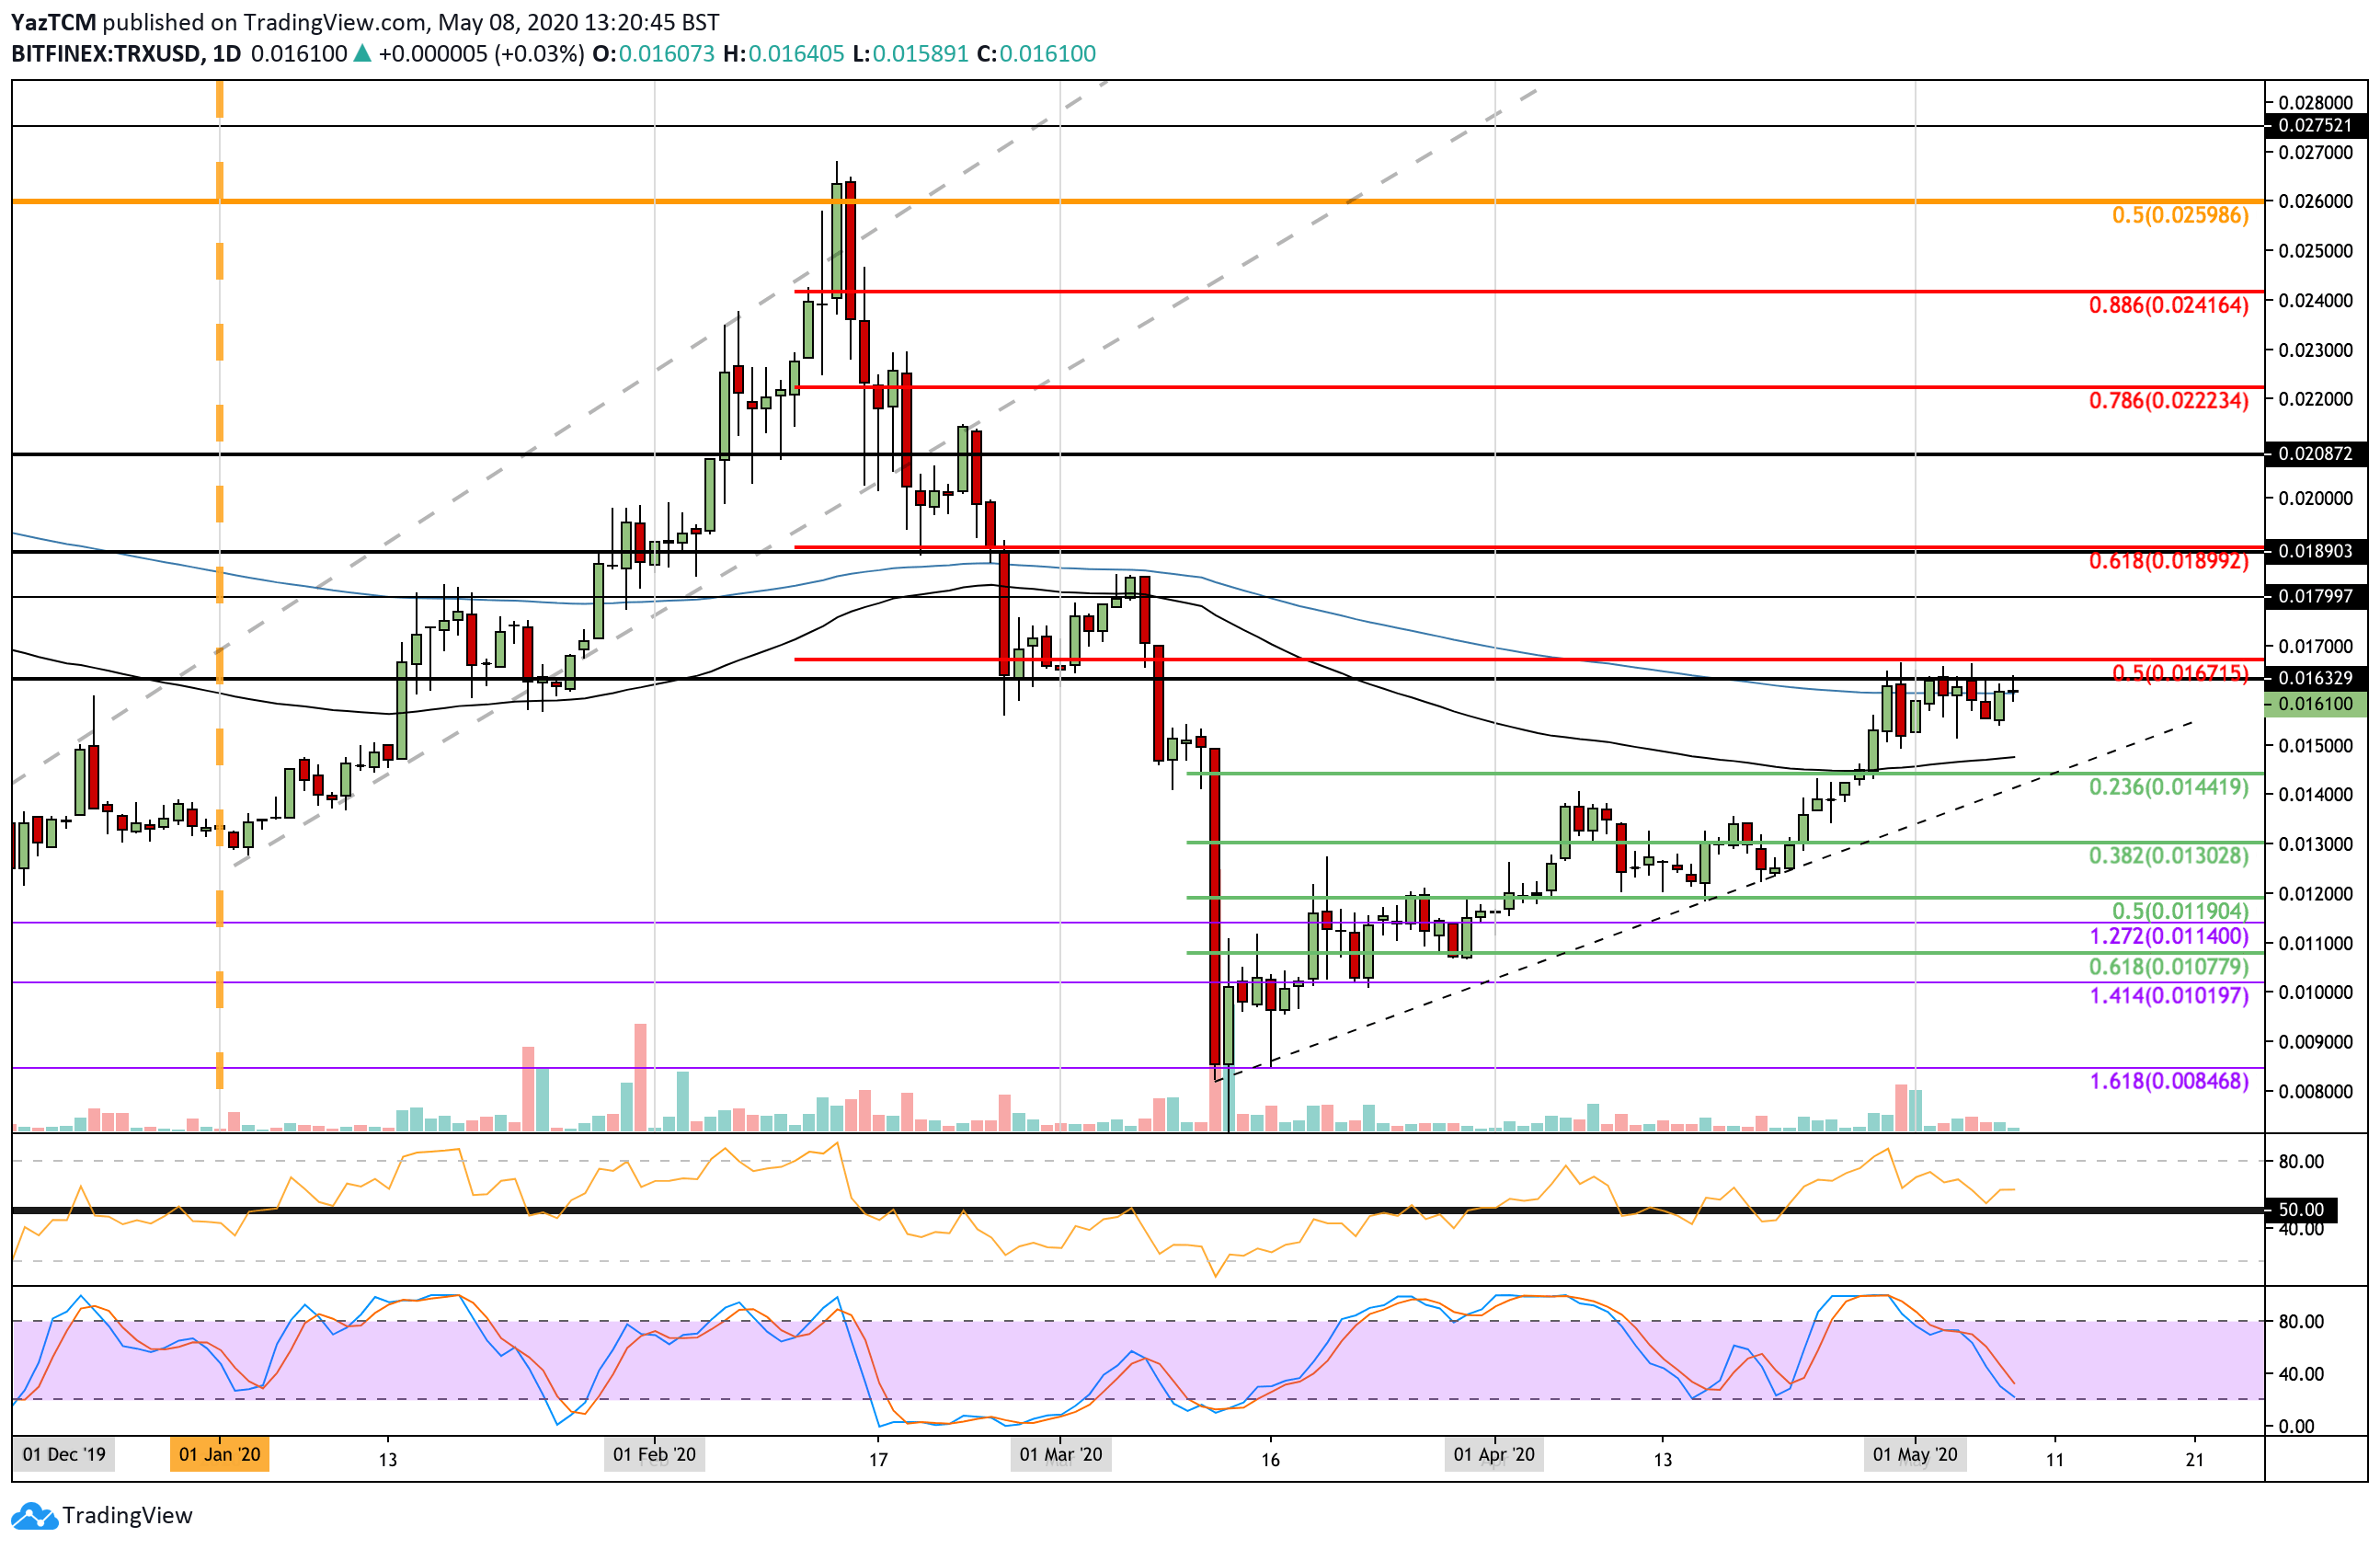
Tron also moved sideways this week as it struggles to break the resistance at $0.163. The coin previously rebounded from support at the rising trend line, which allowed it to climb above $0.014 and reach the resistance at $0.0167 (bearish .5 Fib Retracement). TRX has since traded sideways between $0.0155 and $0.163 as it trades along with the 200-days EMA.
Looking ahead, if the buyers break $).163, resistance is expected at $0.167 (bearish .5 Fib Retracement) and $0.17. Above this, resistance lies at $0.18 and $0.189 (bearish .618 Fib Retracement).
On the other side, if the sellers push lower, the first level of support lies at $0.15 (100-days EMA). Beneath this, support is located at $0.0144 (.236 Fib Retracement and rising trend line), $0.14, and $0.13 (.382 Fib Retracement).
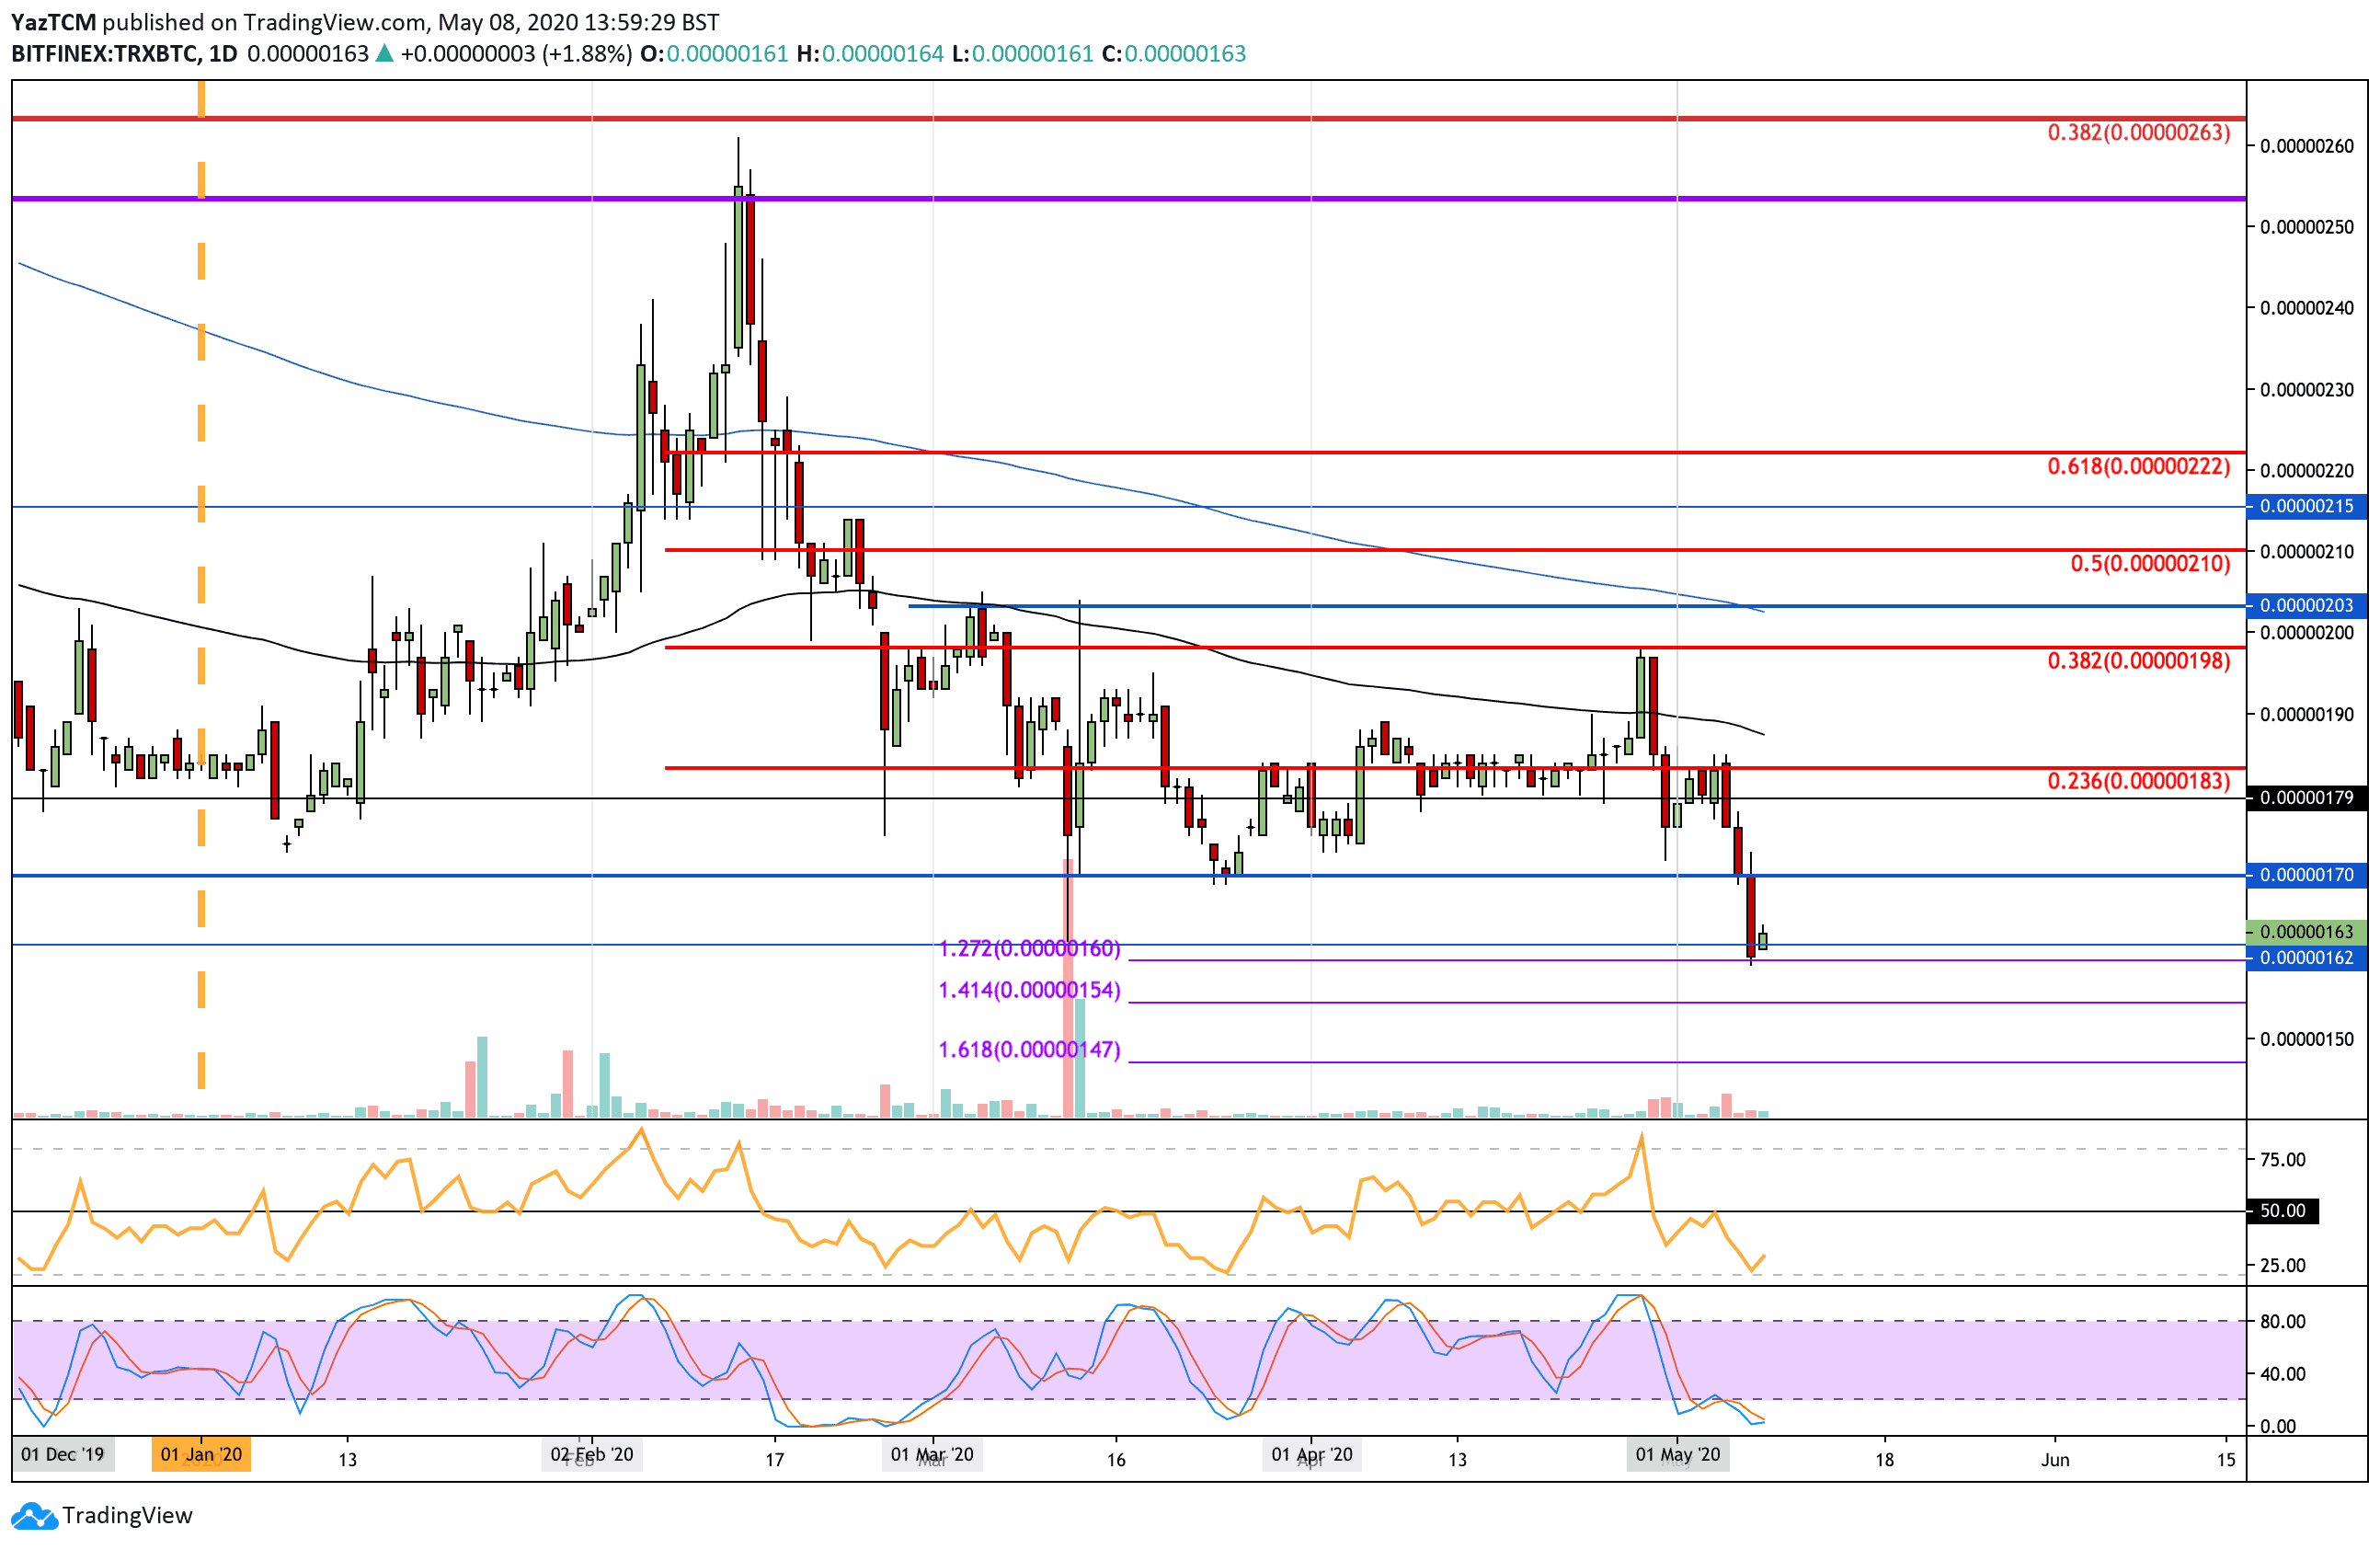
Against BTC, TRX dropped from the 183 SAT level at the start of May and fell beneath the 2020 low at 170 SAT yesterday to reach as low as 160 SAT (downside 1.272 Fib Extension level) creating a new 7-month low price.
If the sellers continue beneath 160 SAT, support is located at 154 SAT (Downside 1.414 Fib Extension), 150 SAT, and 147 SAT (downside 1.618 Fib Extension).
On the other side, if bulls rebound and push higher, resistance is expected at 170 SAT, 183 SAT (bearish .236 Fib Retracement), and 190 SAT (100-days EMA). This is followed by added resistance at 198 SAT (bearish .382 Fib Retracement).
