BitcoinBitcoin saw a period of sideways movement over the past week as it dropped by a small 0.5%. The cryptocurrency has pretty much traded between ,600 and ,200 over the past seven days as it remains above the rising trend line support.So long as BTC can continue above this rising trend line, the bullish trend would be intact.Looking ahead, if the buyers push above ,600, the first two levels of resistance lie at ,815 and ,000. Above this, additional resistance is found at ,226 and ,430.On the other side, if the sellers step in, the first support level lies at ,150. Beneath this, support can be found at ,000, ,750 (100-day EMA), and ,500 (200-day EMA).BTC/USD. Source: TradingViewEthereumEthereum saw a small 2.3% decrease over the past seven days as it dropped into
Topics:
Yaz Sheikh considers the following as important: btcusd, CROBTC, CROUSD, ETH Analysis, ETHBTC, ethusd, Price Analysis, XLMBTC, XLMUSD, XRP Analysis, xrpbtc, xrpusd
This could be interesting, too:
Chayanika Deka writes Why Arthur Hayes Is Bullish on Bitcoin Under Trump’s Economic Strategy
Mandy Williams writes Why the Bitcoin Market Is Stuck—and the Key Metric That Could Change It: CryptoQuant CEO
Wayne Jones writes Metaplanet Acquires 156 BTC, Bringing Total Holdings to 2,391
Jordan Lyanchev writes Liquidations Top 0M as Bitcoin Falls K, Reversing Trump-Driven Rally
Bitcoin
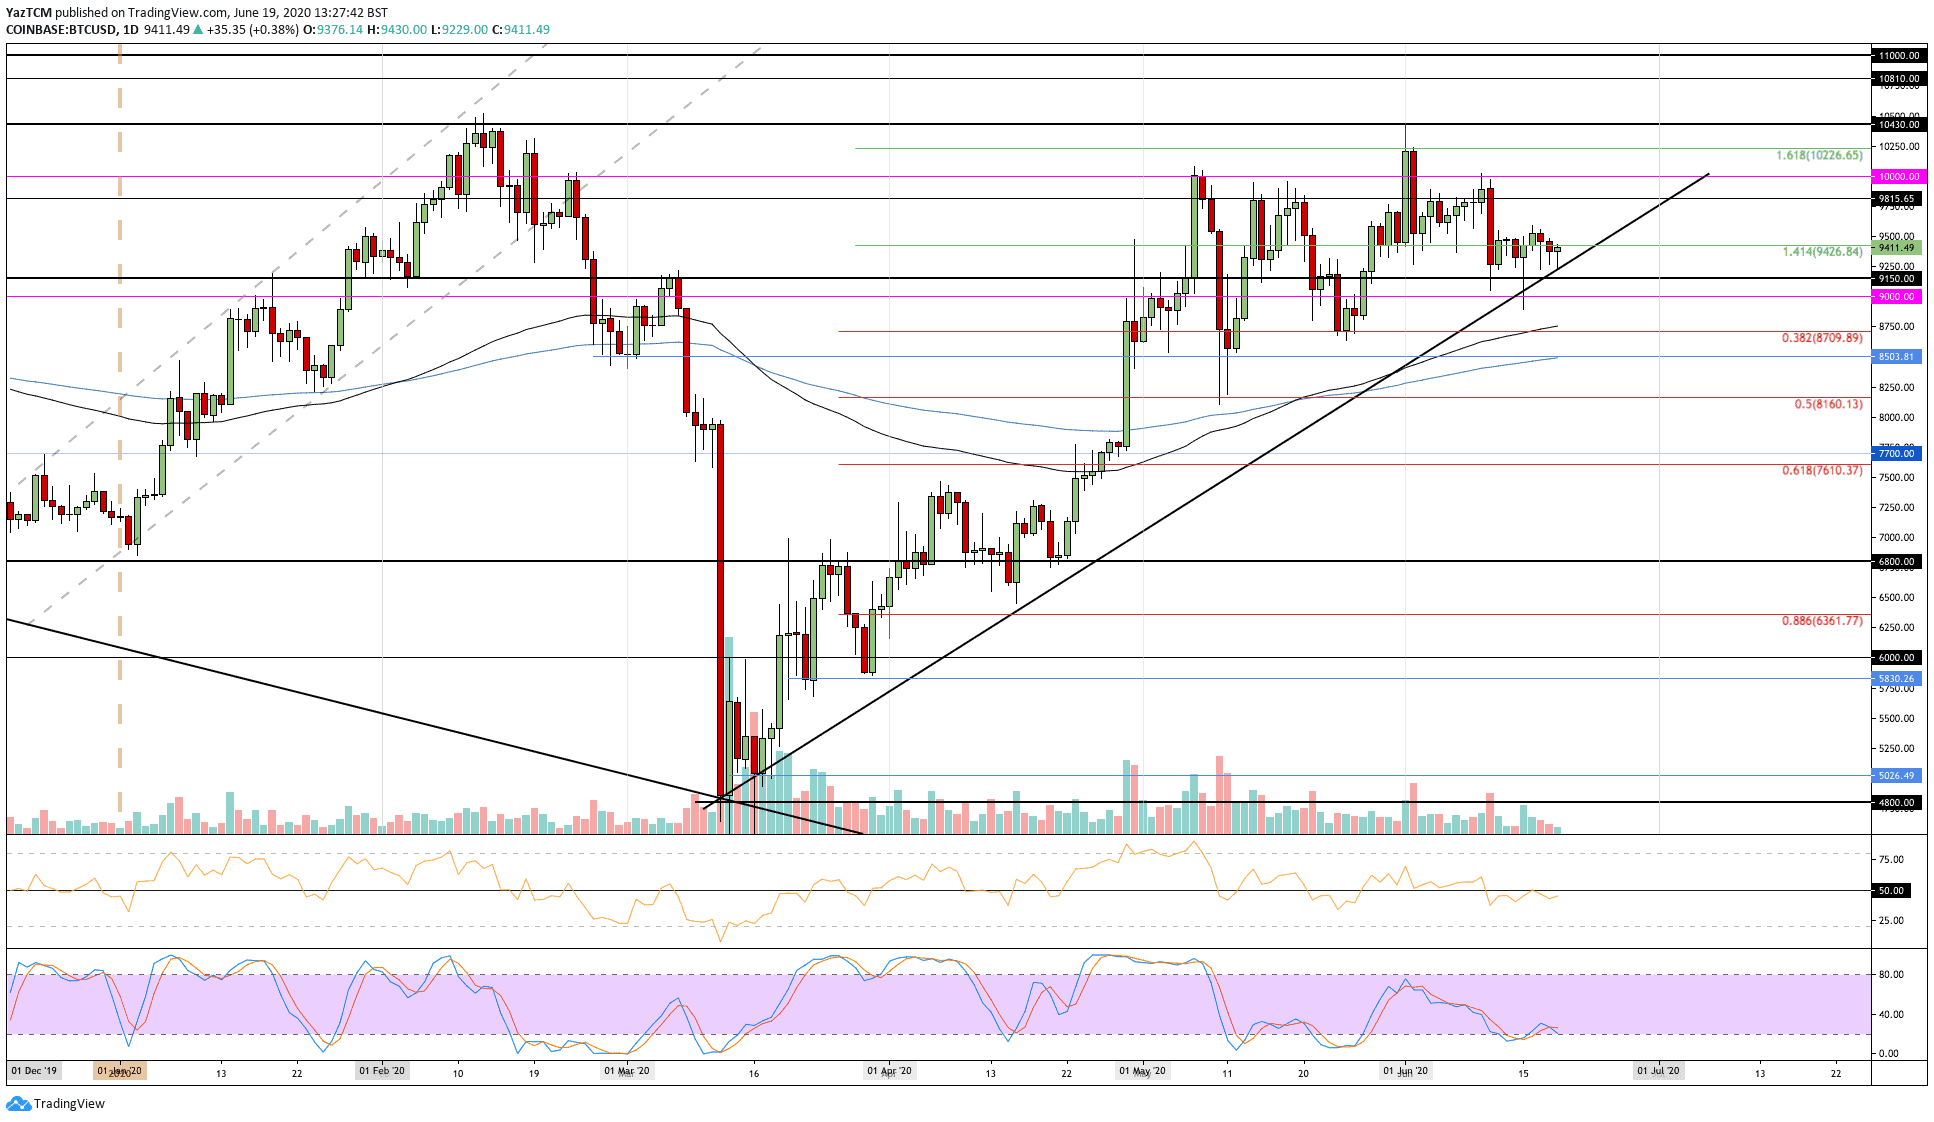
Bitcoin saw a period of sideways movement over the past week as it dropped by a small 0.5%. The cryptocurrency has pretty much traded between $9,600 and $9,200 over the past seven days as it remains above the rising trend line support.
So long as BTC can continue above this rising trend line, the bullish trend would be intact.
Looking ahead, if the buyers push above $9,600, the first two levels of resistance lie at $9,815 and $10,000. Above this, additional resistance is found at $10,226 and $10,430.
On the other side, if the sellers step in, the first support level lies at $9,150. Beneath this, support can be found at $9,000, $8,750 (100-day EMA), and $8,500 (200-day EMA).
Ethereum
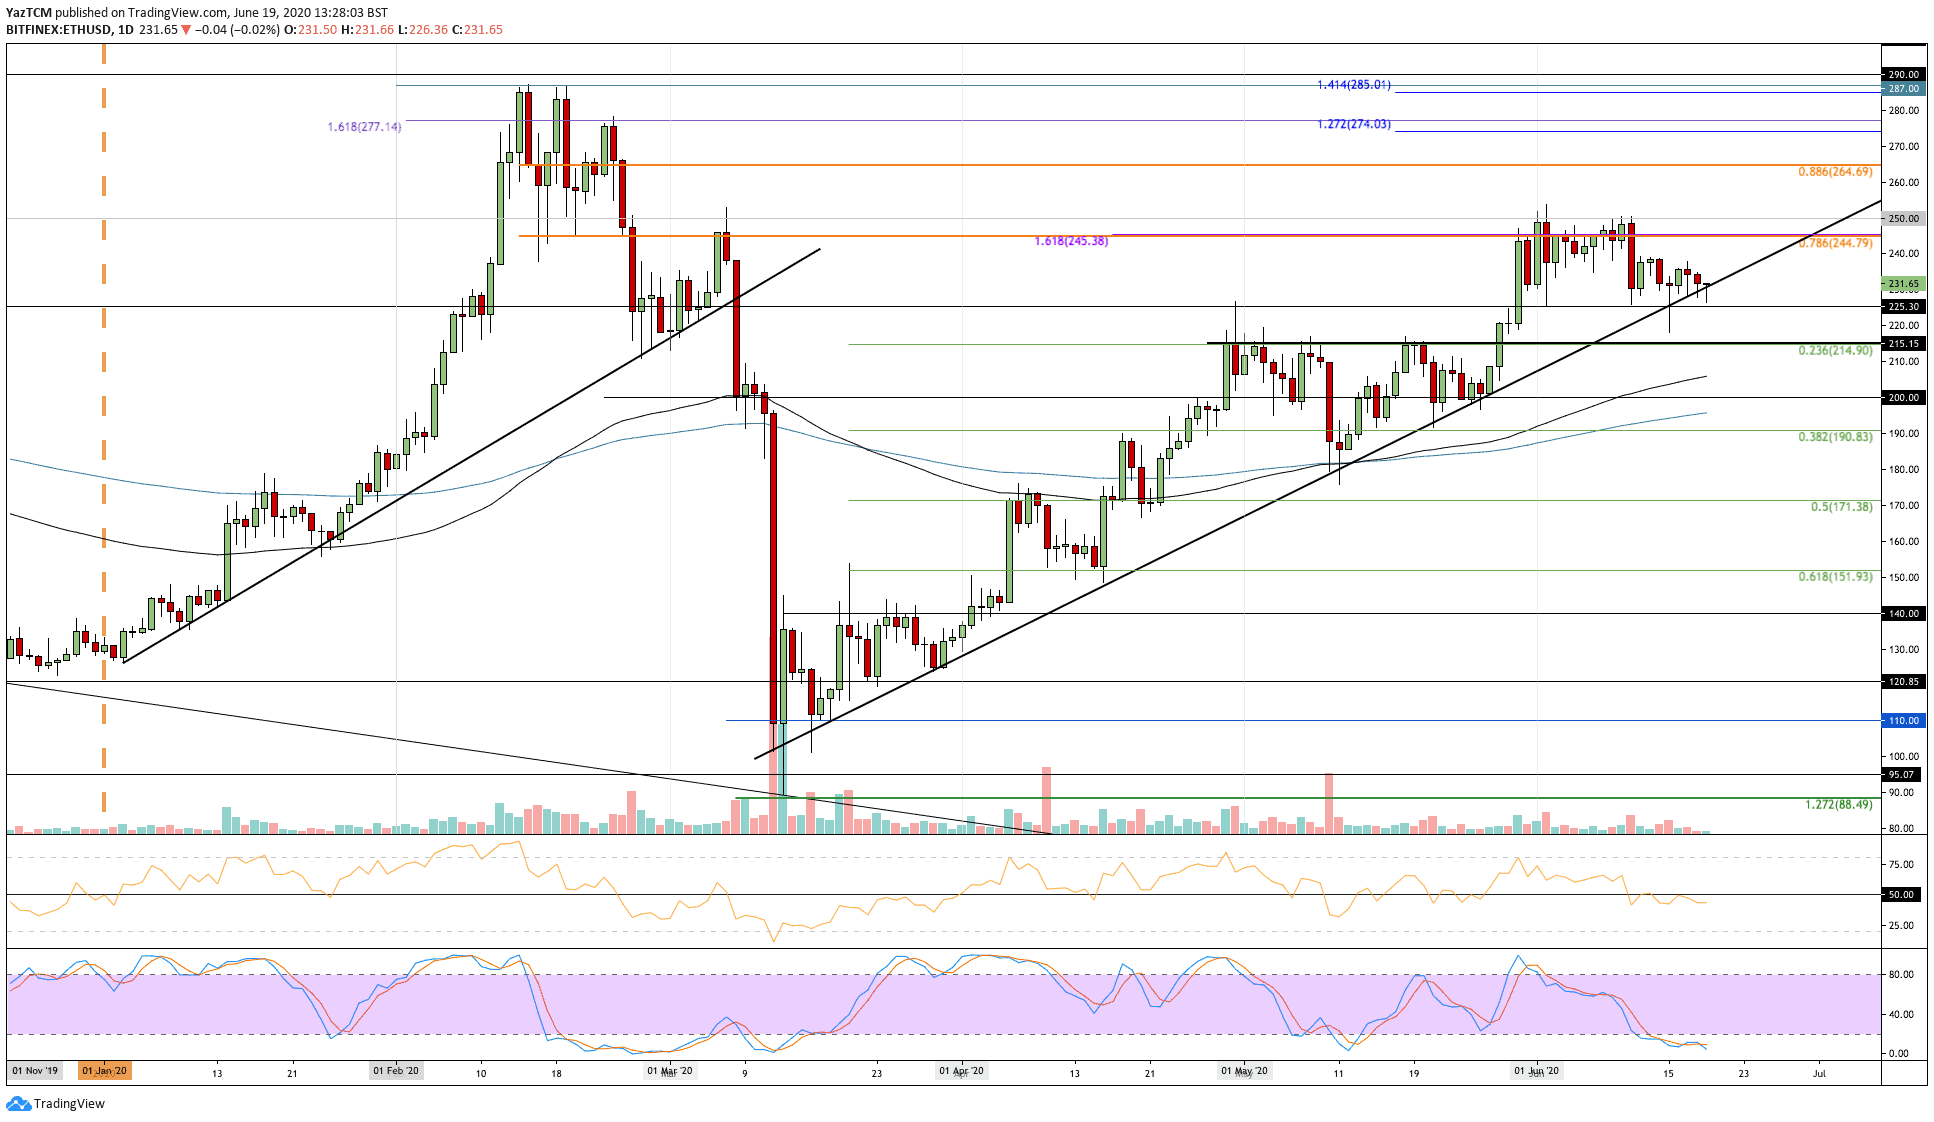
Ethereum saw a small 2.3% decrease over the past seven days as it dropped into the $231 level. ETH is still trading above a long term rising trend line. However, it does look like the sellers are trying to push beneath there.
A break beneath this rising trend line is likely to cause ETH to exit its current bullish trend and head lower back toward $200.
Moving forward, if the sellers push below the trend line, the first level of support lies at $225. This is followed by support at $215 (.235 Fib Retracement), $200, and $190 (.382 Fib Retracement).
On the other side, if the buyers rebound from the rising trend line, the first two levels of resistance lie at $245 (bearish .786 Fib Retracement) and $250. Above this, resistance is found at $265 (bearish .886 Fib Retracement).
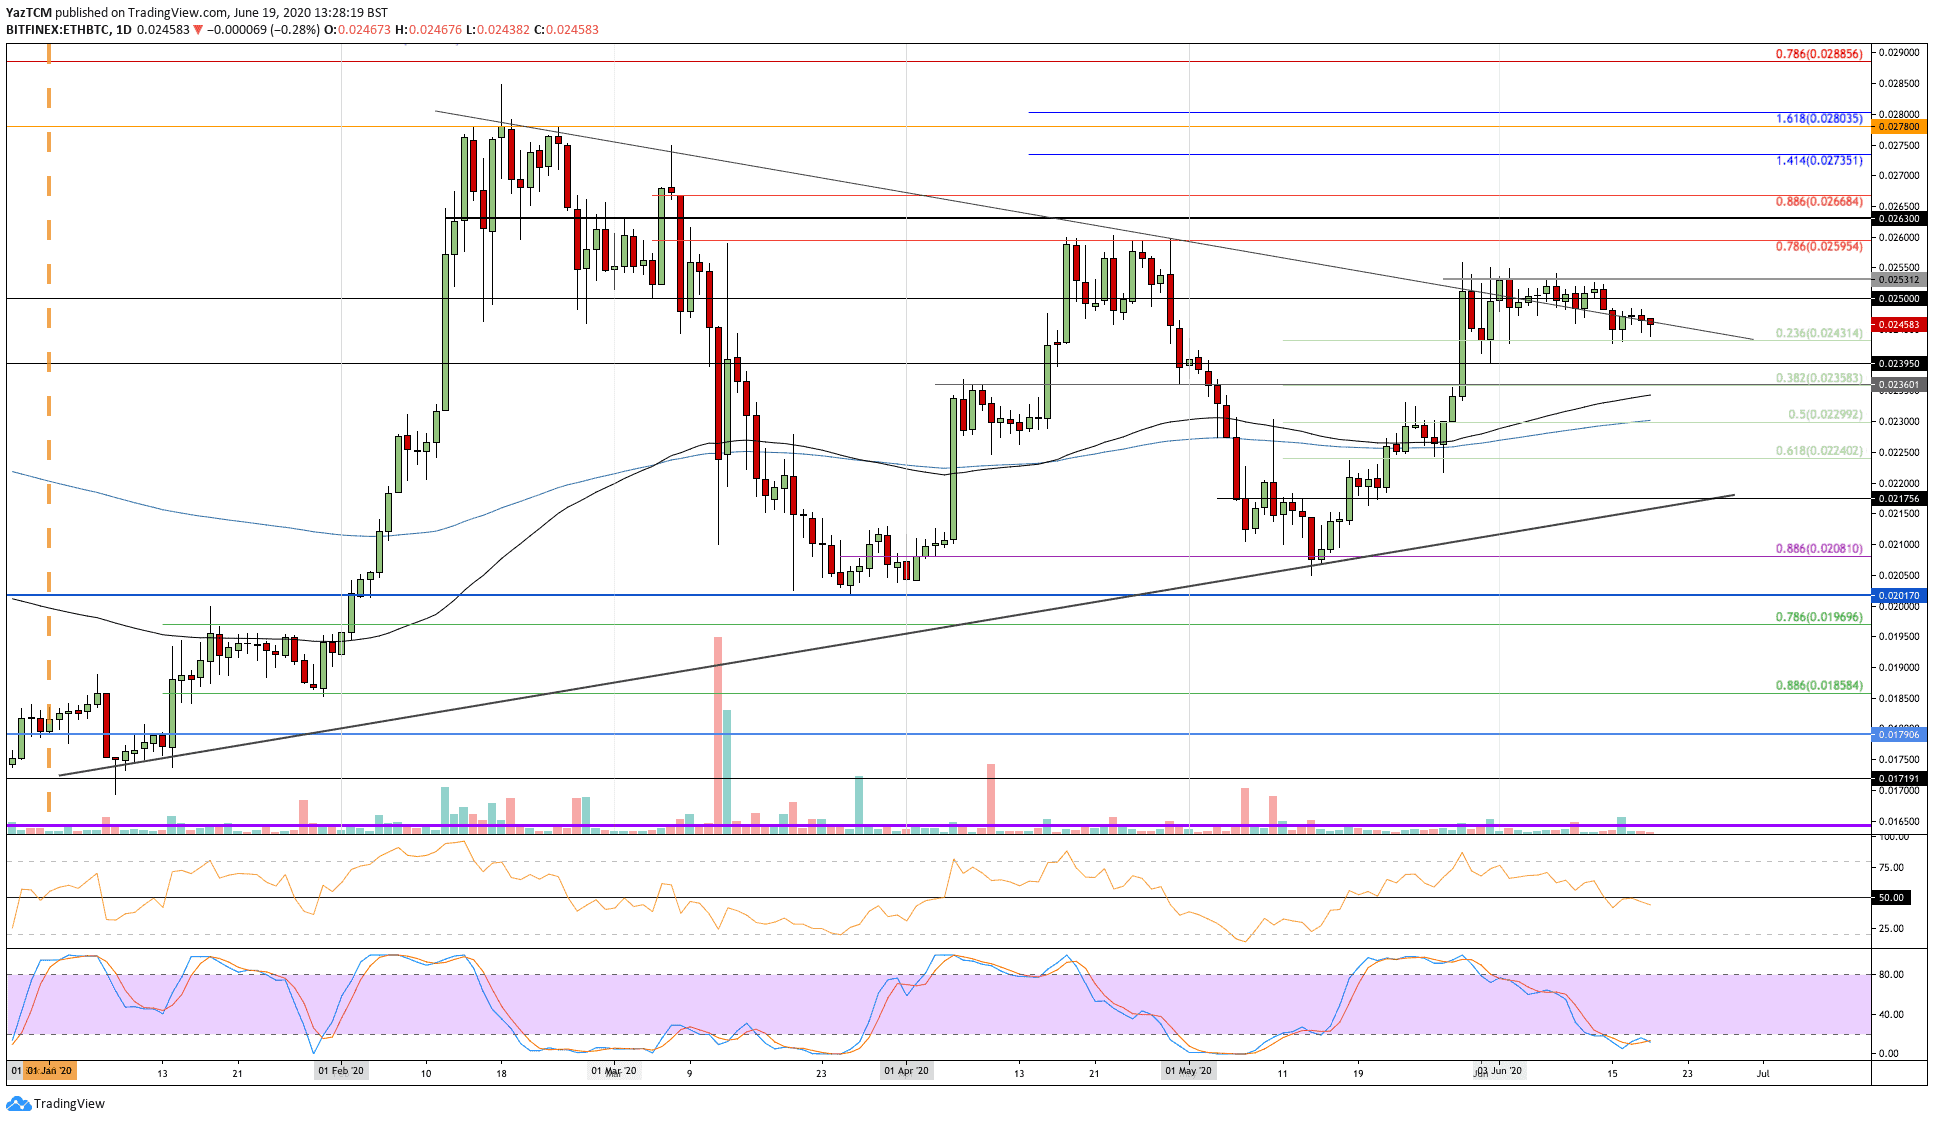
Against Bitcoin, ETH retraced slightly this week from the resistance seen at 0.0253 BTC. The coin dropped beneath the 0.025 BTC level and continued to fall throughout the week until finding the support at 0.0243, provided by a .236 Fib Retracement level.
ETH bounced from this level as it currently trades at 0.0245 BTC.
Looking ahead, if the buyers push higher, then resistance is located at 0.025 BTC and 0.0253 BTC. Above this, added resistance is expected at 0.026 BTC (bearish .786 Fib Retracement).
On the other side, if the sellers break beneath 0.0243 BTC, support is found at 0.0239 BTC, 0.0235 BTC (.382 Fib Retracement), and 0.23 BTC (200-days EMA).
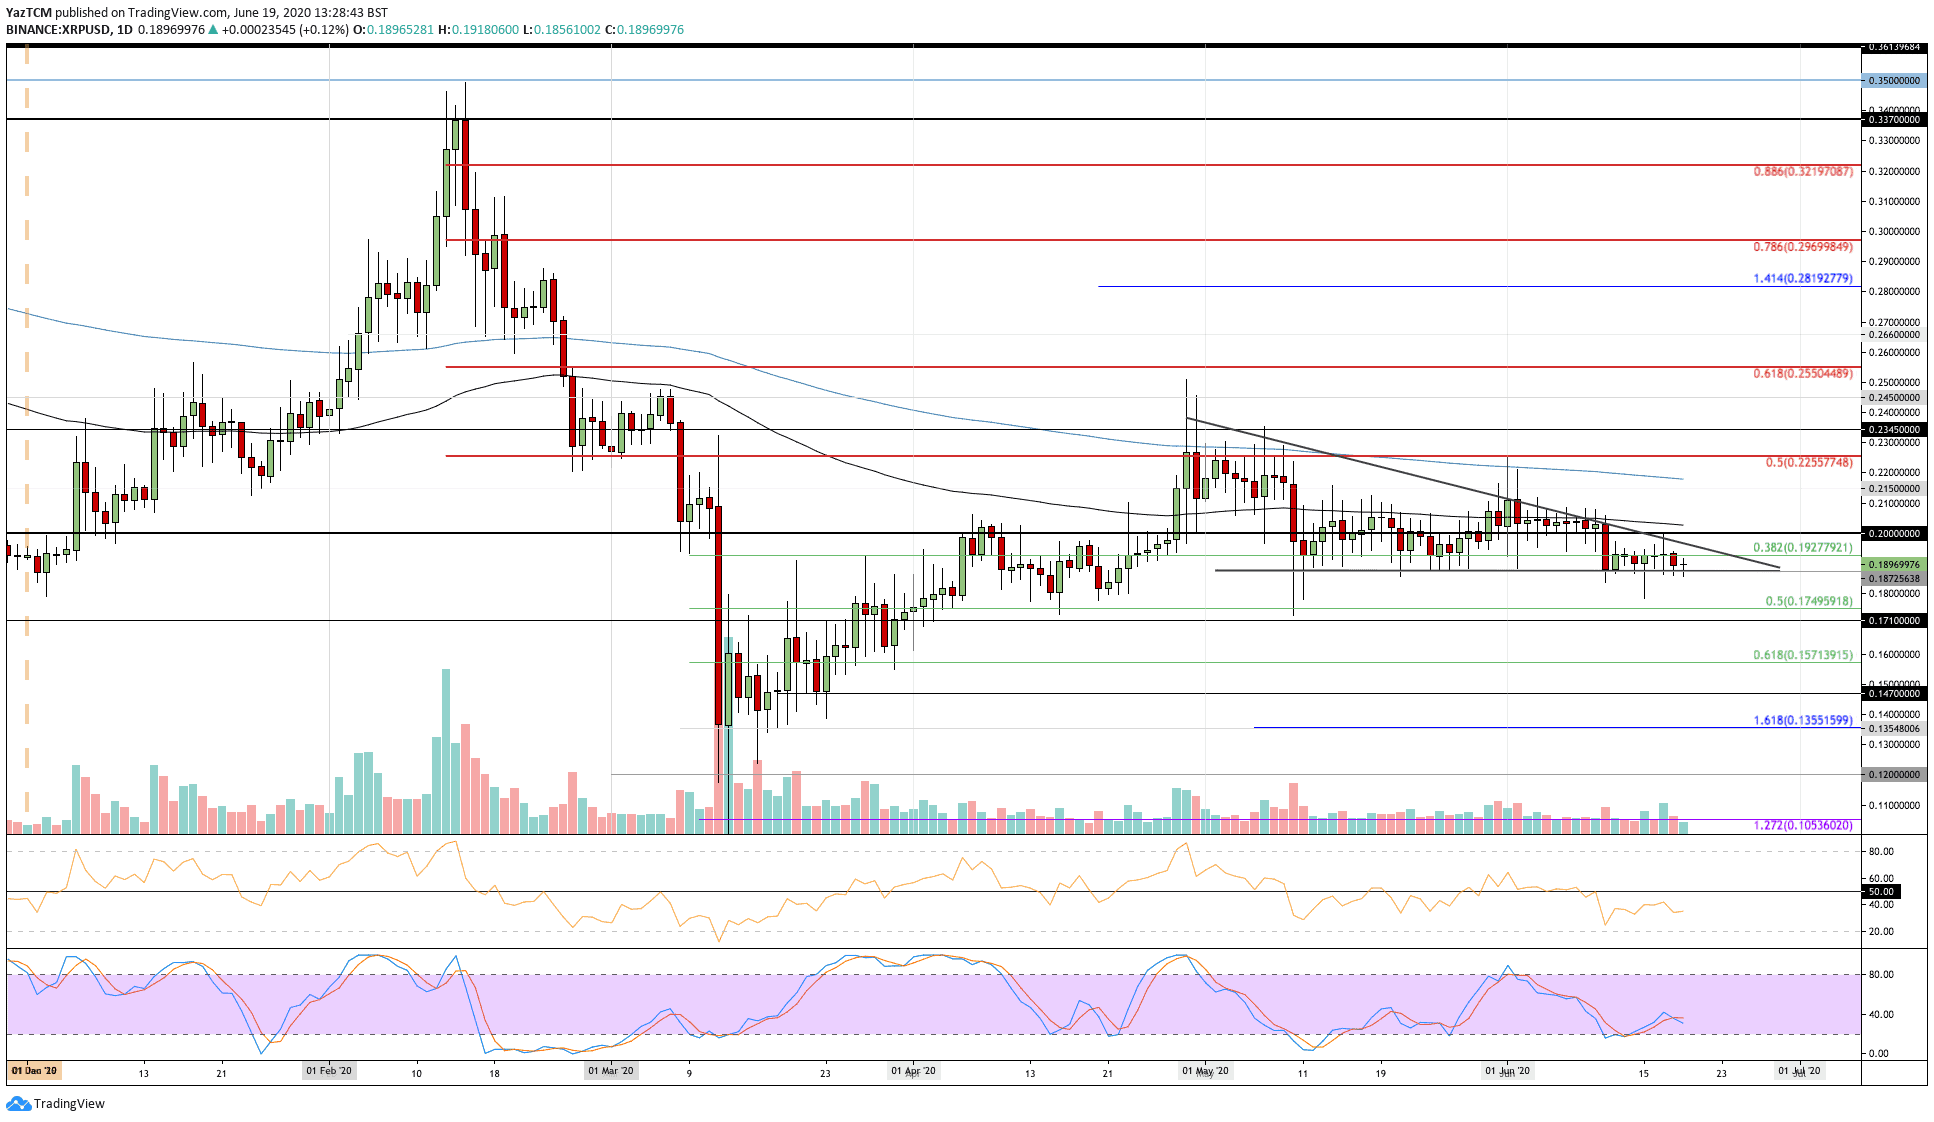
Ripple
XRP also saw a sideways week of trading as it slipped by a small 1.7% this week to trade at $0.19. The coin had dropped from the upper boundary of the triangle last week as it fell beneath $0.20 and continued lower than the $0.192 support to reach $0.187.
XRP has held this $0.187 support throughout the entire week and has allowed the coin to remain within the boundaries of the descending triangle pattern.
Looking ahead, if the sellers push beneath the base of the triangle, the first level of support lies at $0.18. Beyond that, support is expected at $0.175 (.5 Fib Retracement) and $0.171.
Alternatively, if the bulls can bounce from the lower boundary and break above $0.19, the first level of resistance lies at the upper boundary of the triangle. Above the triangle, resistance lies at $0.20 (100-day EMA) and $0.215.
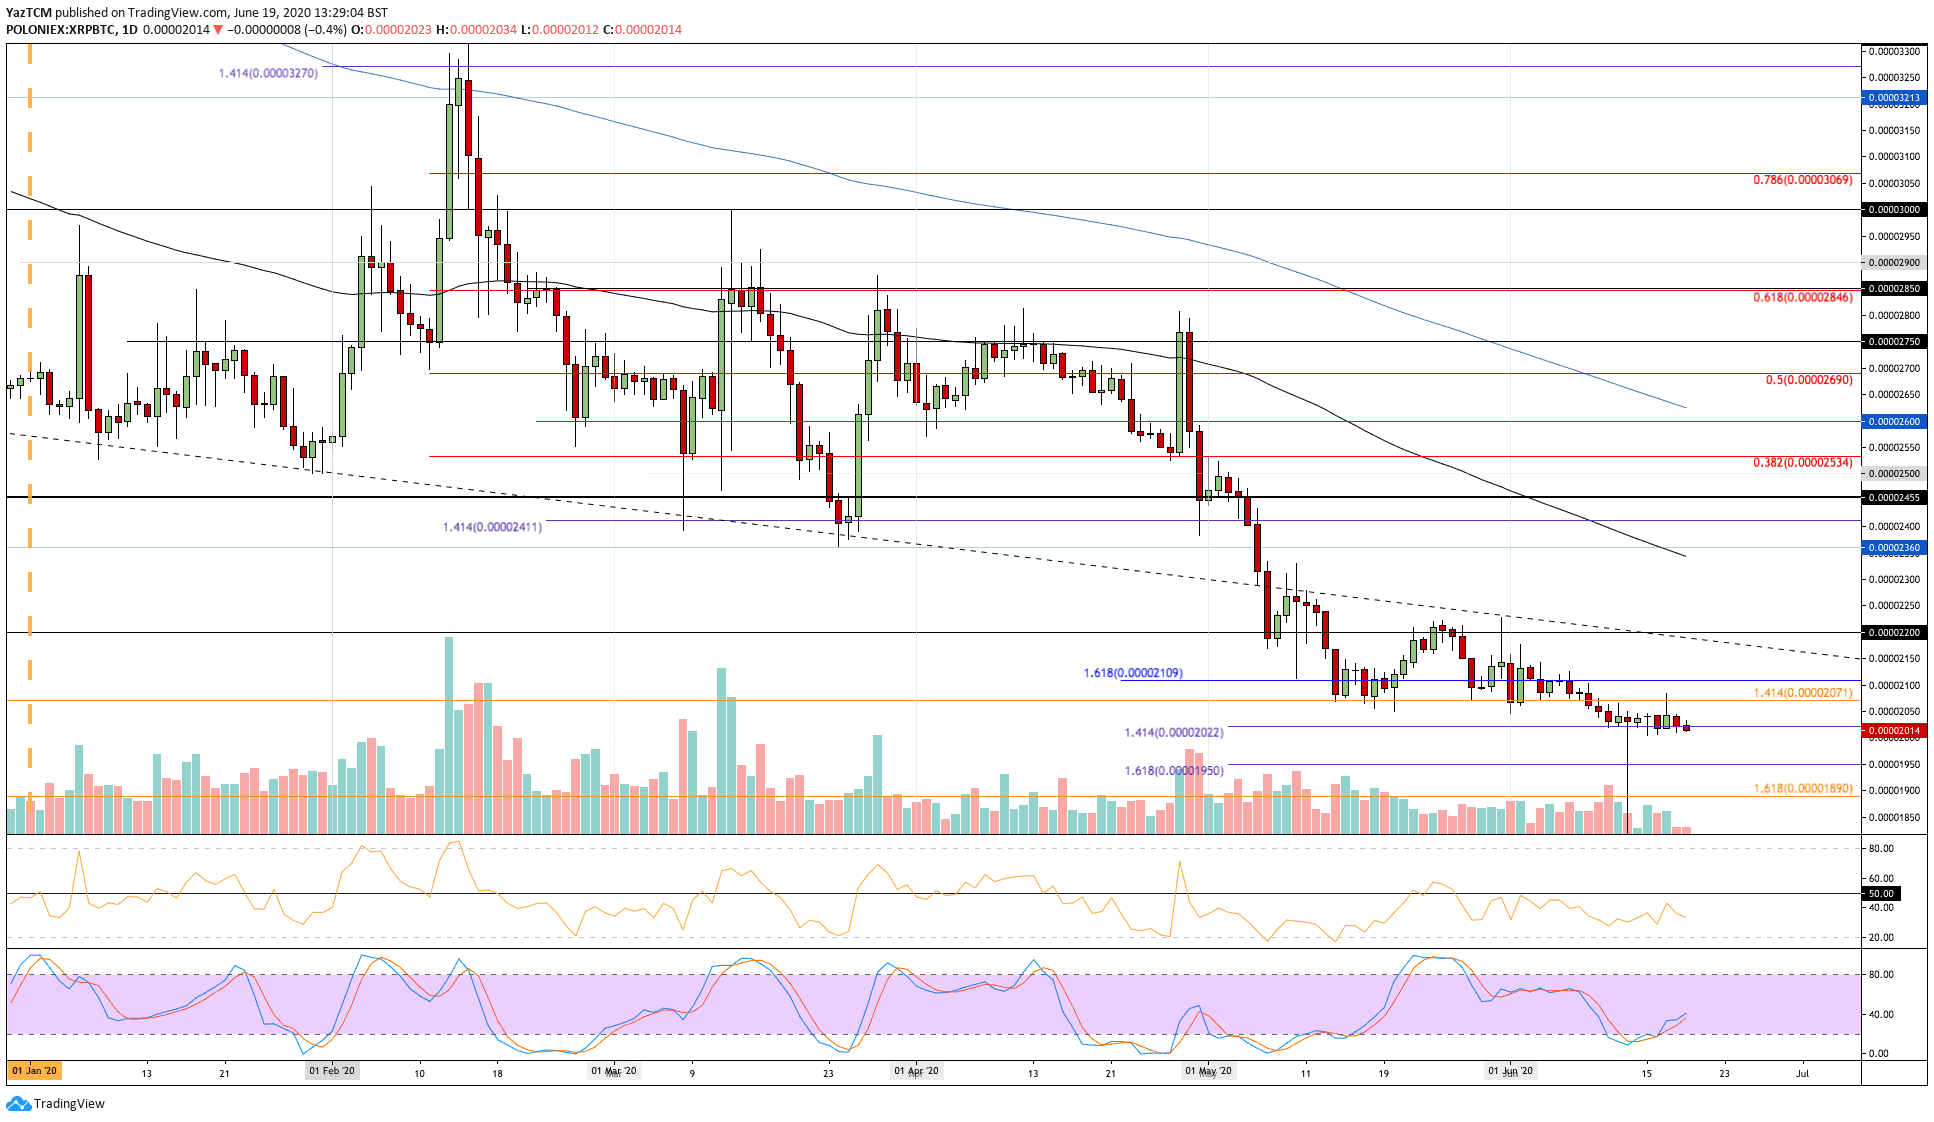
Against Bitcoin, XRP continued to trade at the multi-year lows that it created last week around at the 2022 SAT level. This is a low that has not been seen for over two years, and a break beneath it would cause disaster for XRP as investors could start to panic.
If the sellers do push beneath 2022 SAT, the first level of support is expected at 2000 SAT. Beneath this, added support is at 1950 SAT and 1890 SAT.
On the other side, if the bulls can regroup and push higher, resistance is expected at 2071 SAT, 2100 SAT, and 2200 SAT.
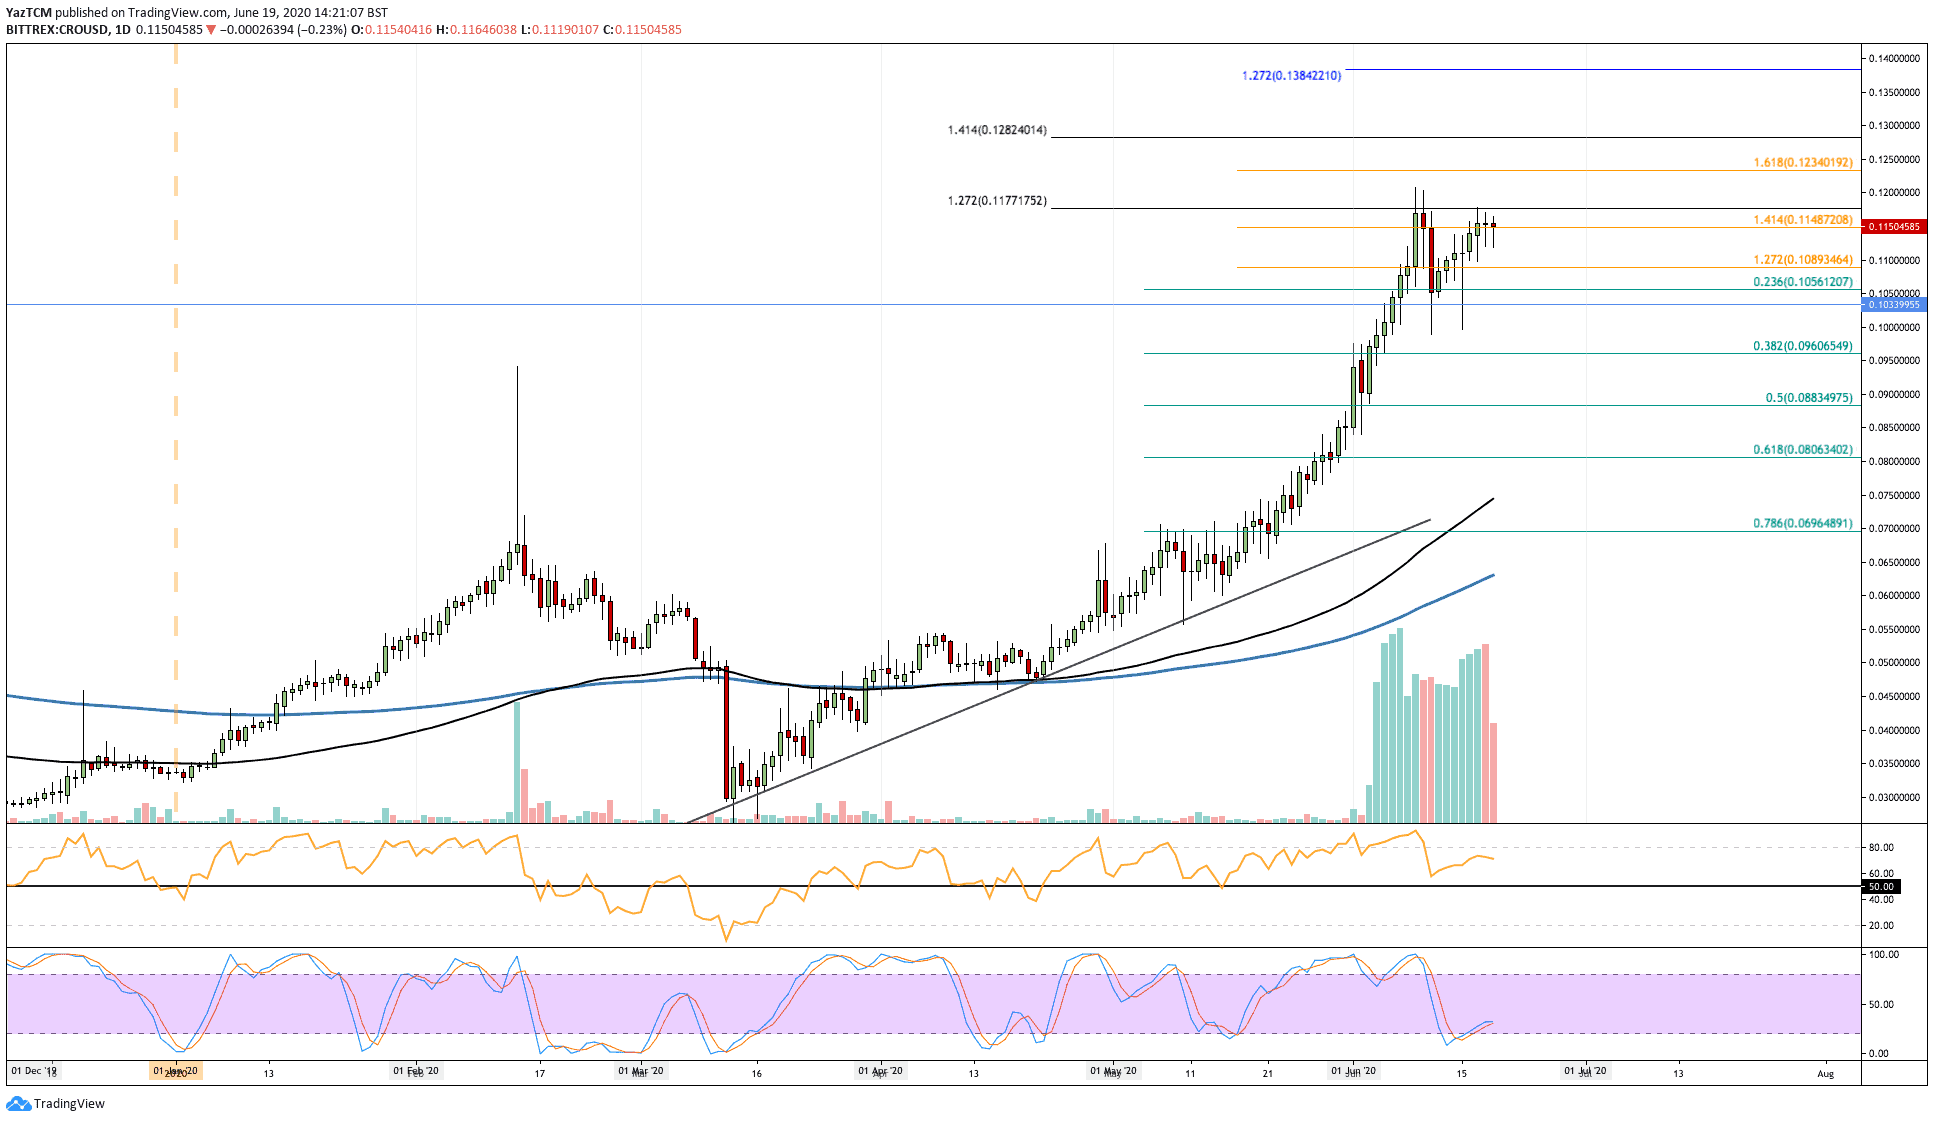
Crypto.com
CRO saw a 5.5% price increase over the last week, which allowed it to reach $0.115. CRO has seen incredible growth over the past month after it managed to surge by a total of around 61%.
This week, CRO started trading at the $0.105 level as it pushed higher to reach $0.115, which is resistance provided by a 1.414 Fib Extension.
Looking ahead, if the buyers can push higher above $0.117, resistance can be expected at $0.123, $0.128, and $0.138.
On the other side, if the sellers step in and push CRO lower, support lies at $0.11, $0.105 (.235 Fib Retracement), $0.1, and $0.096 (.382 Fib Retracement).
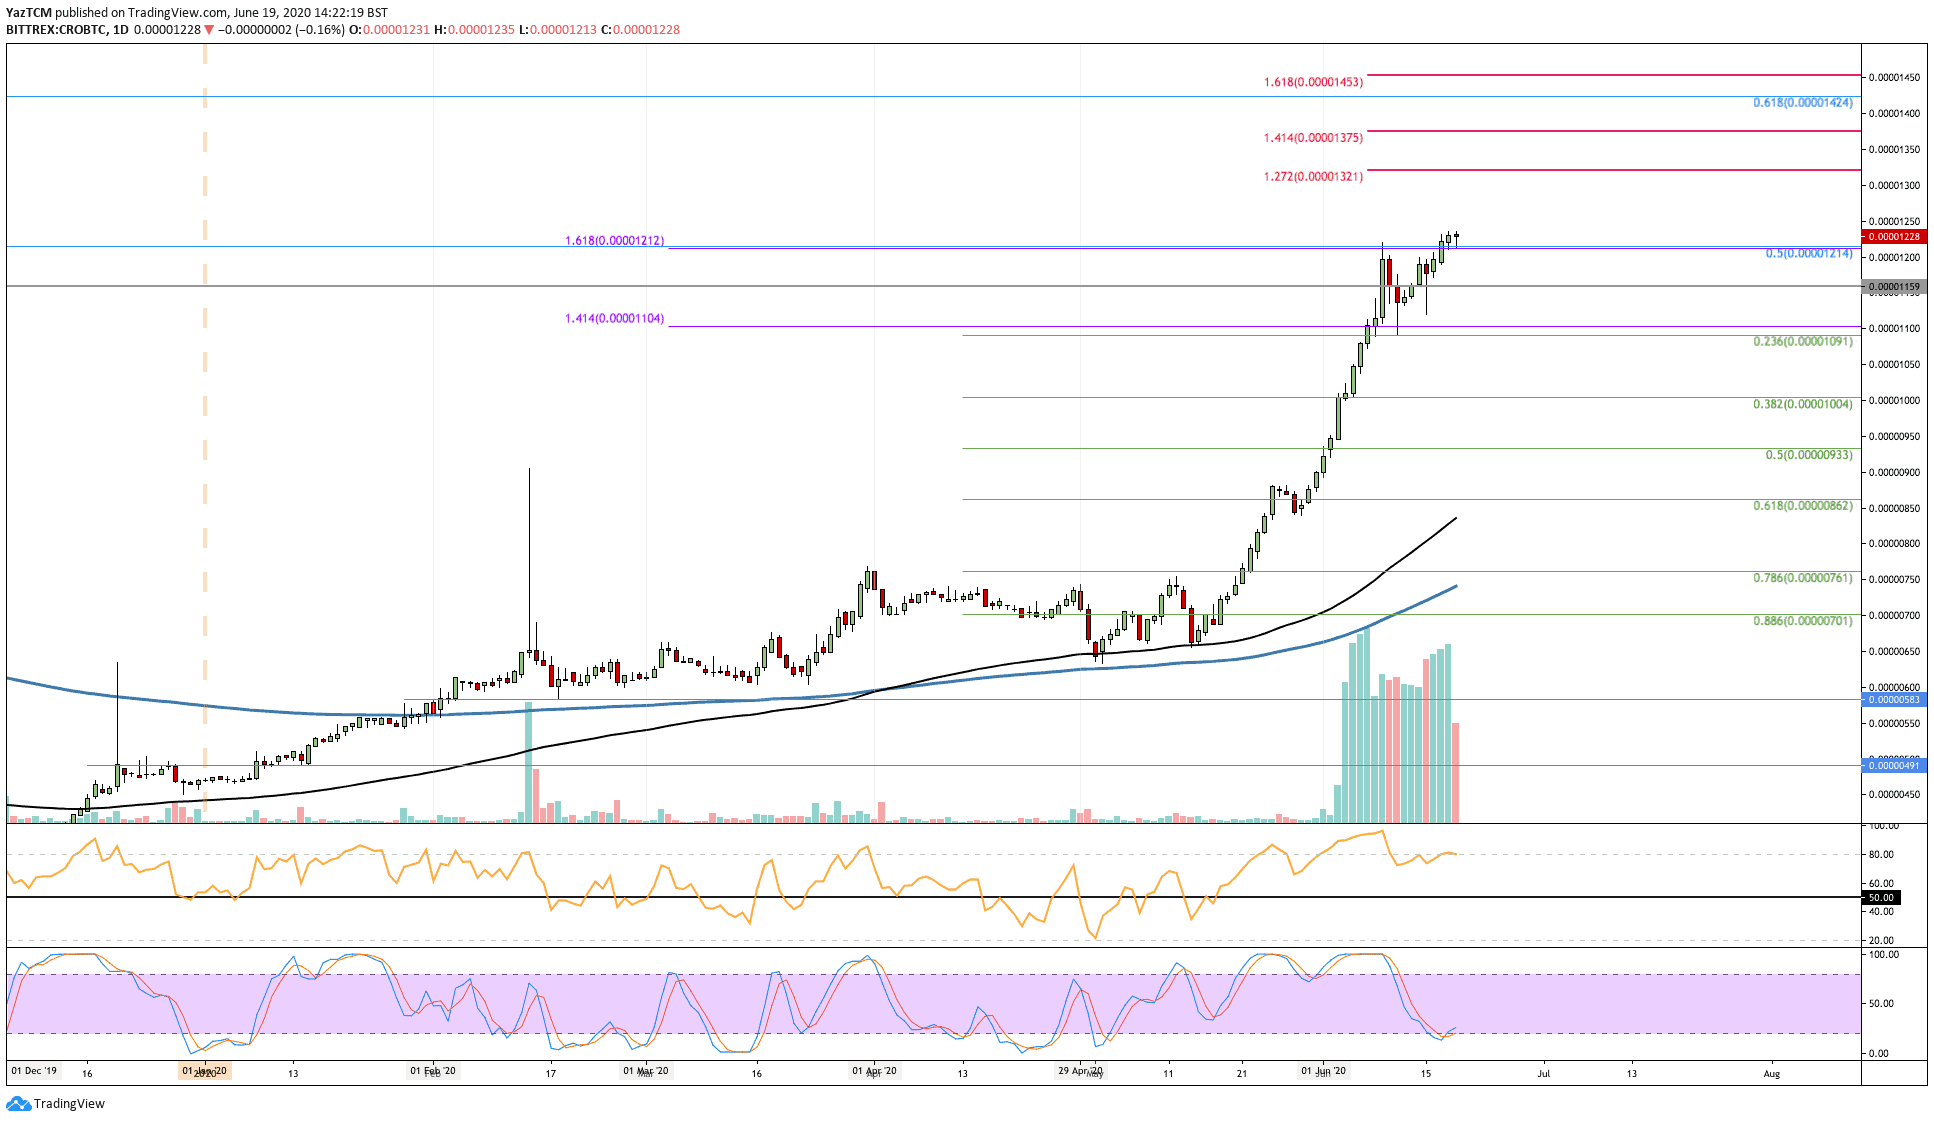
Against BTC, CRO has been performing just as well as it managed to climb from 1150 SAT to reach as high as 1229 SAT today. The cryptocurrency recently broke above strong resistance at 1215 SAT, which is provided by a bearish .5 Fib Retracement level.
Looking ahead, if the buyers continue to drive CRO higher, resistance is expected at 1300 SAT, 1320 SAT (1.272 Fib Extension), 1375 SAT (1.414 Fib Extension), and 1400 SAT.
On the other side, if the sellers push lower, support can be found at 1160 SAT, 1091 SAT (.236 Fib Retracement), and 1000 SAT (.382 Fib Retracement).
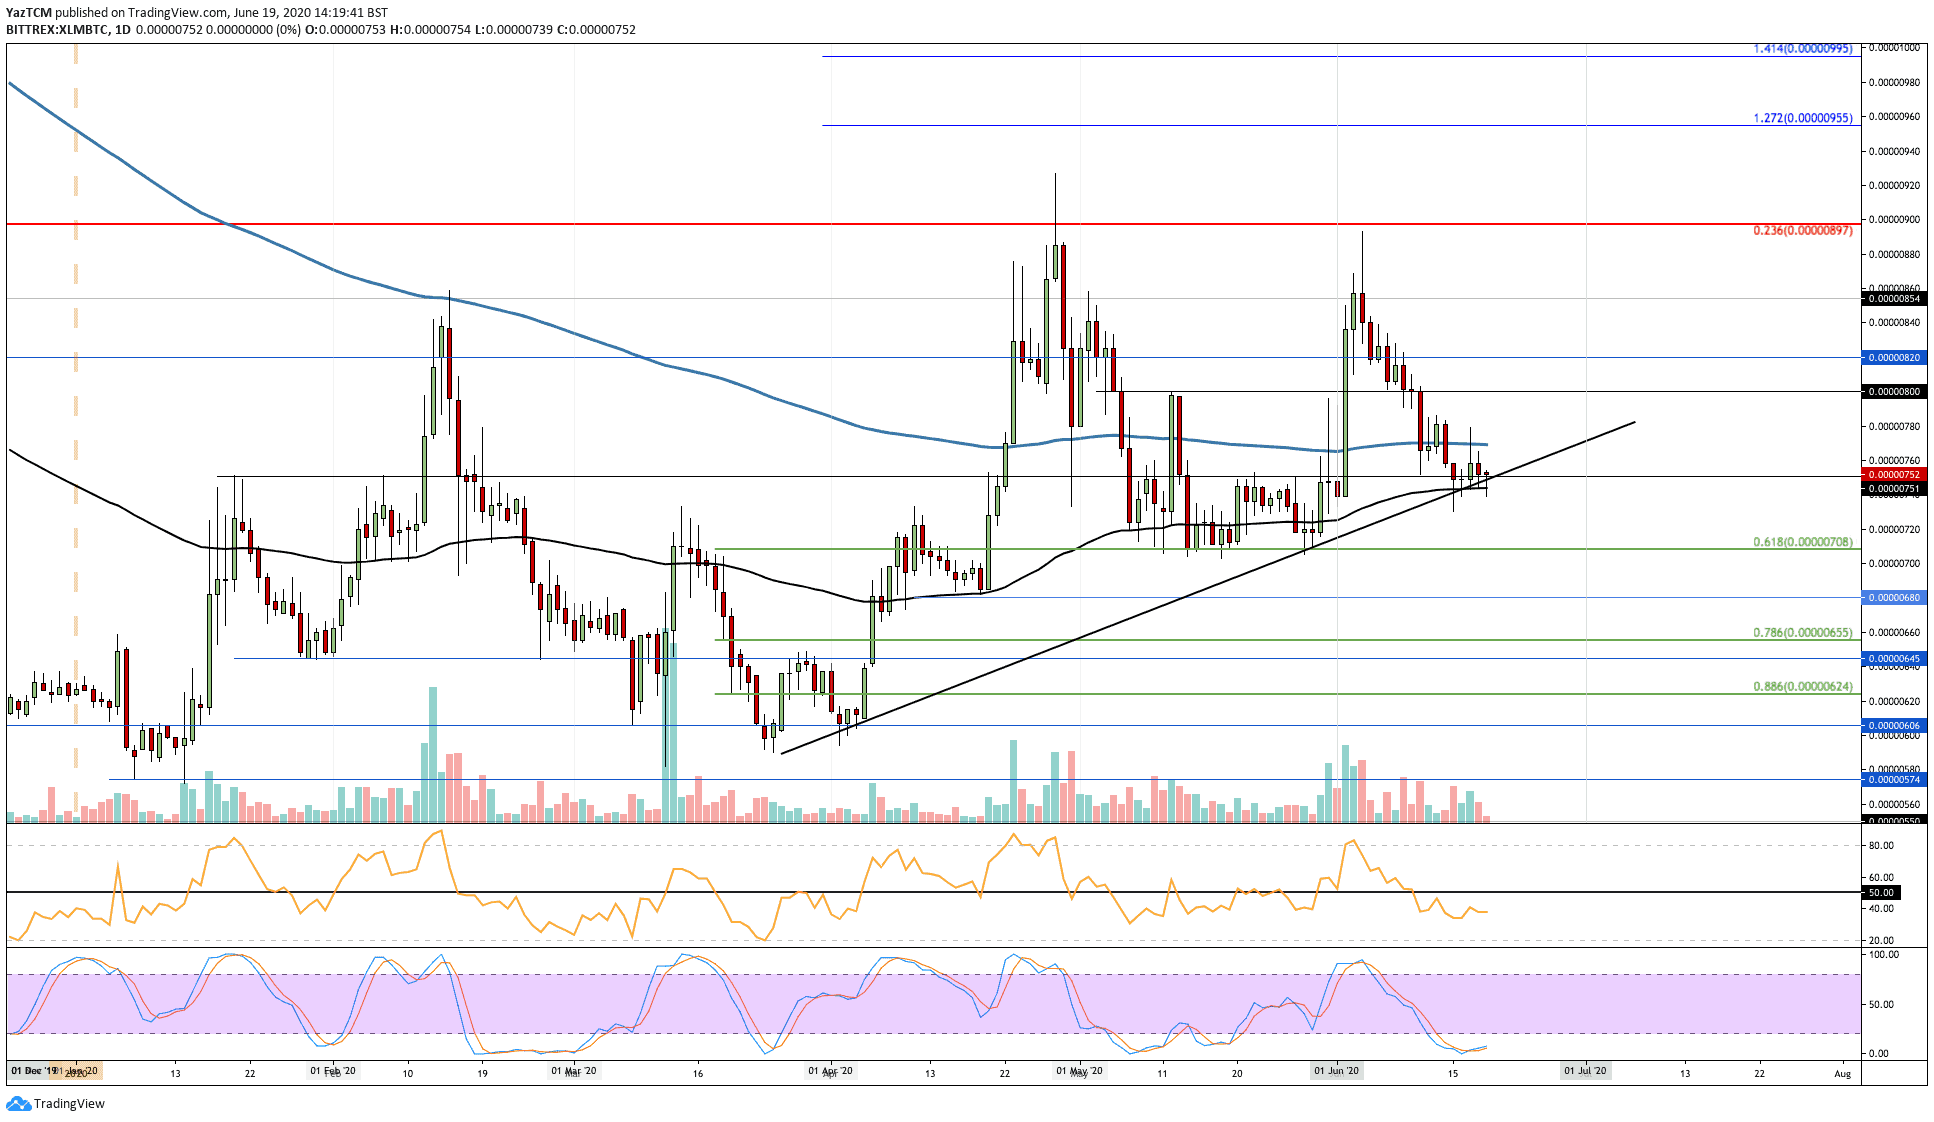
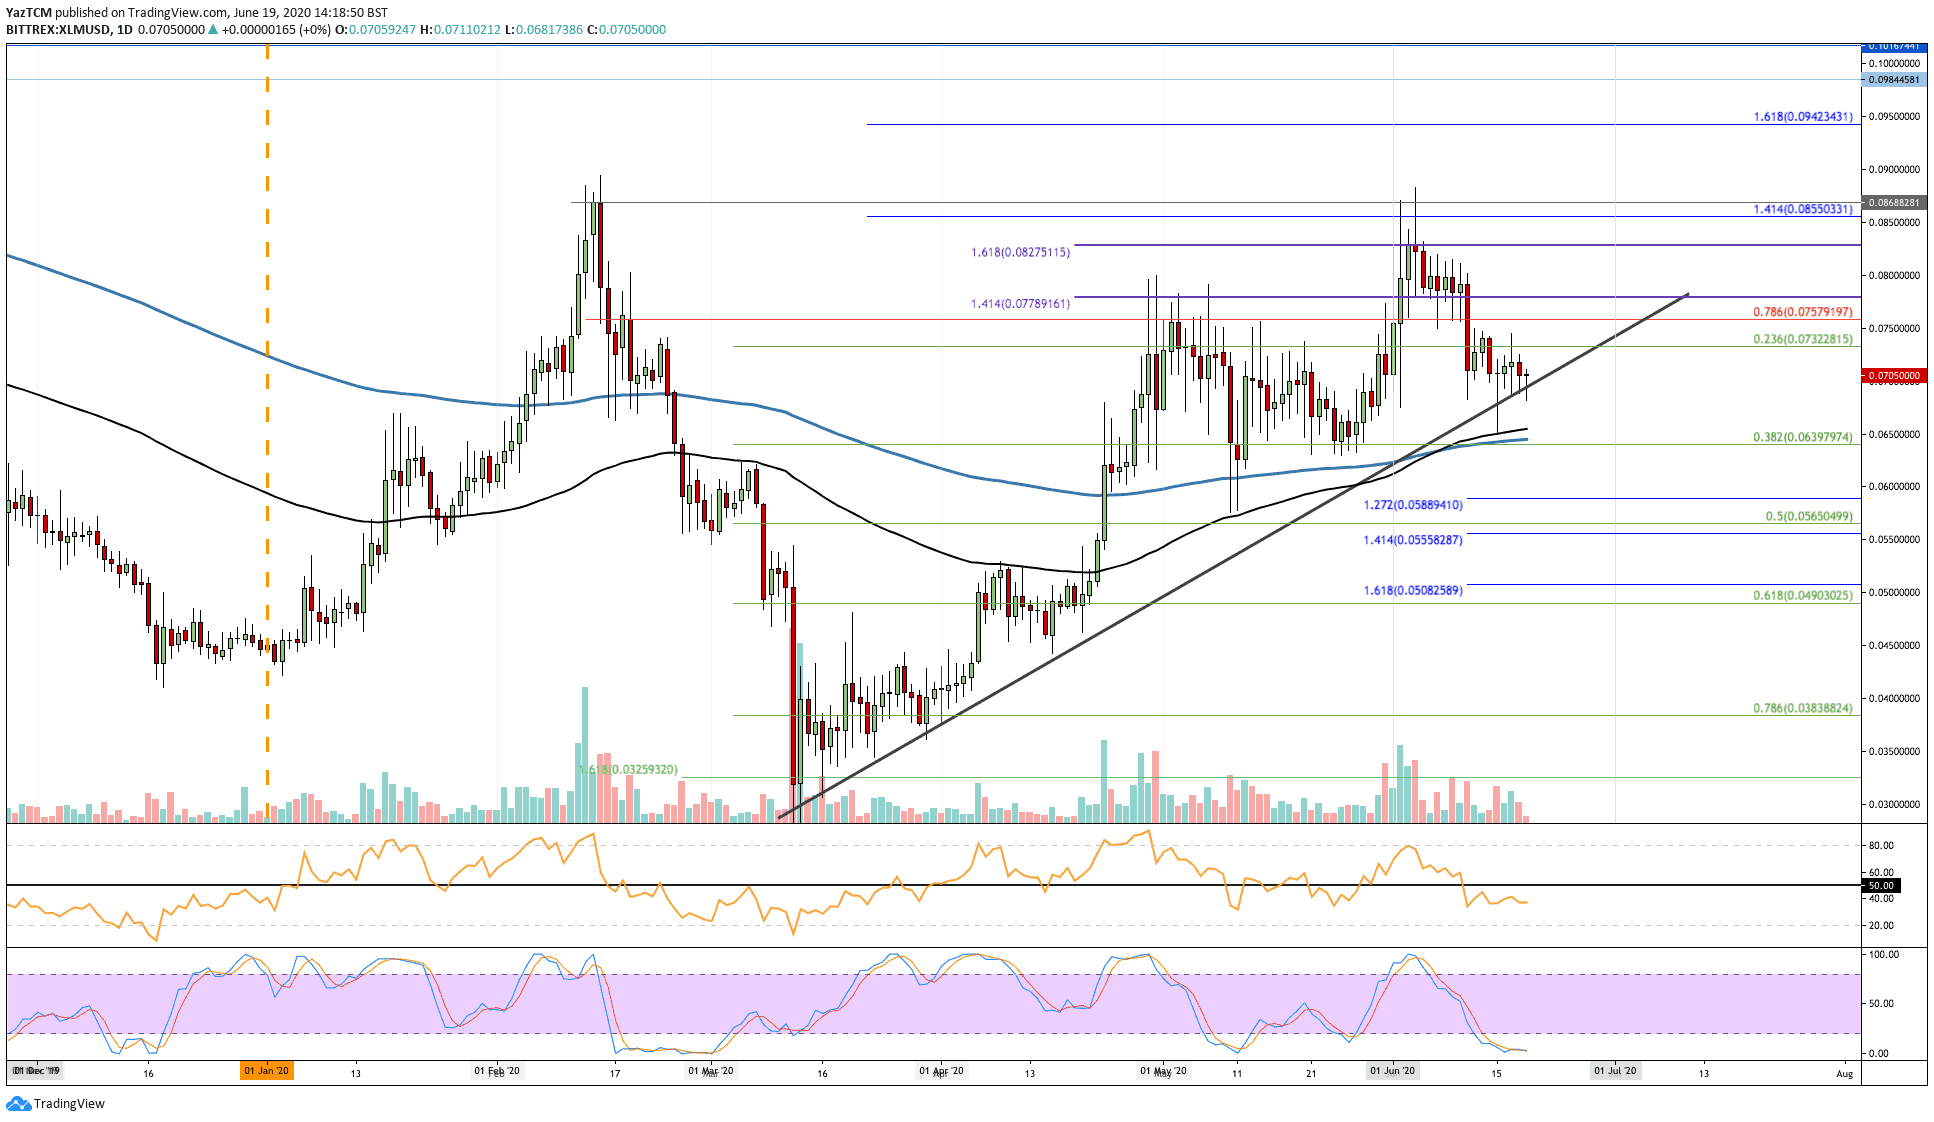
Stellar
Stellar saw a 3.5% price fall over the last week of trading as it dropped from $0.075 to reach the current $0.07 level. Despite this small price decline, Stellar is still trading above a rising trend line, which keeps the bullish trend intact for the coin.
The cryptocurrency has dropped from the June high of around $0.087 and must break above this level to continue the bullish run.
Looking ahead, if the buyers rebound from the rising trend line, the first level of resistance is expected at $0.0757 (bearish .786 Fib Retracement). This is followed by added resistance at $0.077, $0.082 (1.618 Fib Extension), and $0.085.
Alternatively, if the sellers push beneath the trend line, strong support lies at $0.065 (.382 Fib Retracement & 200-days EMA). Added support is located at $0.058 (downside 1.272 Fib Extension), $0.056 (.5 Fib Retracement), and $0.050.
Against BTC, XLM is in a similar scenario as it dropped from the June high of 890 SAT to fall as low as 750 SAT, where support was found at the rising trend line and the 100-days EMA.
Looking ahead, if the buyers push higher, the first level of resistance is located at 770 SAT (200-days EMA). Above this, resistance lies at 800 SAT, 860 SAT, and 900 SAT (bearish .236 Fib Retracement).
On the other side, if the sellers push beneath the rising trend line, support leis at 708 SAT (.618 Fib Retracement), 680 SAT, and 655 SAT (.786 Fib Retracement).