Bitcoin Bitcoin saw another 4% price hike this week, which had it breaking above the ,000 level to reach as high as ,491 today. The coin has since dropped slightly to trade at ,135 at the time of writing. Last week, the coin had surged into the ,000 level, which caused it to roll over and drop into the ,850 support last Saturday. Bitcoin managed to rebound higher from there as it started to climb on Sunday. The coin did not return to ,000 until Wednesday, and it surged above the resistance yesterday to reach as high as ,400. Looking ahead, if the buyers manage to break ,400 again, the first level of higher resistance lies at ,720 (1.272 Fib Extension). Following this, resistance lies at ,800, ,000, and ,186 (2018 Highs). Additional
Topics:
Yaz Sheikh considers the following as important: ADABTC, ADAUSD, Bitcoin (BTC) Price, BTCEUR, BTCGBP, btcusd, btcusdt, Cardano (ADA) Price, ETH Analysis, ETHBTC, Ethereum (ETH) Price, ethusd, LINKBTC, LINKUSD, Litecoin (LTC) Price, Price Analysis, Ripple (XRP) Price, XRP Analysis, xrpbtc, xrpusd
This could be interesting, too:
Chayanika Deka writes XRP, SOL, and ADA Inclusion in US Crypto Reserve Pushes Traders on Edge
Chayanika Deka writes Why Arthur Hayes Is Bullish on Bitcoin Under Trump’s Economic Strategy
Mandy Williams writes Why the Bitcoin Market Is Stuck—and the Key Metric That Could Change It: CryptoQuant CEO
Wayne Jones writes Metaplanet Acquires 156 BTC, Bringing Total Holdings to 2,391
Bitcoin
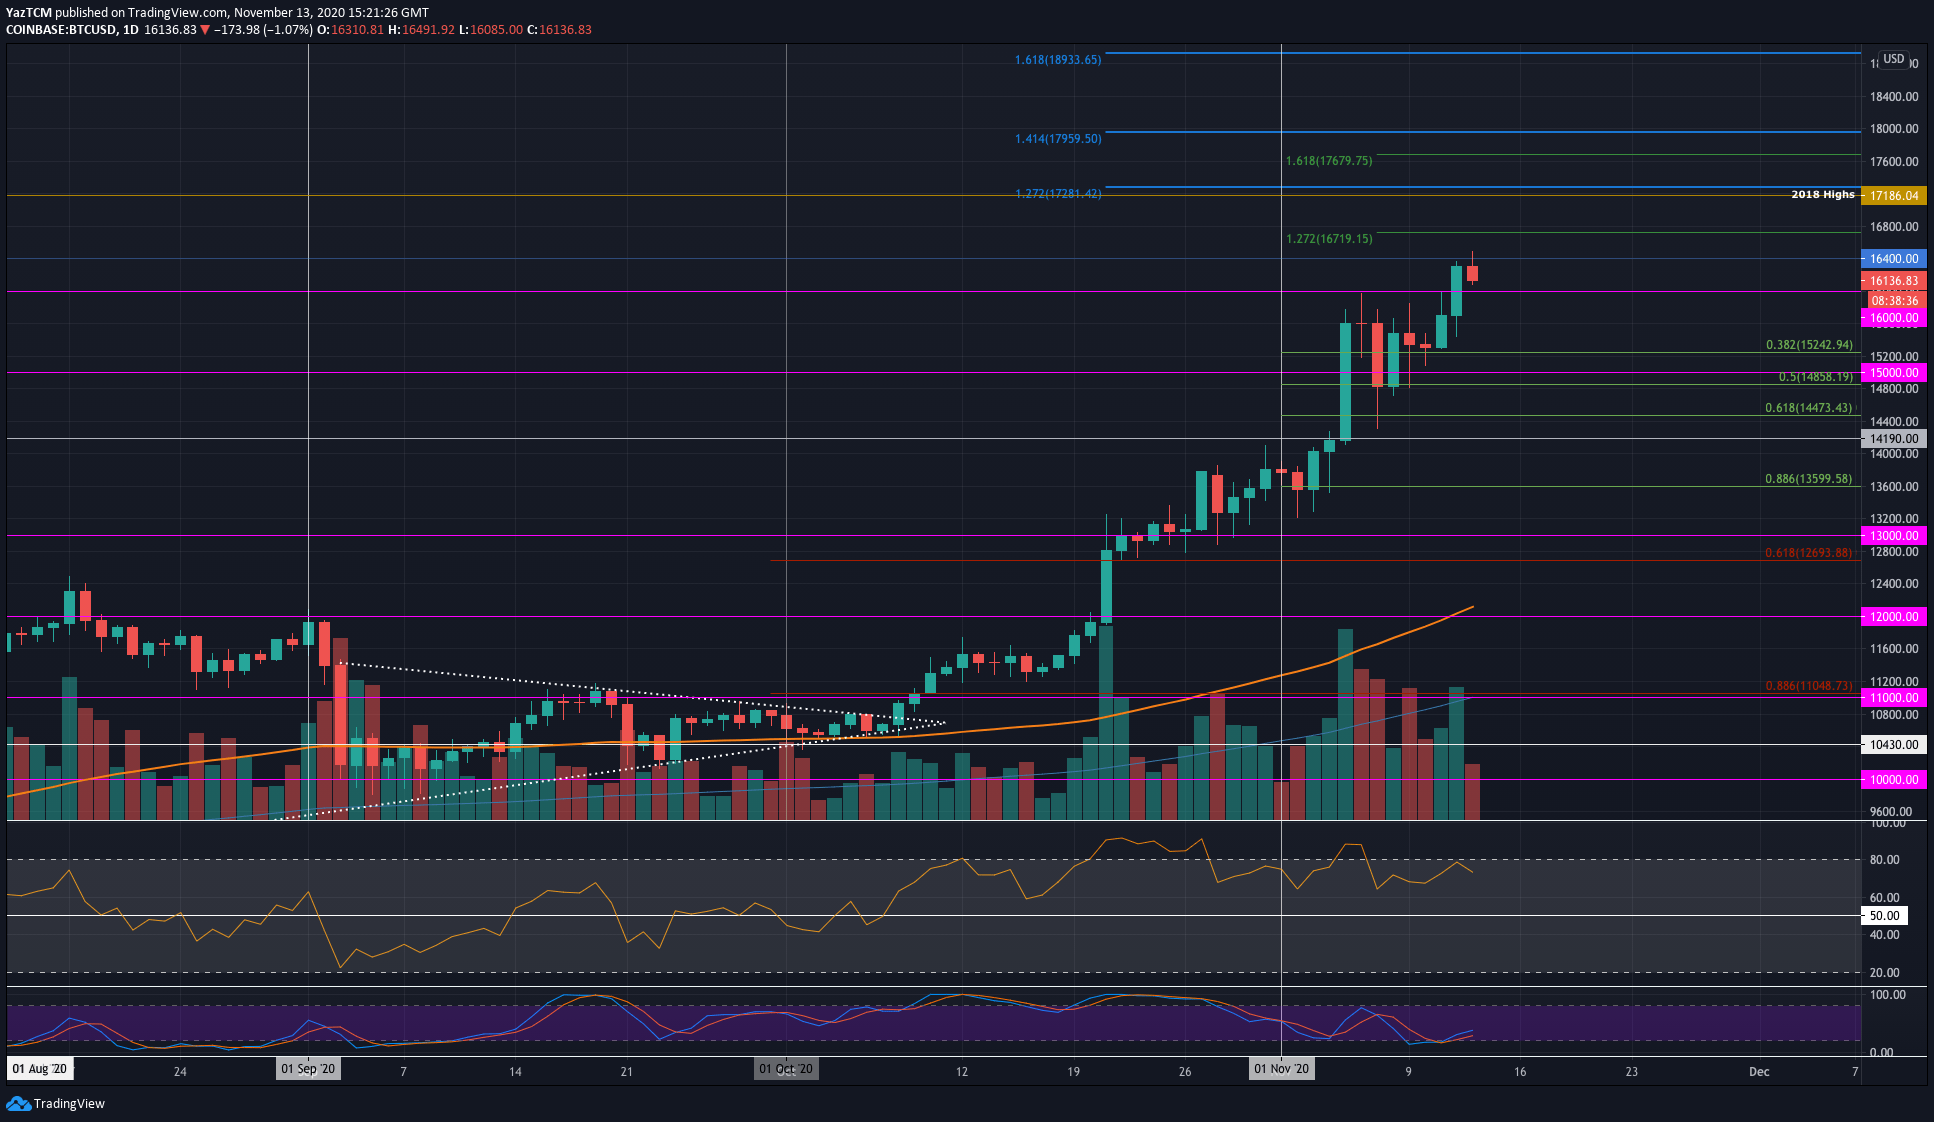
Bitcoin saw another 4% price hike this week, which had it breaking above the $16,000 level to reach as high as $16,491 today. The coin has since dropped slightly to trade at $16,135 at the time of writing.
Last week, the coin had surged into the $16,000 level, which caused it to roll over and drop into the $14,850 support last Saturday. Bitcoin managed to rebound higher from there as it started to climb on Sunday. The coin did not return to $16,000 until Wednesday, and it surged above the resistance yesterday to reach as high as $16,400.
Looking ahead, if the buyers manage to break $16,400 again, the first level of higher resistance lies at $16,720 (1.272 Fib Extension). Following this, resistance lies at $16,800, $17,000, and $17,186 (2018 Highs). Additional resistance lies at $17,500, $17,680, and $18,000.
On the other side, the first level of support lies at $16,000. Beneath this, support is expected at $15,5500, $15,242 (.382 Fib), $15,000, and $14,858 (.5 Fib).
Ethereum
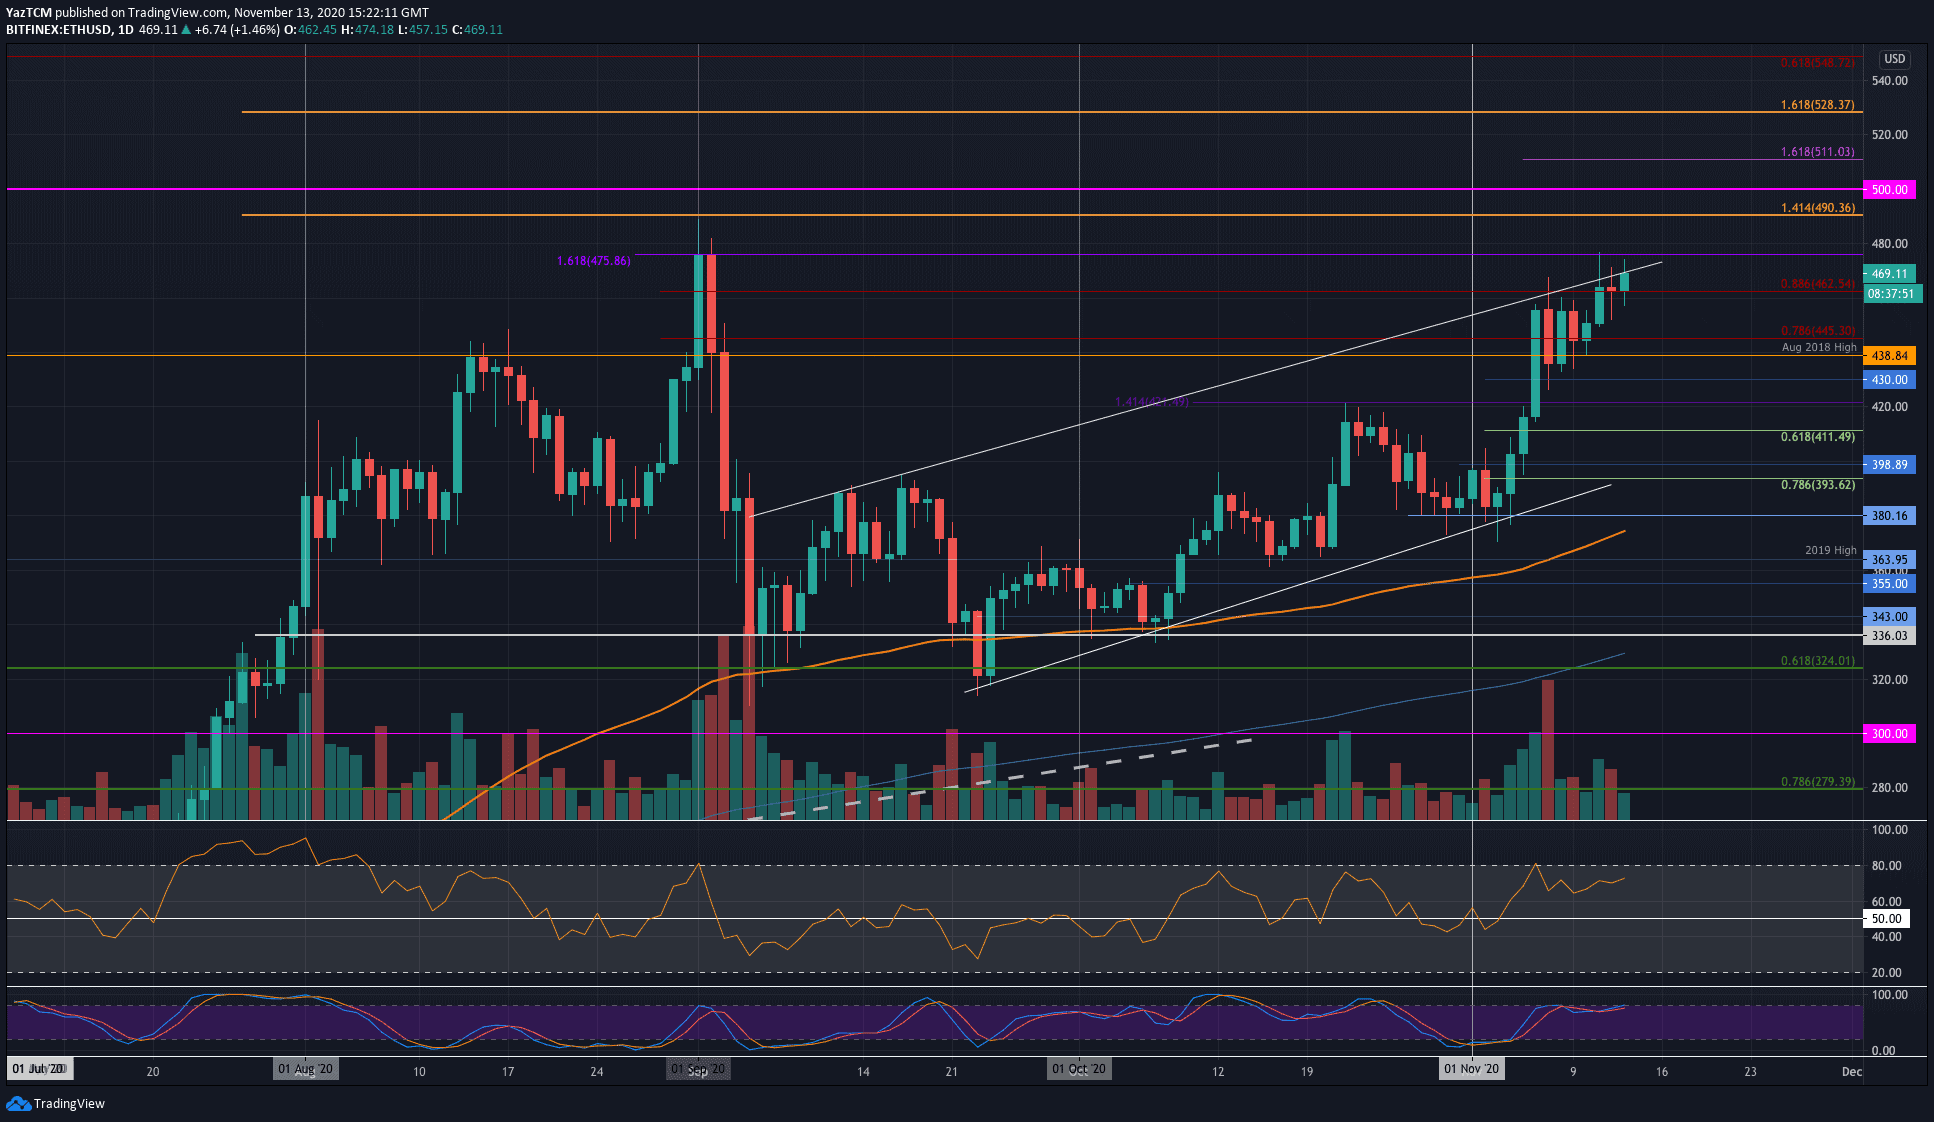
Ethereum saw a much stronger 13% price surge over the last week of trading, as the cryptocurrency approaches the $470 level today. The coin surged from $420 to reach as high as $456 last Friday. The coin struggled to break the resistance at $456 over the weekend and only managed to penetrate above it on Wednesday.
After breaking $456, ETH went on to breach the resistance at $462.50 (bearish .886 Fib Retracement) and spike as high as $475 (September high-day close). It was unable to maintain this high and dropped slightly in the $462.50 support.
Today, ETH climbed higher to reach the resistance at the upper boundary of the rising price channel.
Looking ahead, if the buyers can break the upper boundary of the price channel, the first level of resistance lies at $475 (September highday close). Above this, resistance is expected at $490, $500, and $511.
On the other side, if the sellers push lower, the first level of support lies at $462.50. Beneath this, support is expected at $456, $445, and $438 (August 2018 High). Additional support lies at $430, $421, and $410.
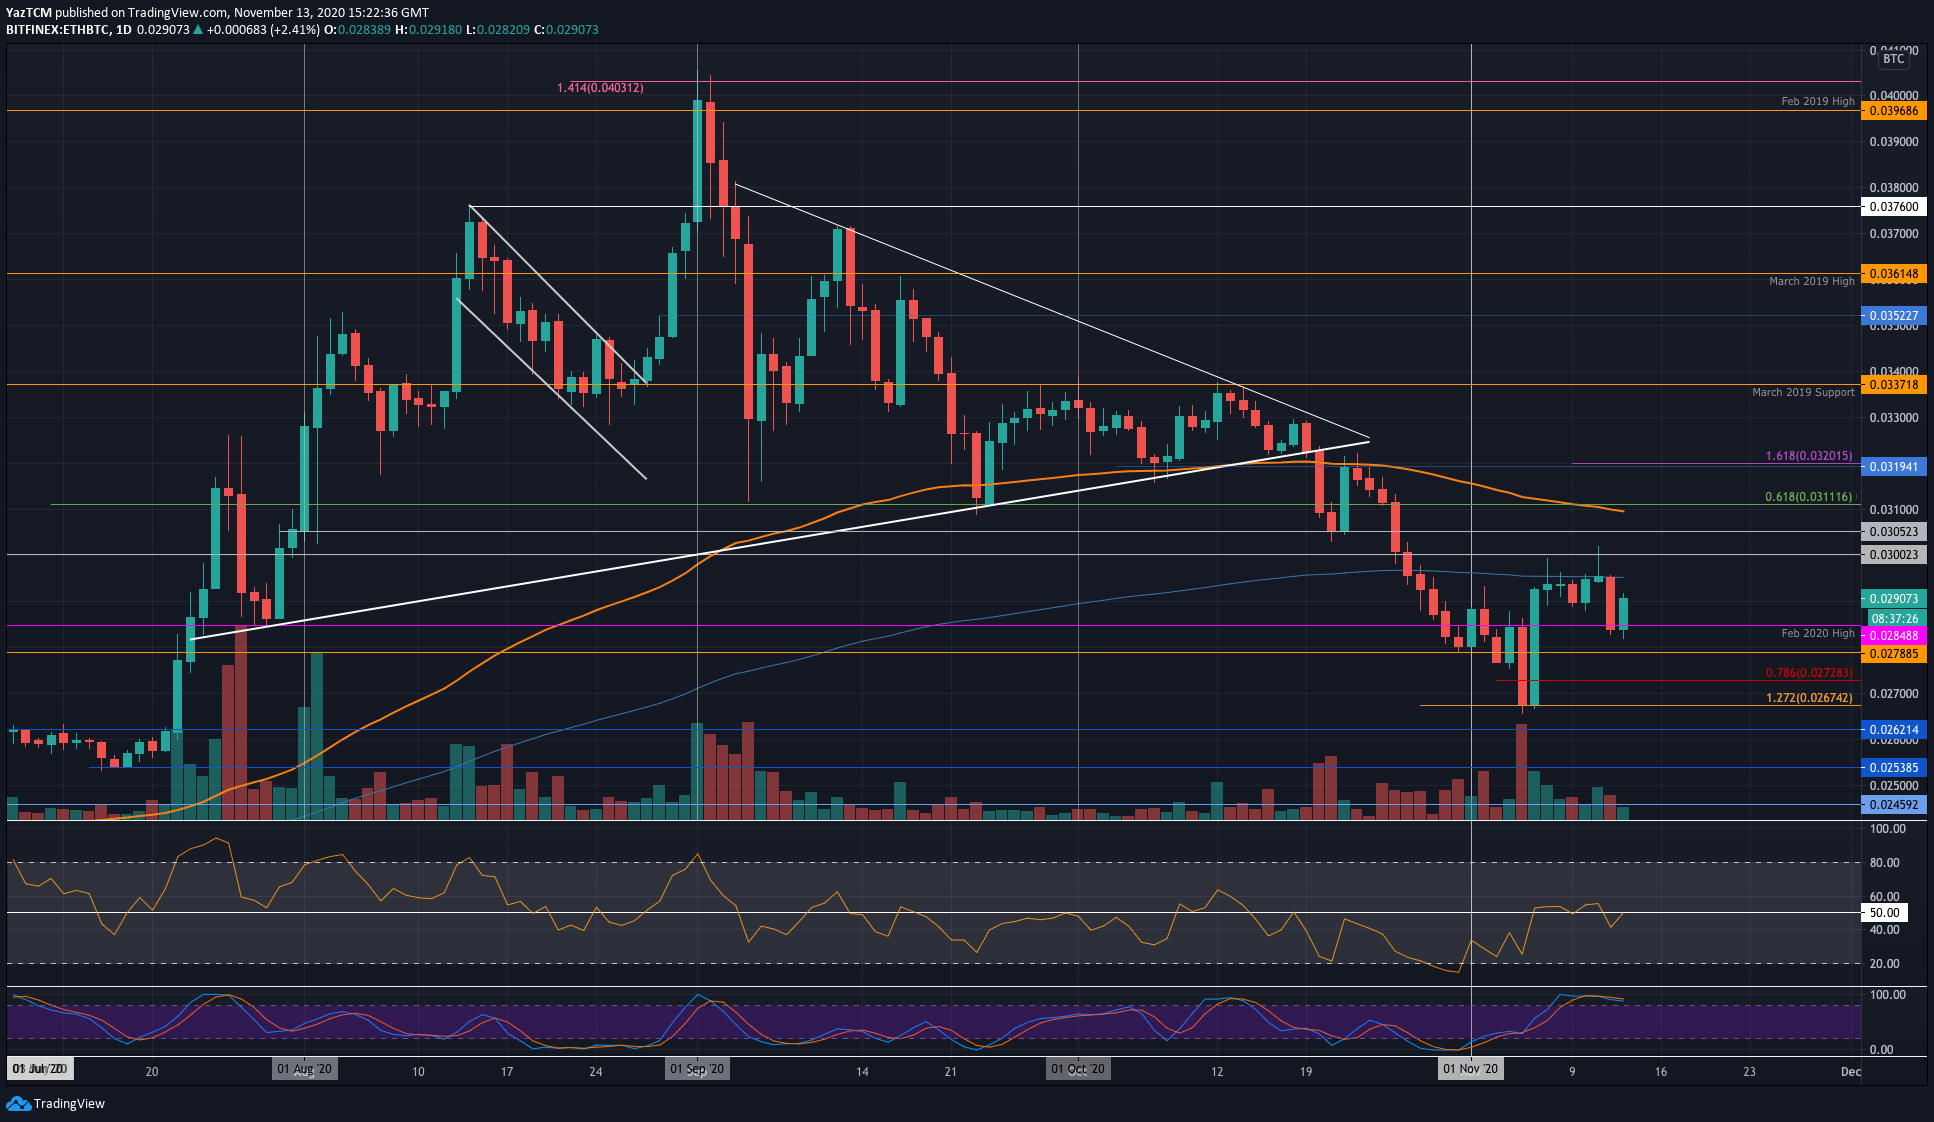
Against Bitcoin, Ethereum was trading at the 200-days EMA last Friday. The coin made multiple attempts to break this resistance at 0.0295 BTC over the course of the week but failed each time. This led to ETH rolling over yesterday as it dropped into the 0.0284 BTC support (Feb 2020 Highs).
The coin bounced higher from this support today to reach 0.029 BTC but still must break the 200-days EMA resistance ahead.
Moving forward, the first level of resistance lies at 0.0295 BTC (200-days EMA). Above this, resistance lies at 0.03 BTC, 0.0305 BTC, and 0.031 BTC (100-days EMA).
On the other side, the first level of support lies at 0.0284 BTC (Feb 2020 High). Beneath this, support is found at 0.0278 BTC, 0.0272 BTC, and 0.0267 BTC (November lows).
Ripple
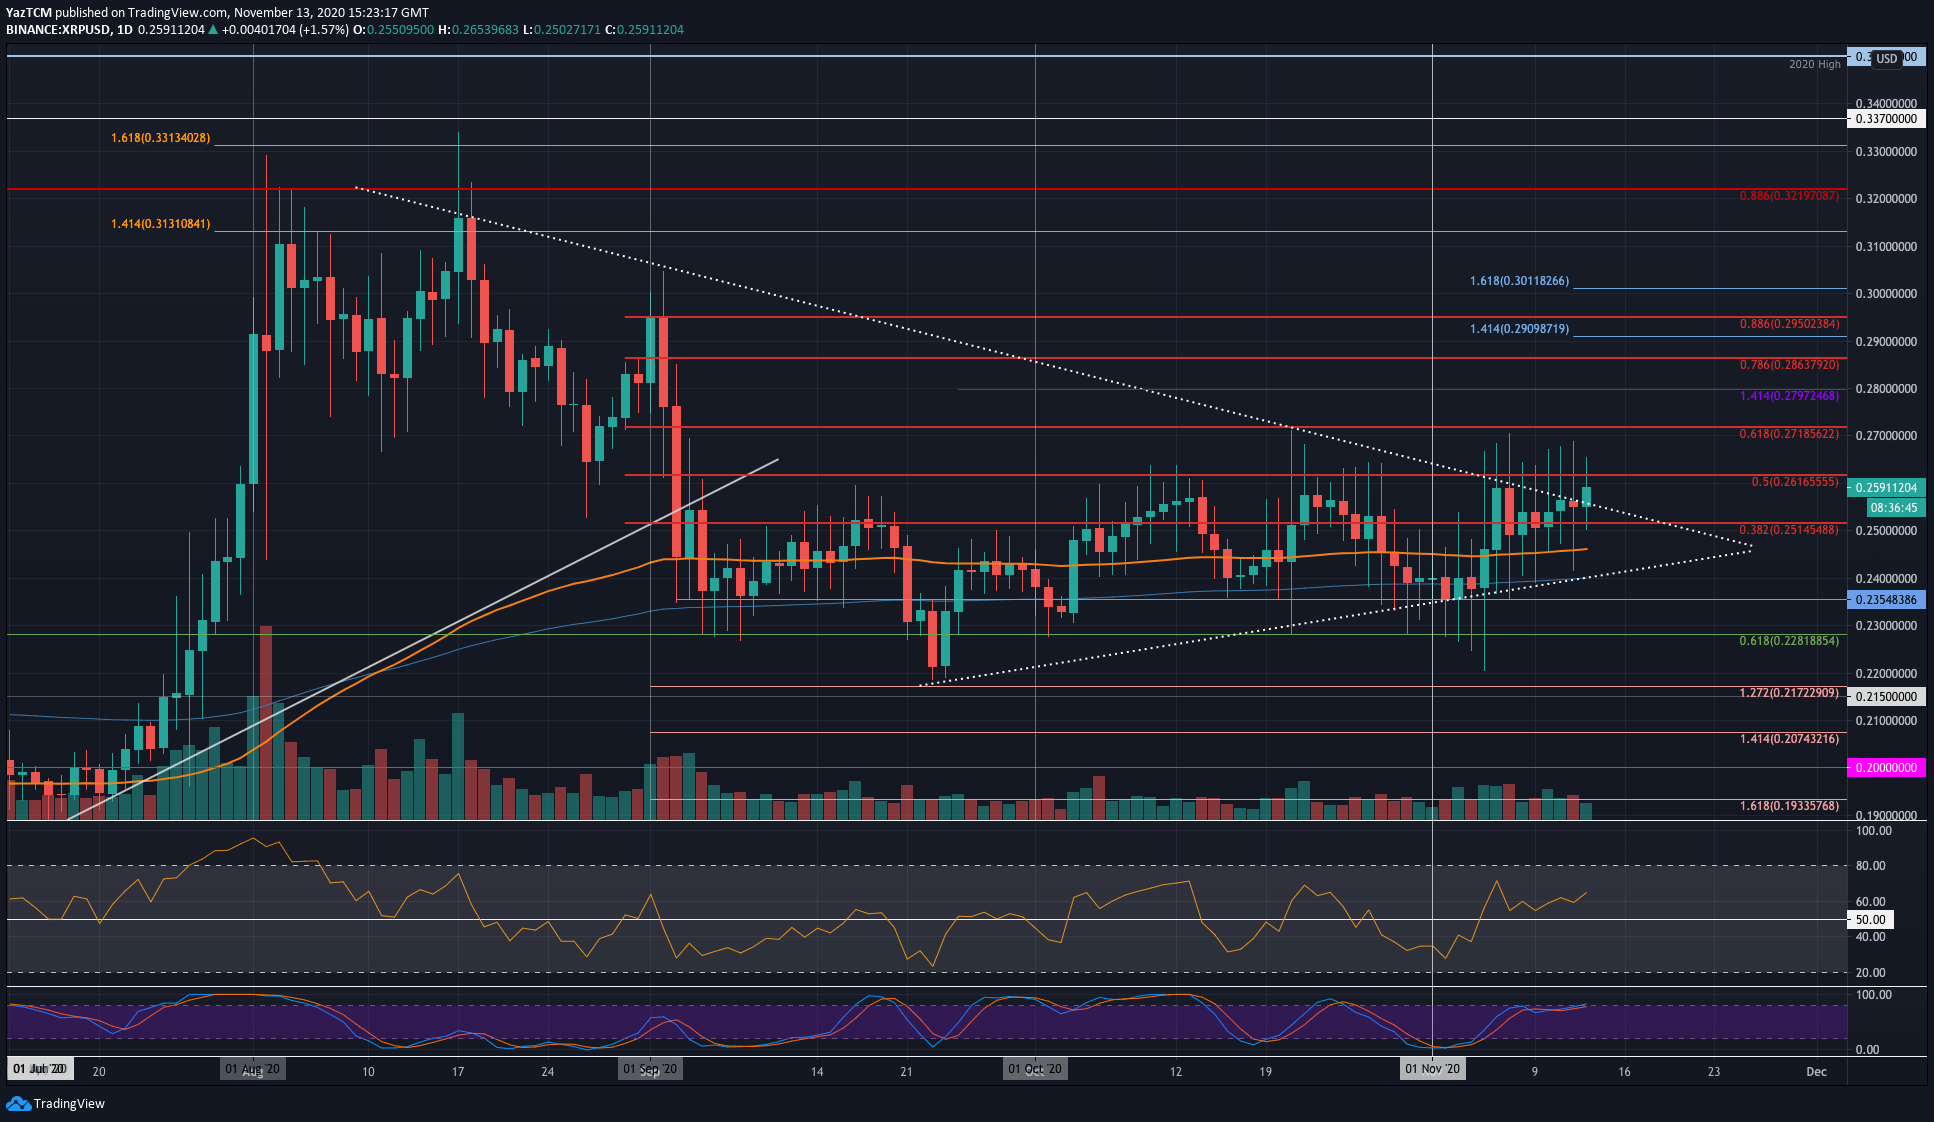
XRP managed to outperform Bitcoin this week as it increased by 5.7% over the past seven days. Despite this price hike, XRP remains within the 2-month trading range between $0.261 and $0.228 and must break one of these boundaries to dictate the market’s next direction.
Looking ahead, if the buyers can break the resistance at the $0.261 level (bearish .5 Fib Retracement), higher resistance is located at $0.271 (bearish .618 Fib), $0.28, and $0.286 (bearish .786 Fib Retracement).
On the other side, the first level of support lies at $0.25. Beneath this, support is expected at $0.245 (100-days EMA), $0.24 (200-days EMA), $0.235, and $0.228 (.618 Fib Retracement).
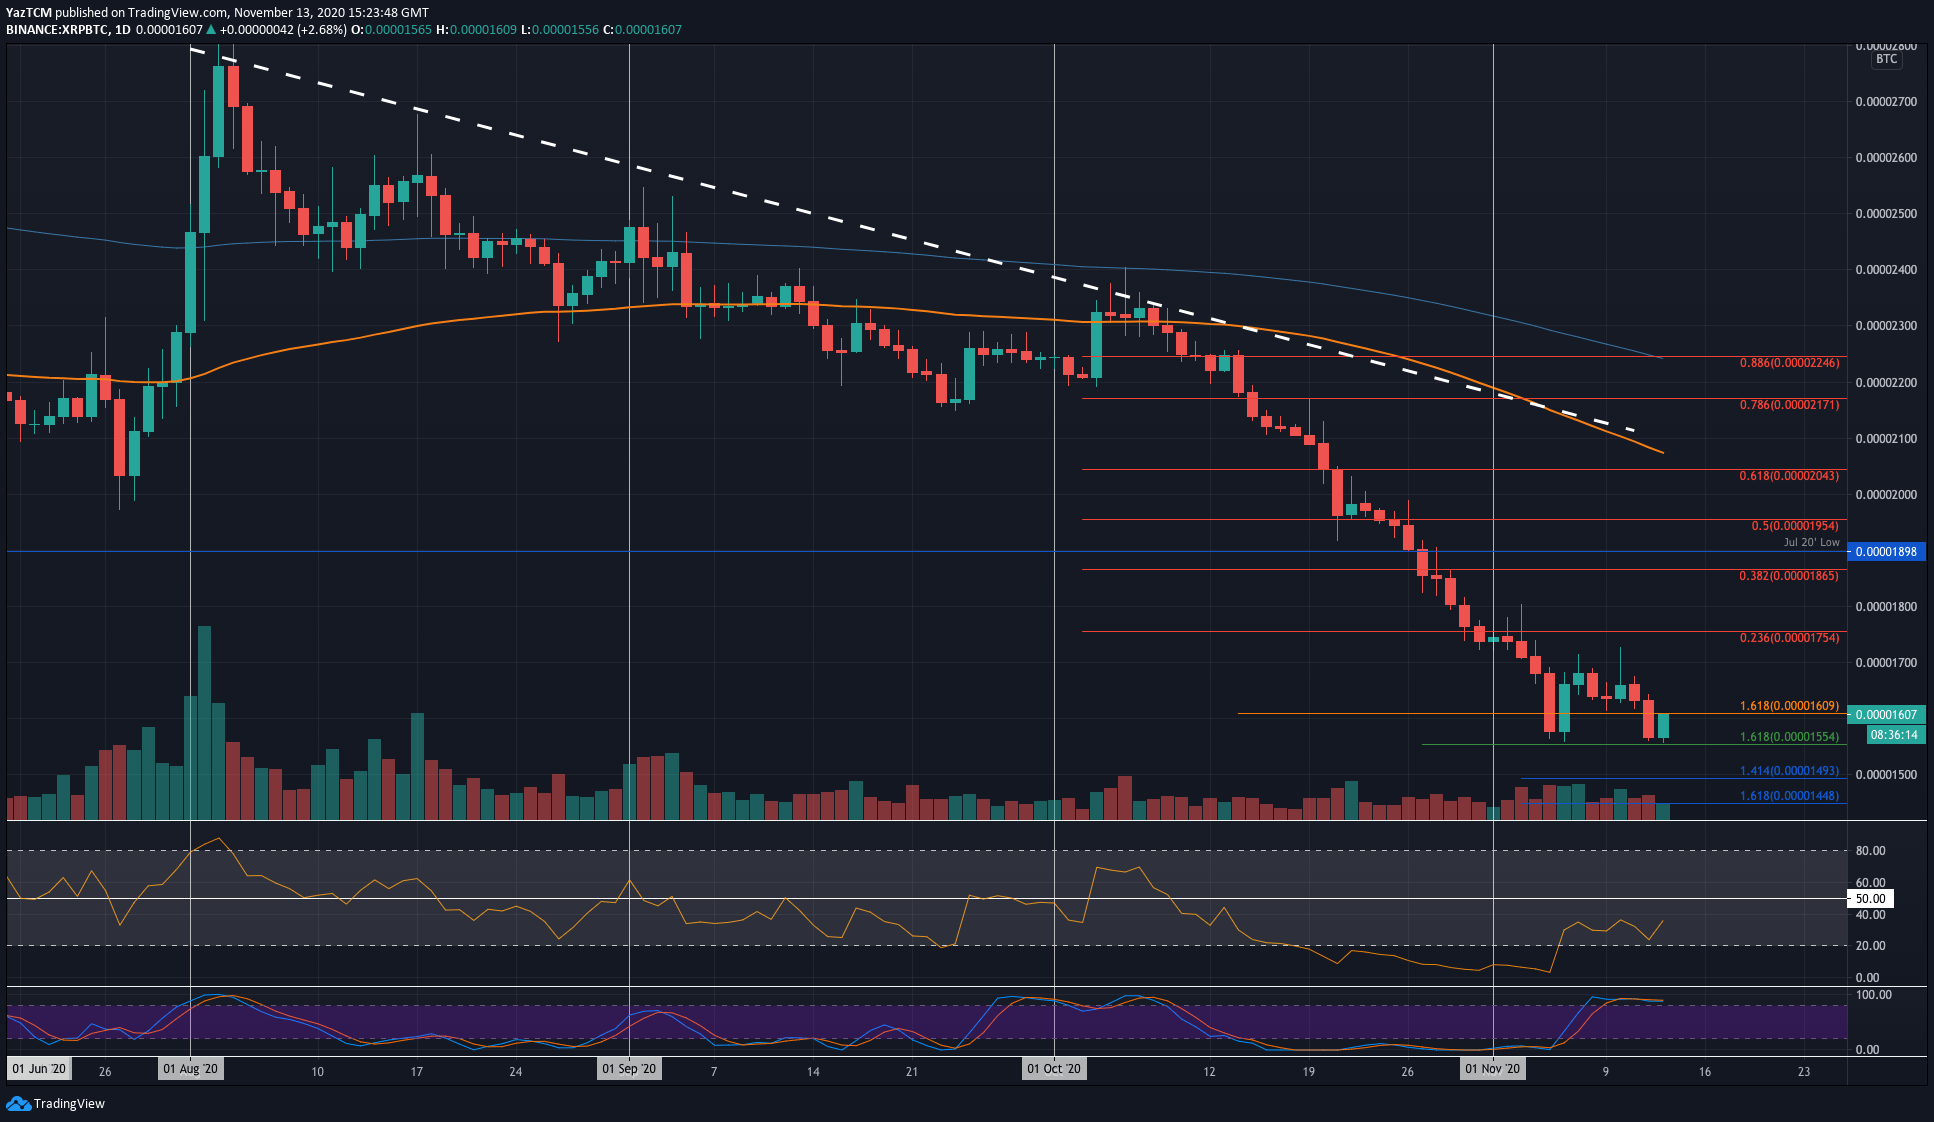
Against BTC, XRP continues to struggle as it trades at 3-year lows. The coin failed to break the resistance at 1700 SAT last Friday, which saw it falling over the course of the week. Yesterday, XRP fell beneath the support at 1610 SAT and dropped back into the November lows at 1555 SAT.
It has bounced slightly from there to hit 1600 SAT today. However, the outlook remains extremely bearish.
Moving forward, if the sellers break beneath 1600 SAT again, the first level of support lies at 1555 SAT. Beneath 1500 SAT, added support is found at 1493 SAT, 1450 SAT, and 1400 SAT.
On the other side, the first level of resistance lies at 1610 SAT. Above this, resistance is expected at 1700 ST, 1755 SAT (bearish .236 Fib), and 1800 SAT.
Chainlink
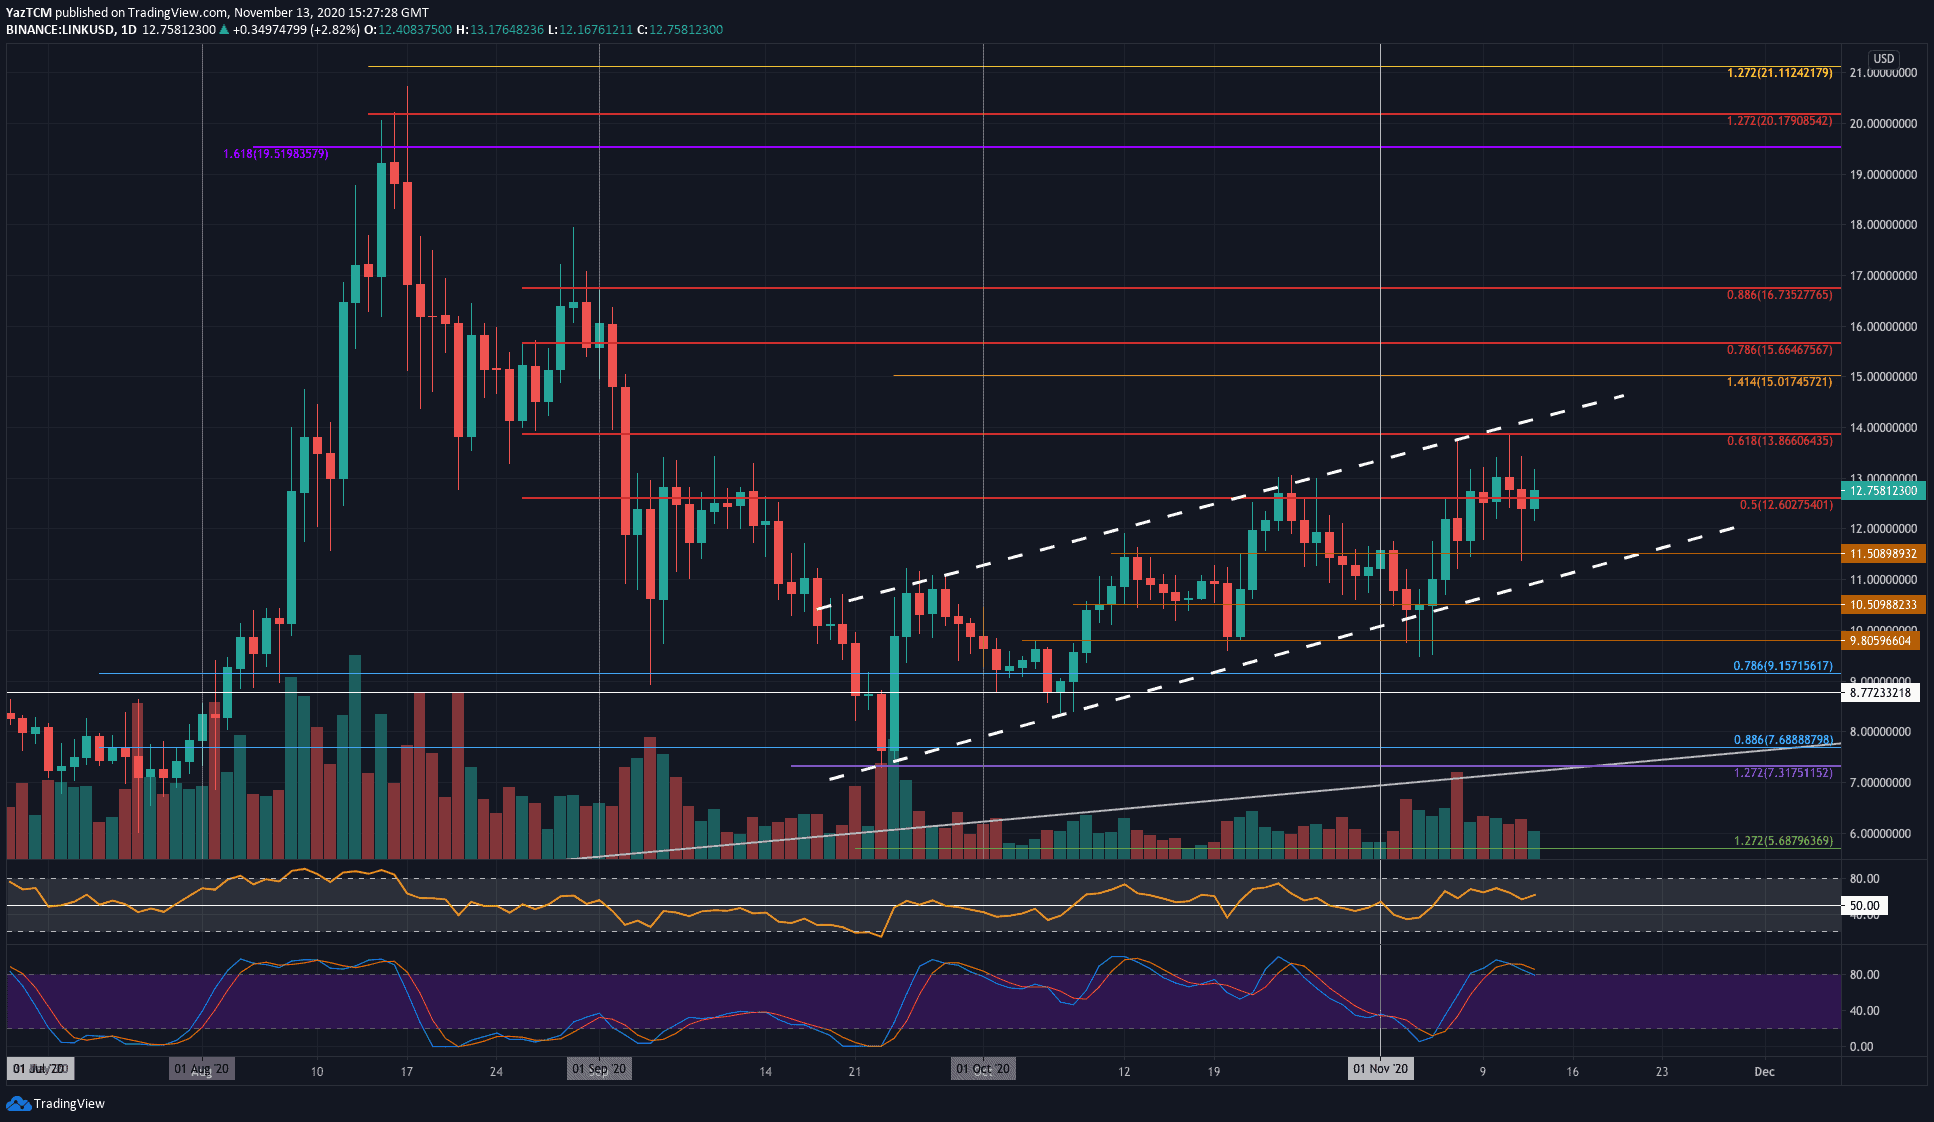
Chainlink saw a very robust 16.1% price explosion over the last week of trading as it hits the $12.75 level today. The cryptocurrency was trading at $11 last Friday as it started to push higher. The coin continued to slowly grind higher until it hit the resistance at $13 on Wednesday.
The coin is currently trading within a rising price channel, and it was able to spike as high as the upper boundary of this price channel at $13.86 (bearish .618 Fib Retracement) during the week. It has since dropped lower but managed to rebound from $11.50 yesterday.
Moving forward, if the buyers continue higher, the first level of resistance is expected at $13. Above this, resistance lies at $13.86 (bearish .618 Fib Retracement), the upper boundary of the price channel, and $15 (1.414 Fib Extension). Added resistance is found at $15.66 (bearish .786 Fib) and $16.
On the other side, support is first located at $12. Beneath this, additional support is found at $11.50, $11, the channel’s lower boundary, and $10.50.
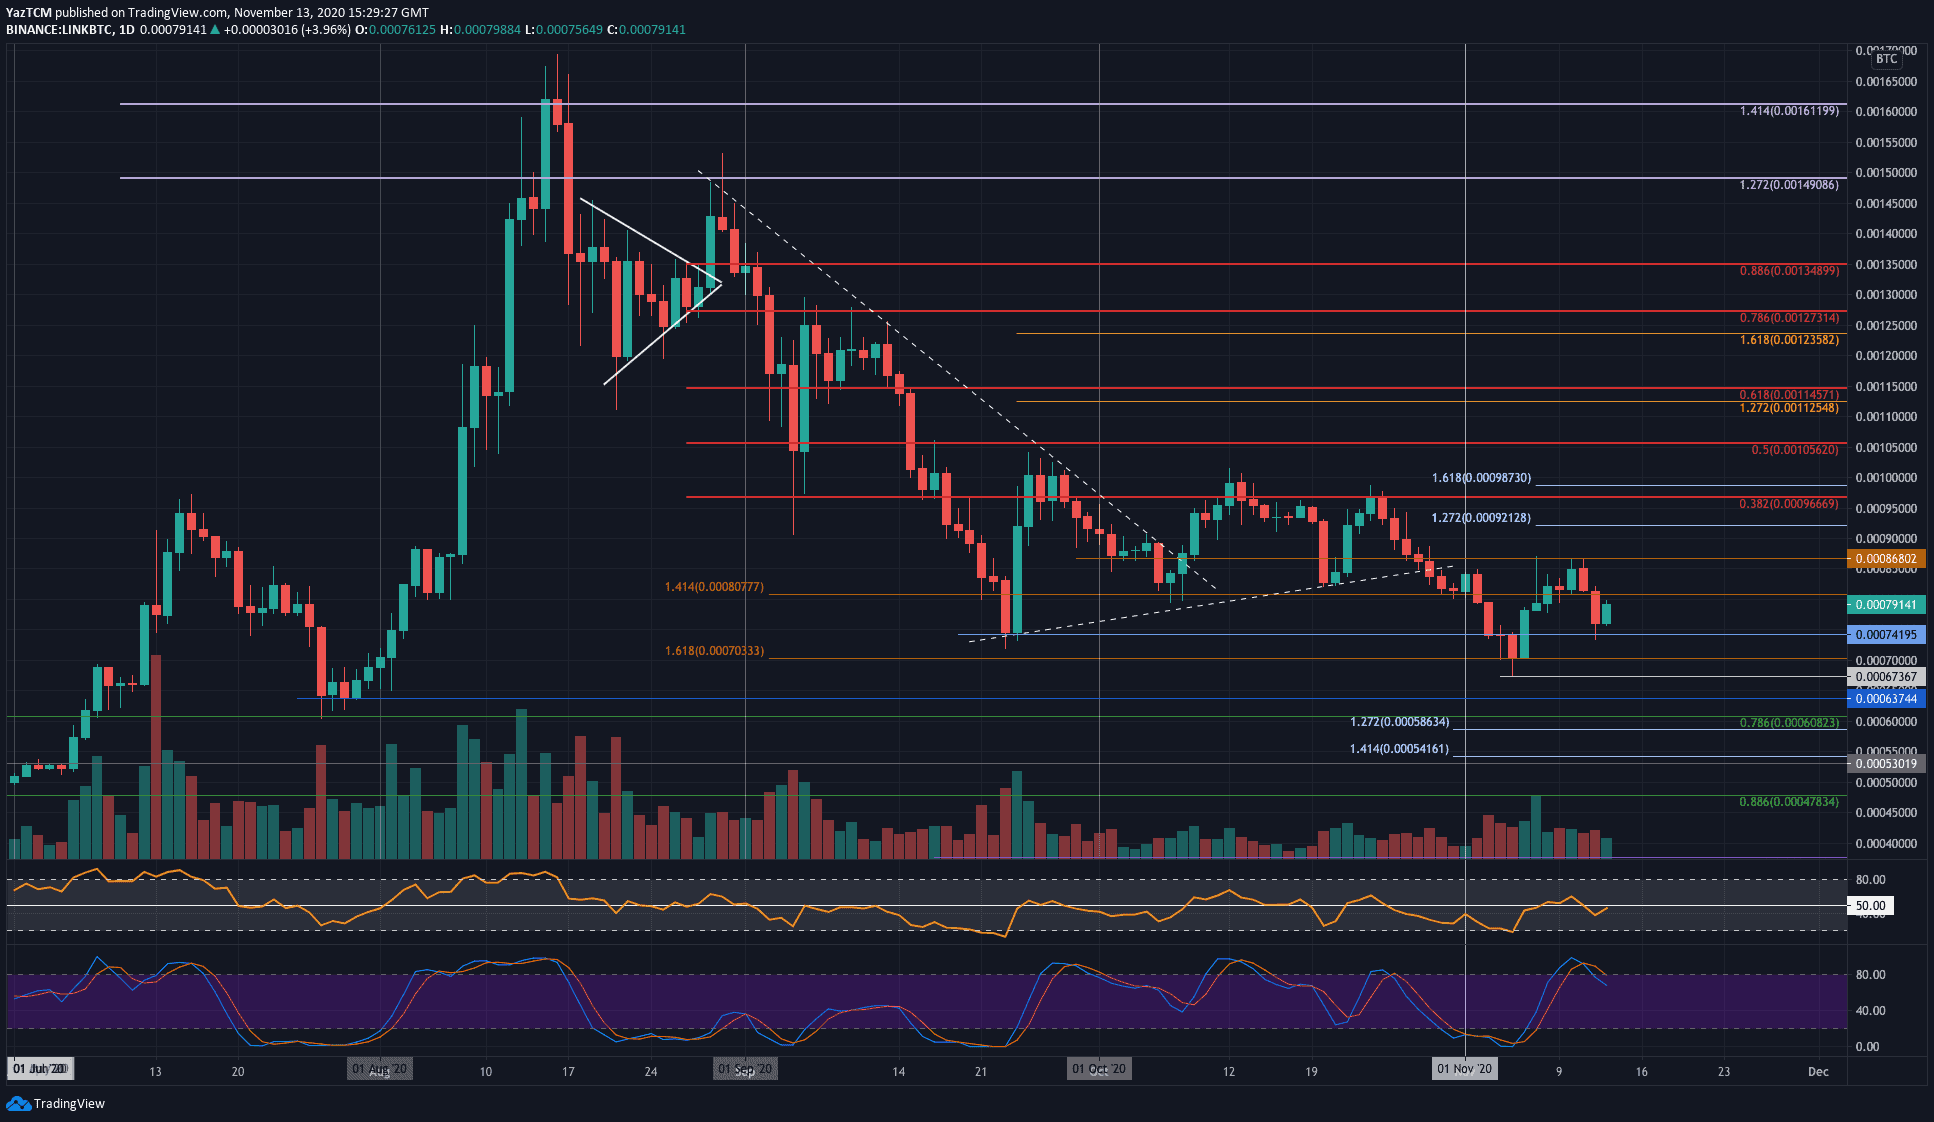
Against Bitcoin, LINK was trading at 3-month lows last Friday as it bounced from the 70,000 SAT support. From there, it managed to push higher throughout the week to reach as high as 86,800 SAT.
It was unable to maintain this high as it dropped as low as 74,100 SAT yesterday. It has since rebounded to trade at 79,100 SAT today.
Looking ahead, if the buyers push back above 80,000 SAT, the first level of resistance is located at 86,800 SAT. Above this, resistance lies at 90,000 SAT, 92,120 SAT (1.272 Fib Extension), and 96,670 (bearish .382 Fib Retracement).
On the other side, the first level of support lies at 74,200 SAT. Beneath this, support lies at 70,000 SAT, 67,367 SAT (November lows), and 63,745 SAT.
Cardano
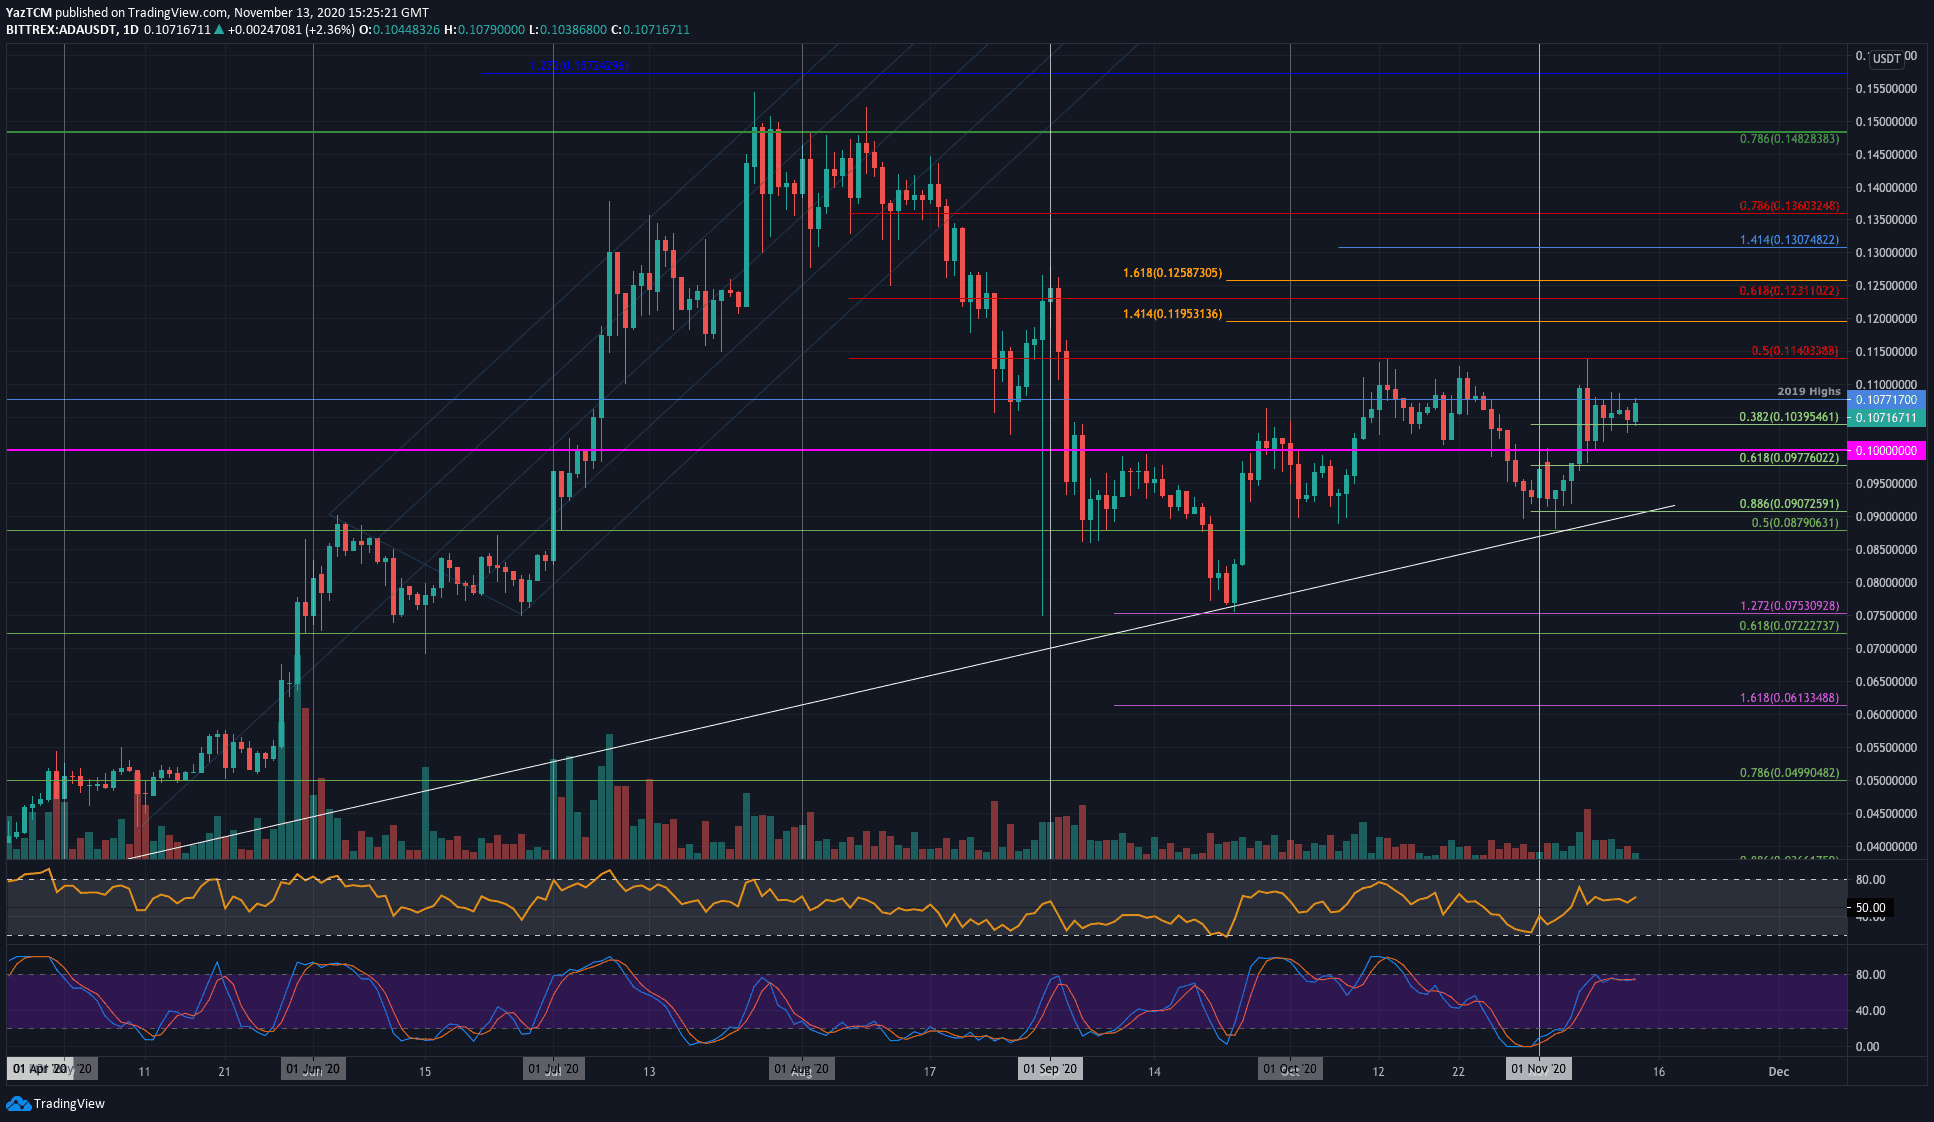
Cardano saw a small 9.3% price hike this week but still managed to outperform Bitcoin and XRP. The coin was trading at $0.0977 last Friday as it started to push higher. It managed to spike as high as $0.114 (bearish .5 Fib Retracement) over the weekend but could not sustain this high.
Throughout the week, ADA has been battling with the resistance at $0.107, provided by the 2019 Highs. It has managed to remain support at $0.103 (.382 Fib) over the past five days.
Looking ahead, if the bulls can break the 2019 highs at $0.107, the first level of resistance lies at $0.11. Above this, resistance is found at $0.114 (bearish .5 Fib), $0.12, and $0.123 (bearish .618 Fib).
On the other side, the first level of support lies at $0.103 (.382 Fib). Beneath this, support lies at $0.1, $0.097 (.618 Fib), and 0.095.
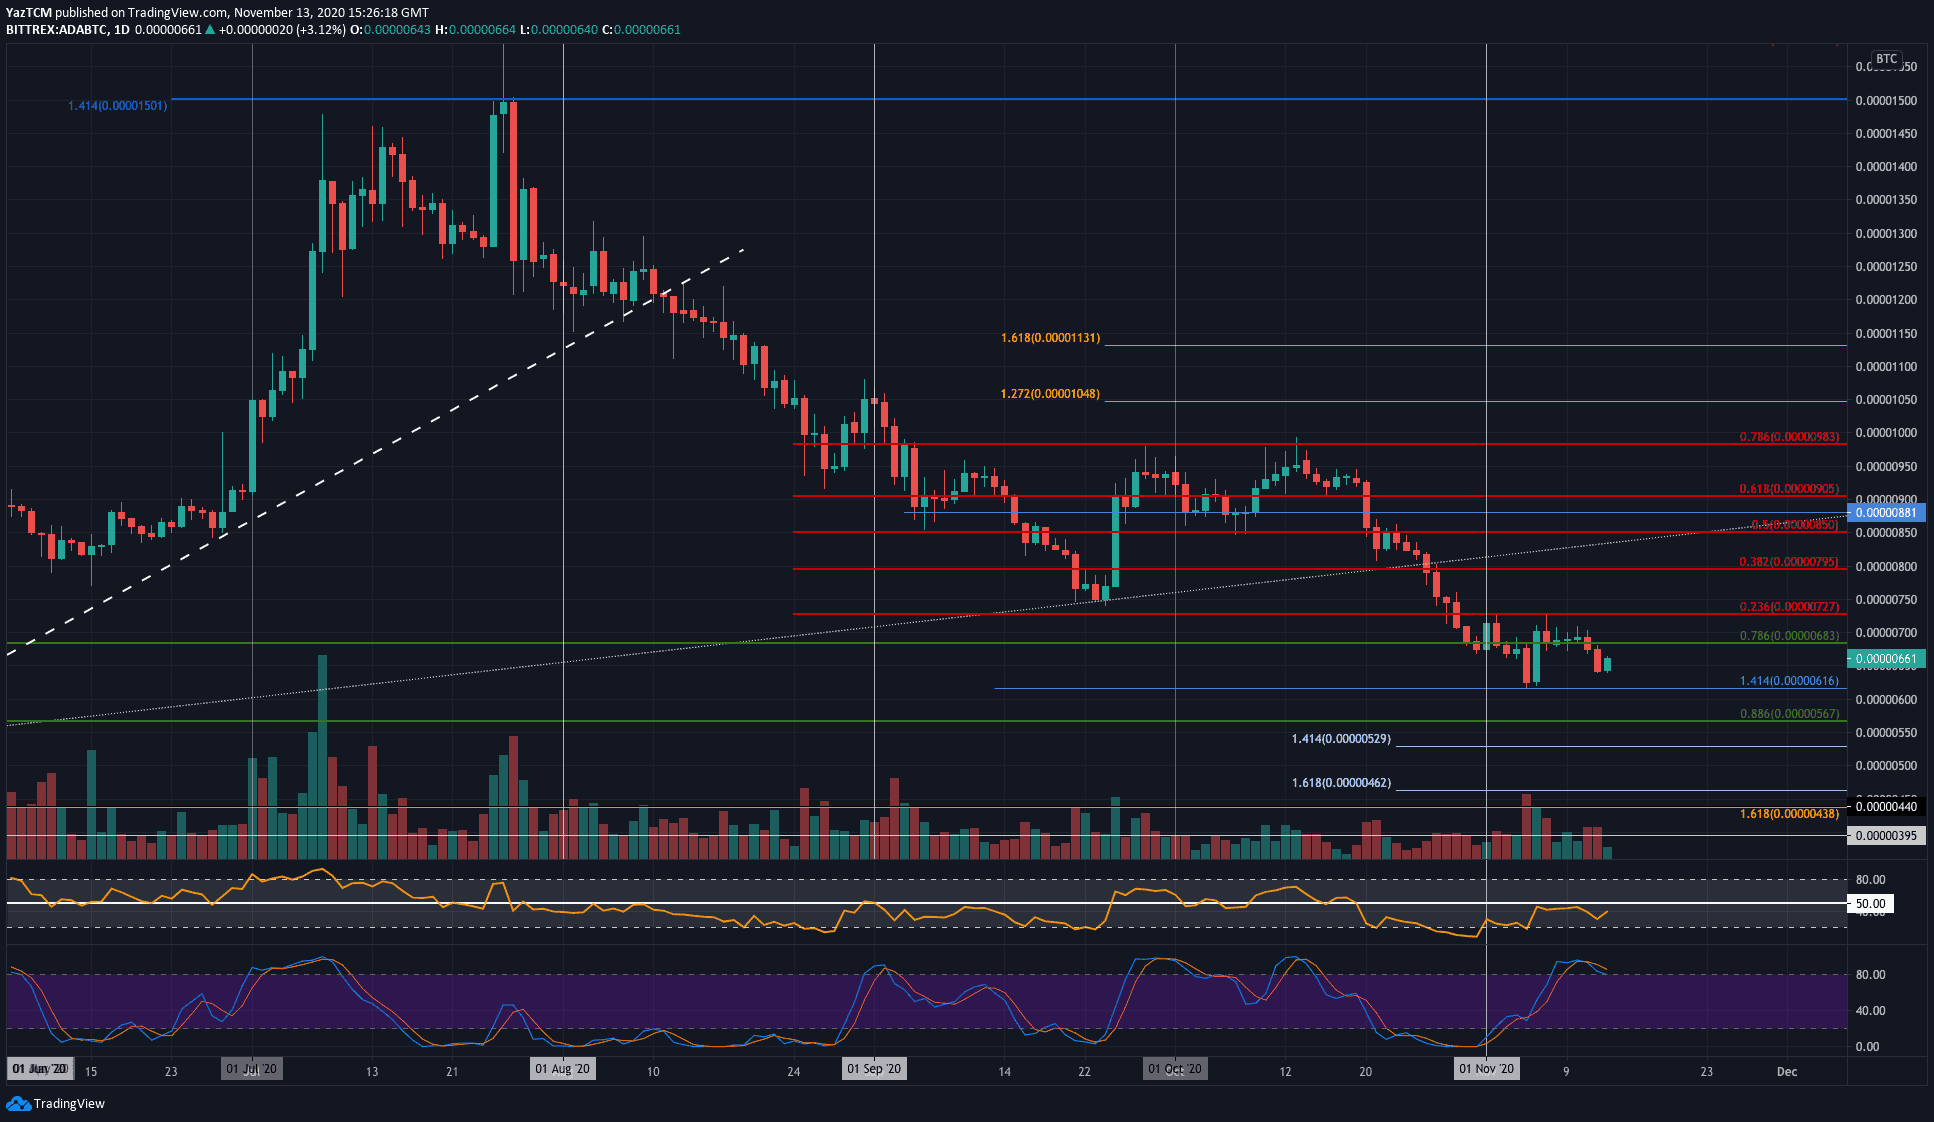
Against Bitcoin, ADA bounced from the support at 616 SAT last Friday and pushed as high as 727 SAT (bearish .236 Fib) on Saturday. Throughout the week, ADA started to head lower and penetrated beneath 650 SAT yesterday. It has since bounced slightly higher to trade at 661 SAT today, but the outlook still looks bearish.
Moving forward, if the sellers break beneath 650 SAT again, the first level of support lies at 616 SAT (November lows). Beneath this, support lies at 600 SAT, 567 SAT (.886 Fib), 550 SAT, and 530 SAT.
On the other side, the first level of strong resistance lies at 700 SAT. Above this, resistance lies at 727 SAT (bearish .236 Fib), 750 SAT, and 800 SAT.