BitcoinOver the past seven days, Bitcoin dropped by a total of 2% as it currently trades around the ,500 level. The week was pretty interesting after it rebounded from a 6-month-old rising trend line last week. After bouncing, it continued higher to reach as high as ,900 at the start of October.Unfortunately, Bitcoin failed to break resistance at a falling trend line, and it rolled over yesterday to drop back into the support at a long-term rising trend line. These two trend lines together form somewhat of a symmetrical triangle pattern.Today, Bitcoin did spike beneath the rising trend line, but the buyers have since regrouped to bring BTC back above it and above the 100-days EMA to trade at ,535.Looking ahead, if the buyers continue to drive higher, the first level of resistance
Topics:
Yaz Sheikh considers the following as important: Binance Coin (BNB) Price, Bitcoin (BTC) Price, BNBBTC, bnbusd, btcusd, DOTBTC, DOTUSD, ETH Analysis, ETHBTC, Ethereum (ETH) Price, ethusd, Market Updates, polkadot, Price Analysis, Ripple (XRP) Price, XRP Analysis, xrpbtc, xrpusd
This could be interesting, too:
Chayanika Deka writes XRP, SOL, and ADA Inclusion in US Crypto Reserve Pushes Traders on Edge
Chayanika Deka writes Why Arthur Hayes Is Bullish on Bitcoin Under Trump’s Economic Strategy
Mandy Williams writes Why the Bitcoin Market Is Stuck—and the Key Metric That Could Change It: CryptoQuant CEO
Wayne Jones writes Metaplanet Acquires 156 BTC, Bringing Total Holdings to 2,391
Bitcoin
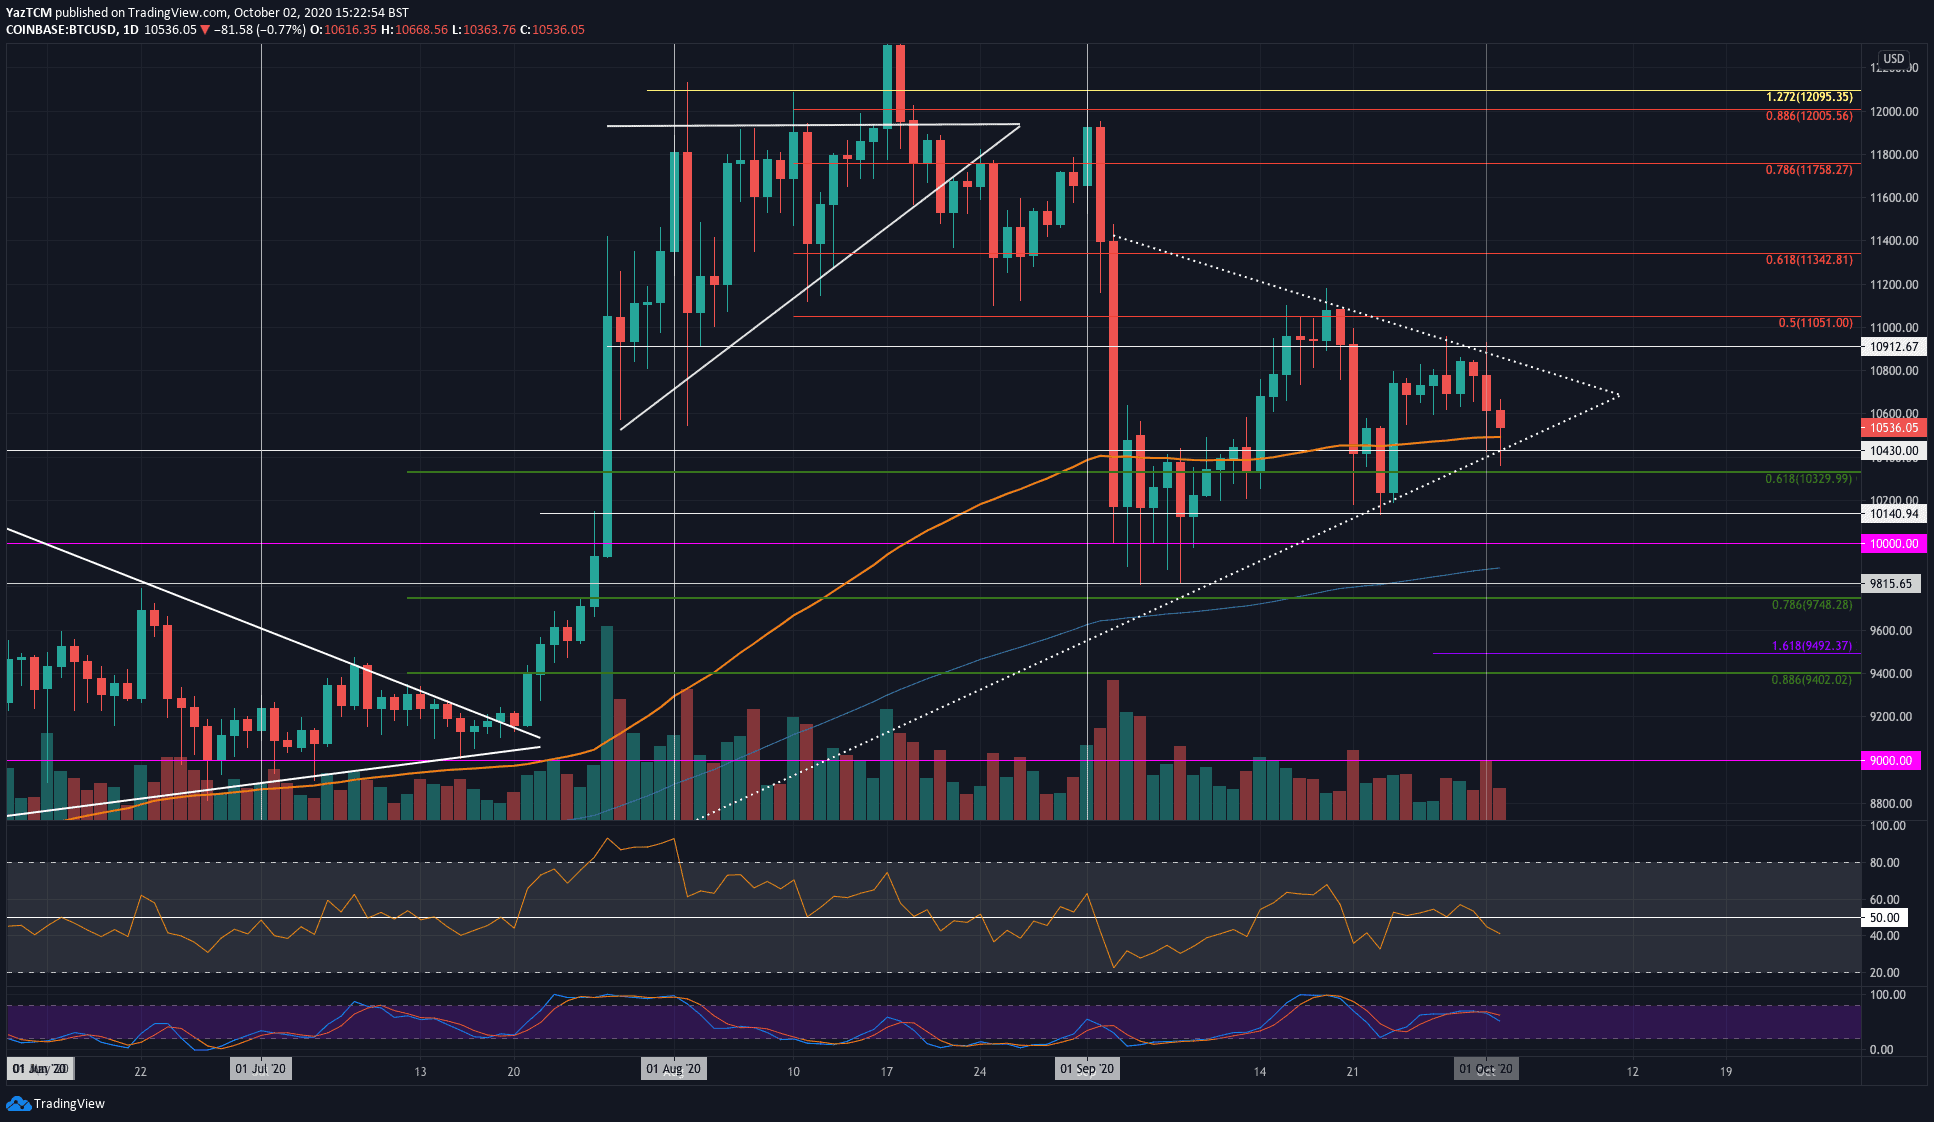
Over the past seven days, Bitcoin dropped by a total of 2% as it currently trades around the $10,500 level. The week was pretty interesting after it rebounded from a 6-month-old rising trend line last week. After bouncing, it continued higher to reach as high as $10,900 at the start of October.
Unfortunately, Bitcoin failed to break resistance at a falling trend line, and it rolled over yesterday to drop back into the support at a long-term rising trend line. These two trend lines together form somewhat of a symmetrical triangle pattern.
Today, Bitcoin did spike beneath the rising trend line, but the buyers have since regrouped to bring BTC back above it and above the 100-days EMA to trade at $10,535.
Looking ahead, if the buyers continue to drive higher, the first level of resistance lies at the upper boundary of the symmetrical triangle pattern. Above this, resistance lies at $10,910, $11,000, and $11,200.
On the other side, the first level of support lies at the 100-days EMA at around $10,500. Following this, support lies at $10,430, the lower boundary of the triangle, and $10,330. Added support is found at $10,140 and $10,000.
Ethereum
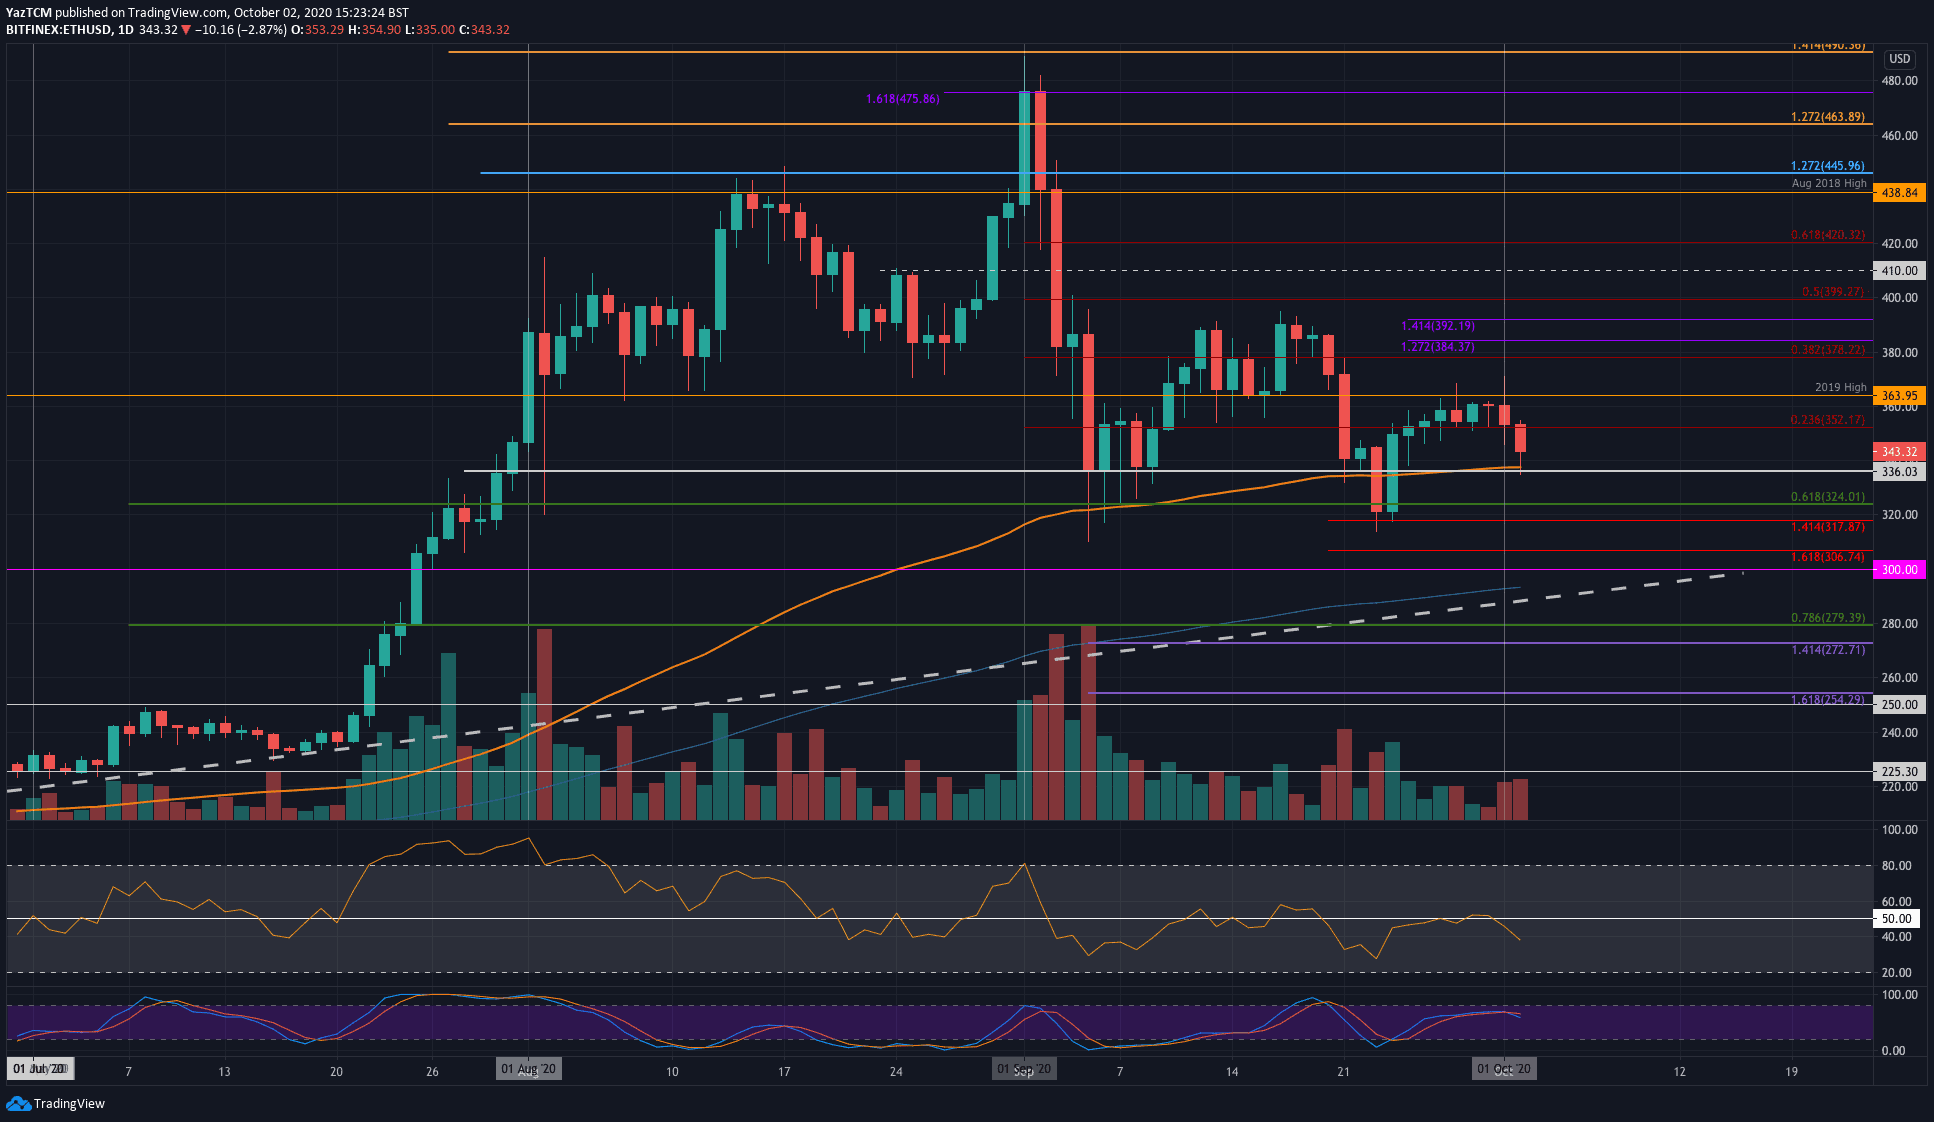
Ethereum saw a smaller 1.5% price drop over the course of the past seven days of trading. Last Friday, Ethereum was trading above the $352 level as it attempted to push higher above the 2018 high at $364 over the weekend.
It failed to close above this level of resistance, which led to Ethereum rolling over yesterday as it continued to fall beneath the $350 support today. The coin found support at the 100-days EMA at around $335 today and has since bounced to trade near $345.
Looking ahead, if the sellers push lower, the first level of support lies at $335 (100-days EMA). Beneath this, support lies at $324, $318, $306, and $300.
On the other side, resistance is first expected at $352. Above this, resistance lies at $364, $3890 (bearish .382 Fib Retracement), $384, $392, and $400.
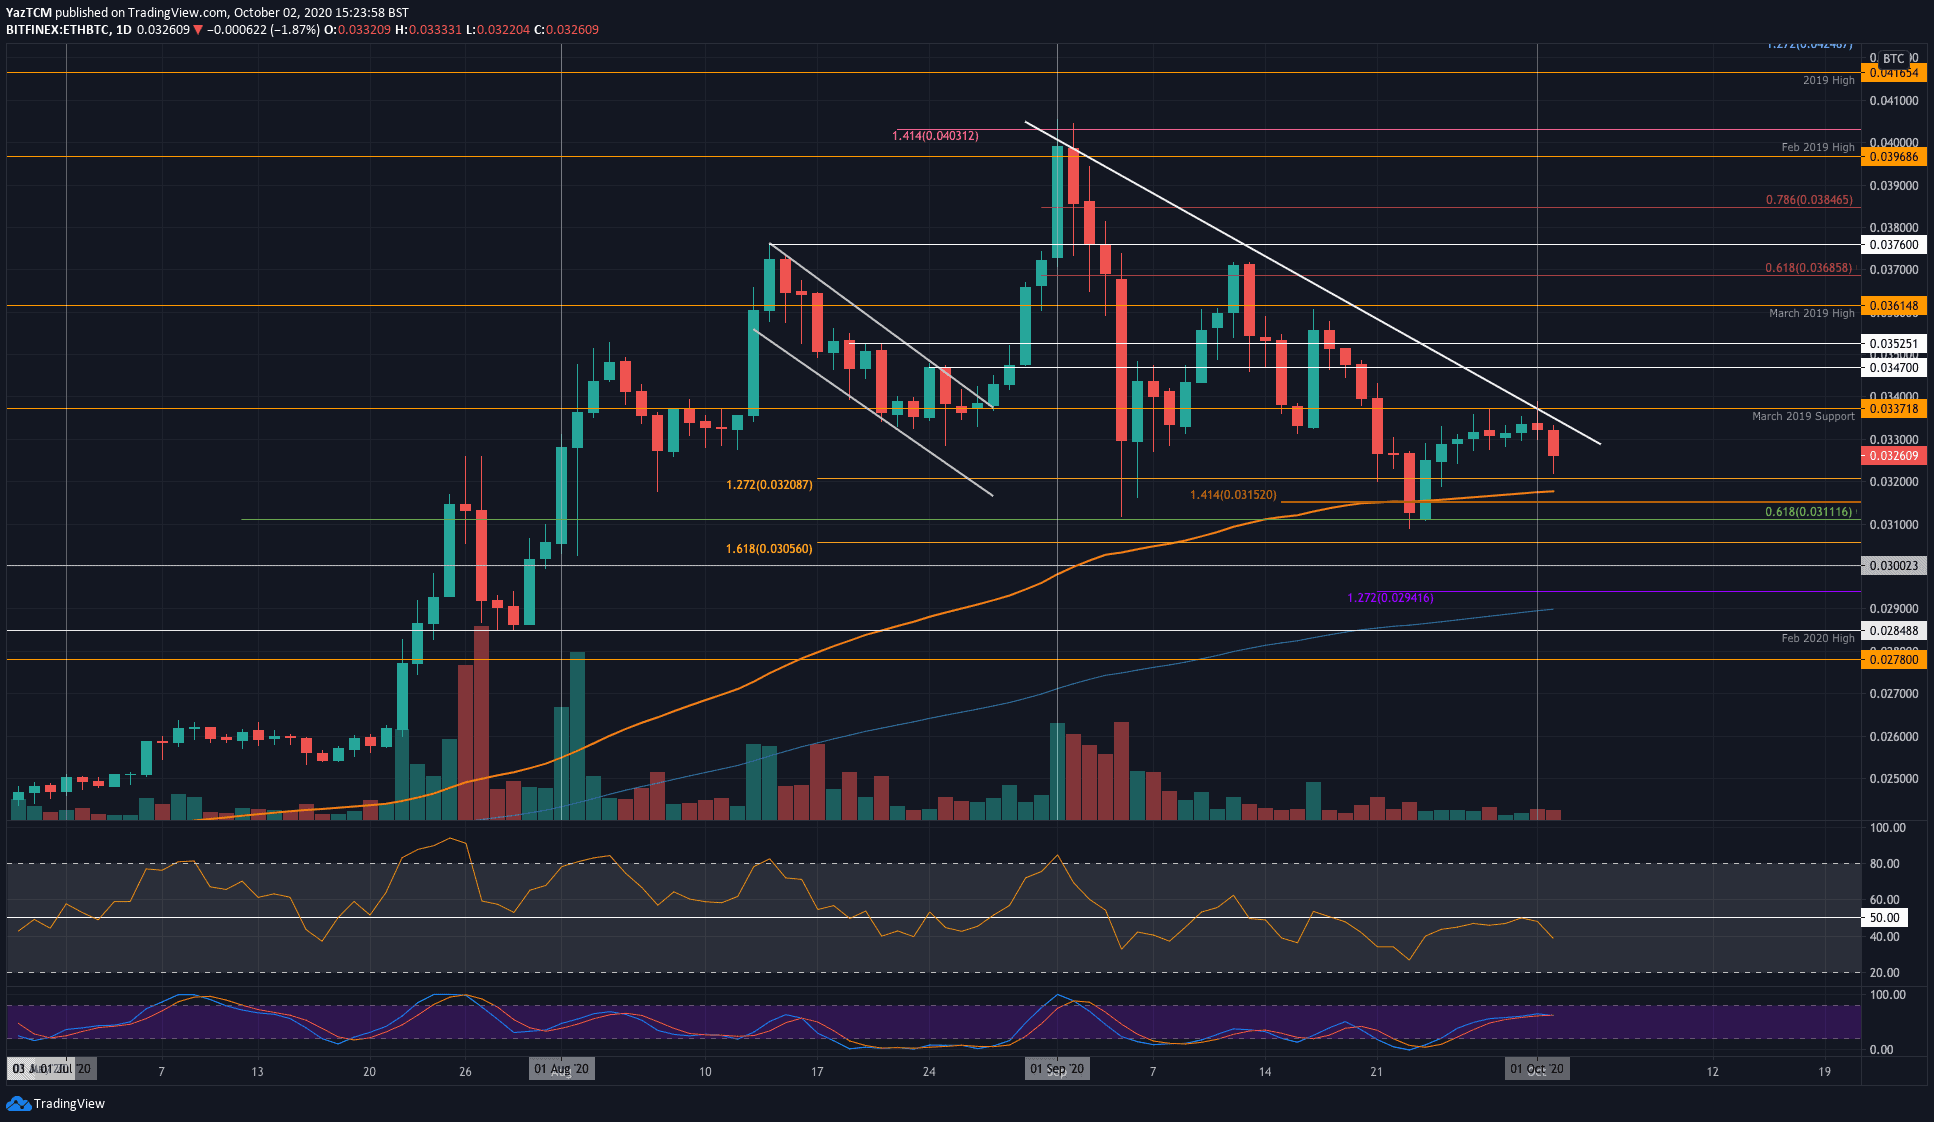
The situation is relatively similar for ETH/BTC. Last week, the coin bounced from the 0.0311 BTC support (.617 Fib) and pushed higher this week as it reached the resistance at 0.0337 BTC (March 2019 Support).
A month-long falling trend line further bolstered this level of resistance. As a result, Ethereum reversed from this resistance and headed lower to reach the current 0.0326 BTC level.
Moving forward, if the sellers continue to drive ETH lower, the first level of support lies at 0.032 BTC. Beneath this, support lies at 0.0315 BTC (100-days EMA), 0.0311 BTC (.618 Fib Retracement), and 0.0305 BTC.
On the other side, resistance is located at 0.033 BTC, where lies the falling trend line. Above this, resistance lies at 0.0337 BTC (March 2019 support), 0.0347 BTC, and 0.0352 BTC.
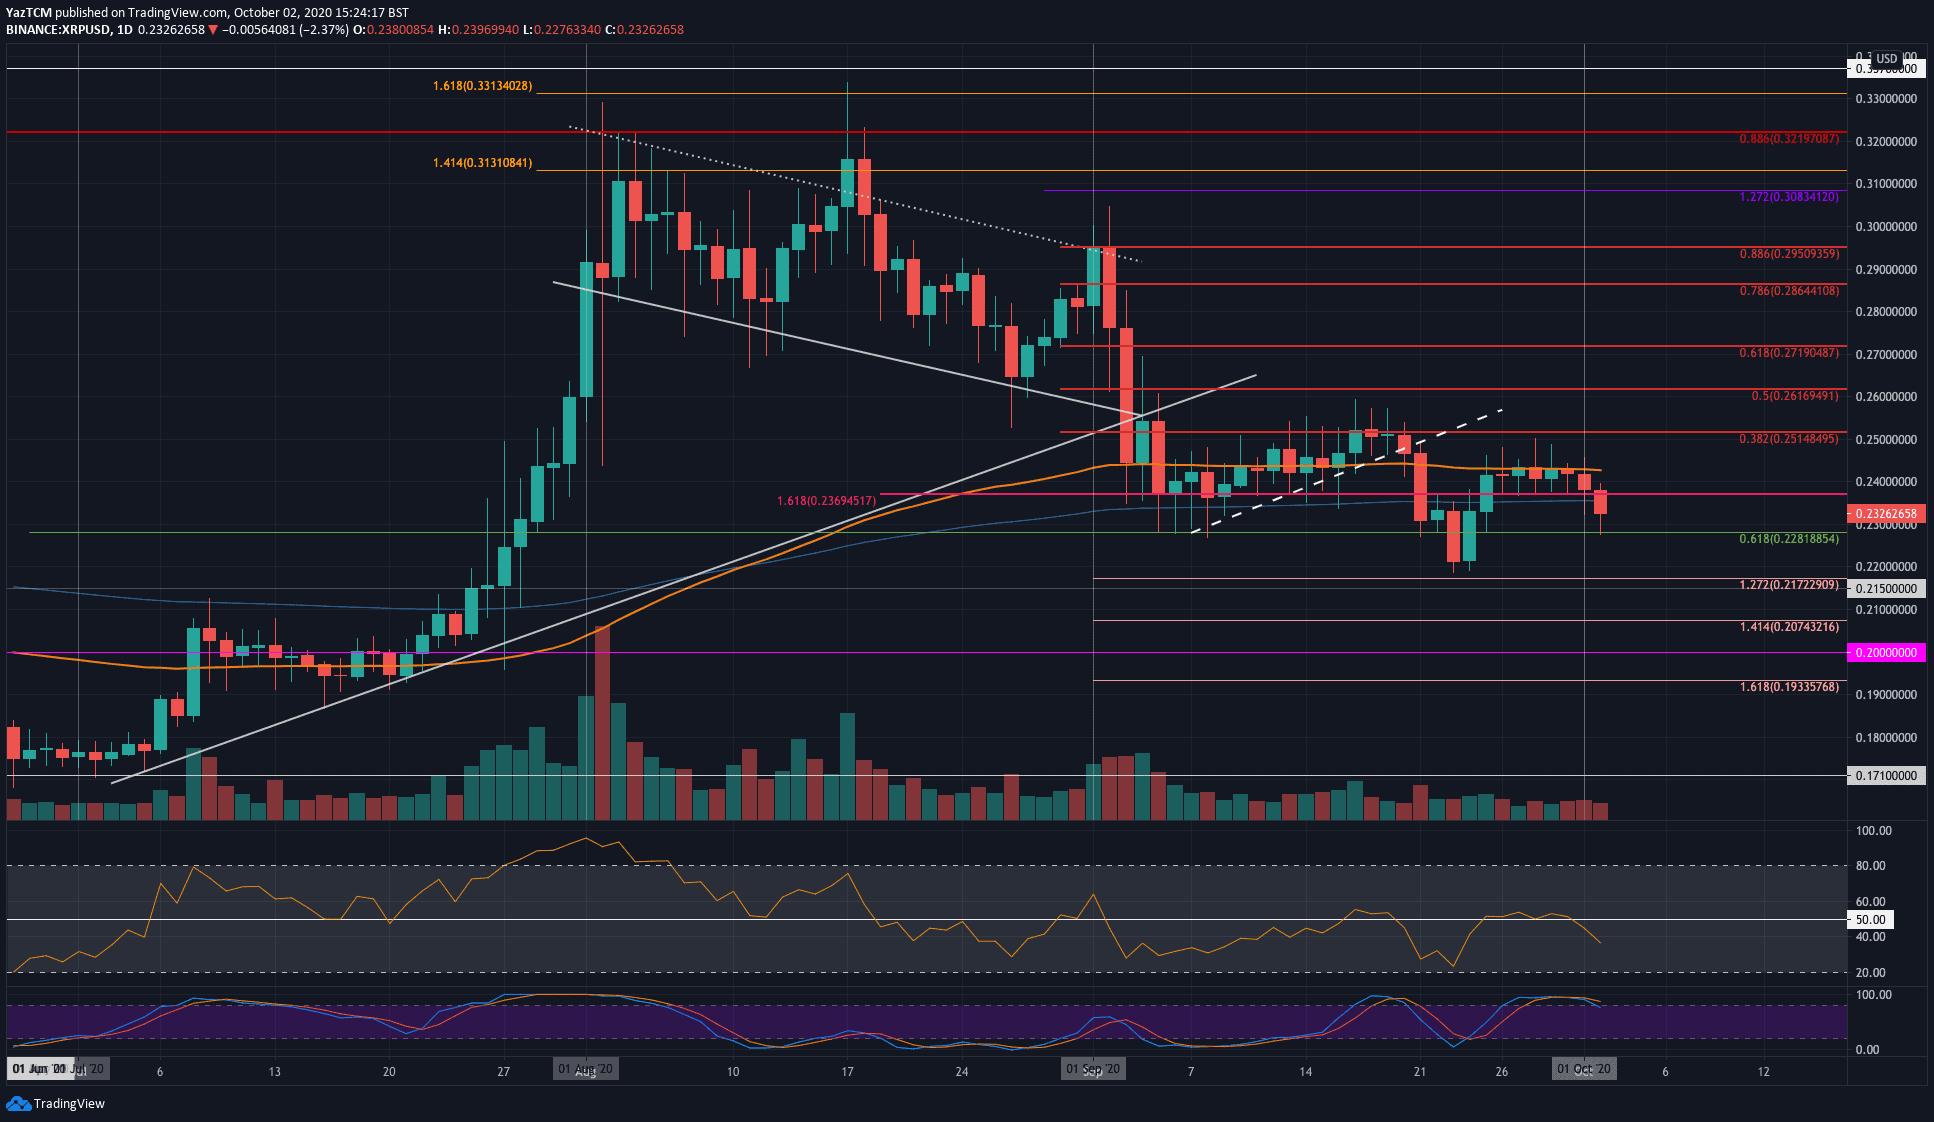
Ripple
XRP pretty much moved sideways from where it was trading last Friday. Over the weekend, XRP pushed higher into the resistance at the 100-days EMA at around $0.242. Unfortunately, it was never able to close a daily candle above this level of resistance throughout the week, which led to it falling today.
During today’s drop, the coin fell beneath the weekly support at the 200-days EMA and found lower support at $0.228 (.618 Fib). It has since bounced higher to trade at $0.232.
Looking ahead, if the sellers continue beneath $0.228, the first level of support lies at $0.22. Beneath this, additional support is found at $0.217, $0.21, and $0.20.
On the other side, the first level of strong resistance lies at the 100-days EMA at around $0.242. Above this, resistance lies at $0.251 (bearish .382 Fib), $0.261 (bearish .5 Fib), and $0.271 (bearish .618 Fib).
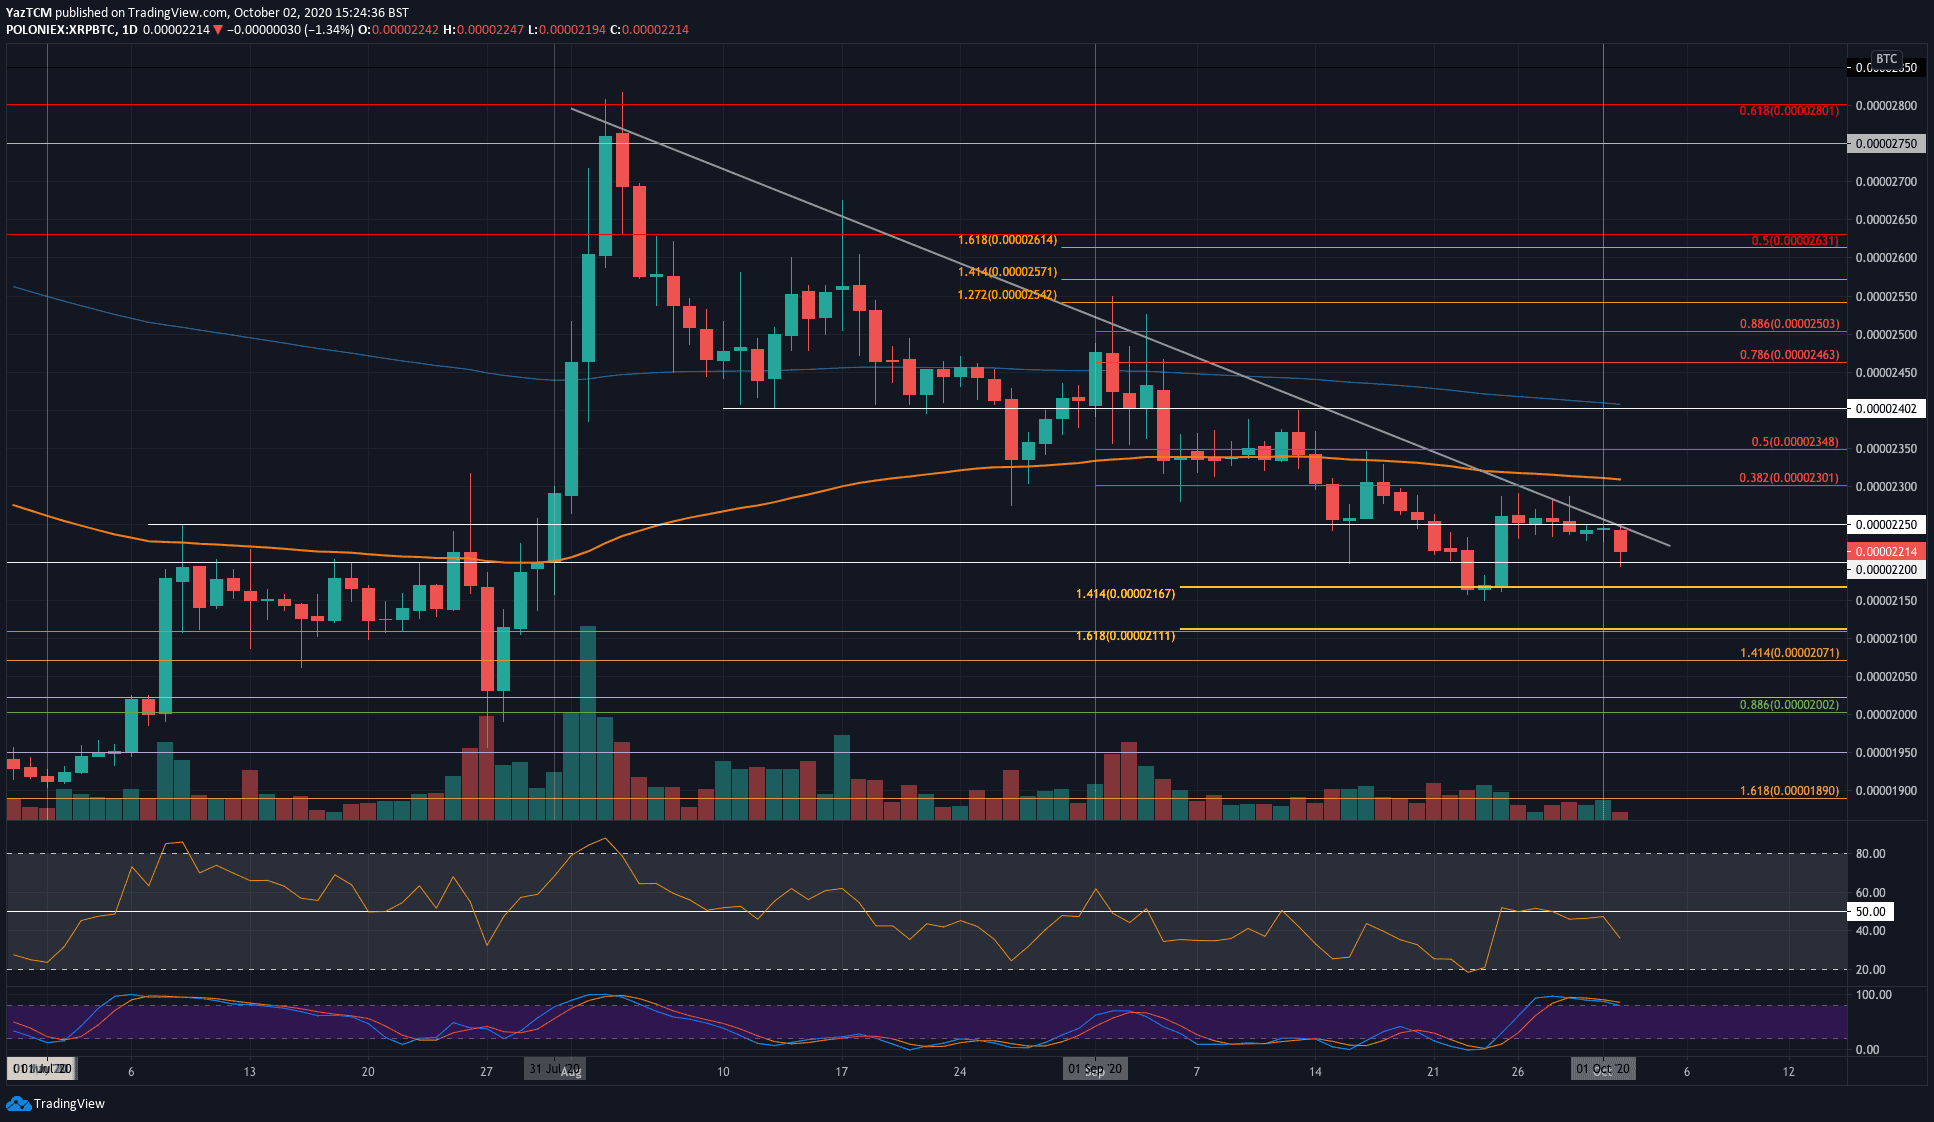
XRP headed lower against BTC this week. It started the week above the 2250 SAT level but failed to break beyond a 2-month-old falling trend line during the week. As a result, after moving sideways for around six days, XRP headed lower today as it broke beneath 2250 SAT to reach as low as 2200 SAT.
It has since bounced slightly higher to trade at 2215 SAT.
Looking ahead, if the sellers push XRP beneath the 2200 SAT level, support is found at 2150 SAT, 2111 SAT, and 2071 SAT.
On the other side, resistance lies at the 2-month-old falling trend line. Above this, resistance is found at 2250 SAT, 2300 SAT (100-days EMA), and 2350 SAT (bearish .5 Fib Retracement).
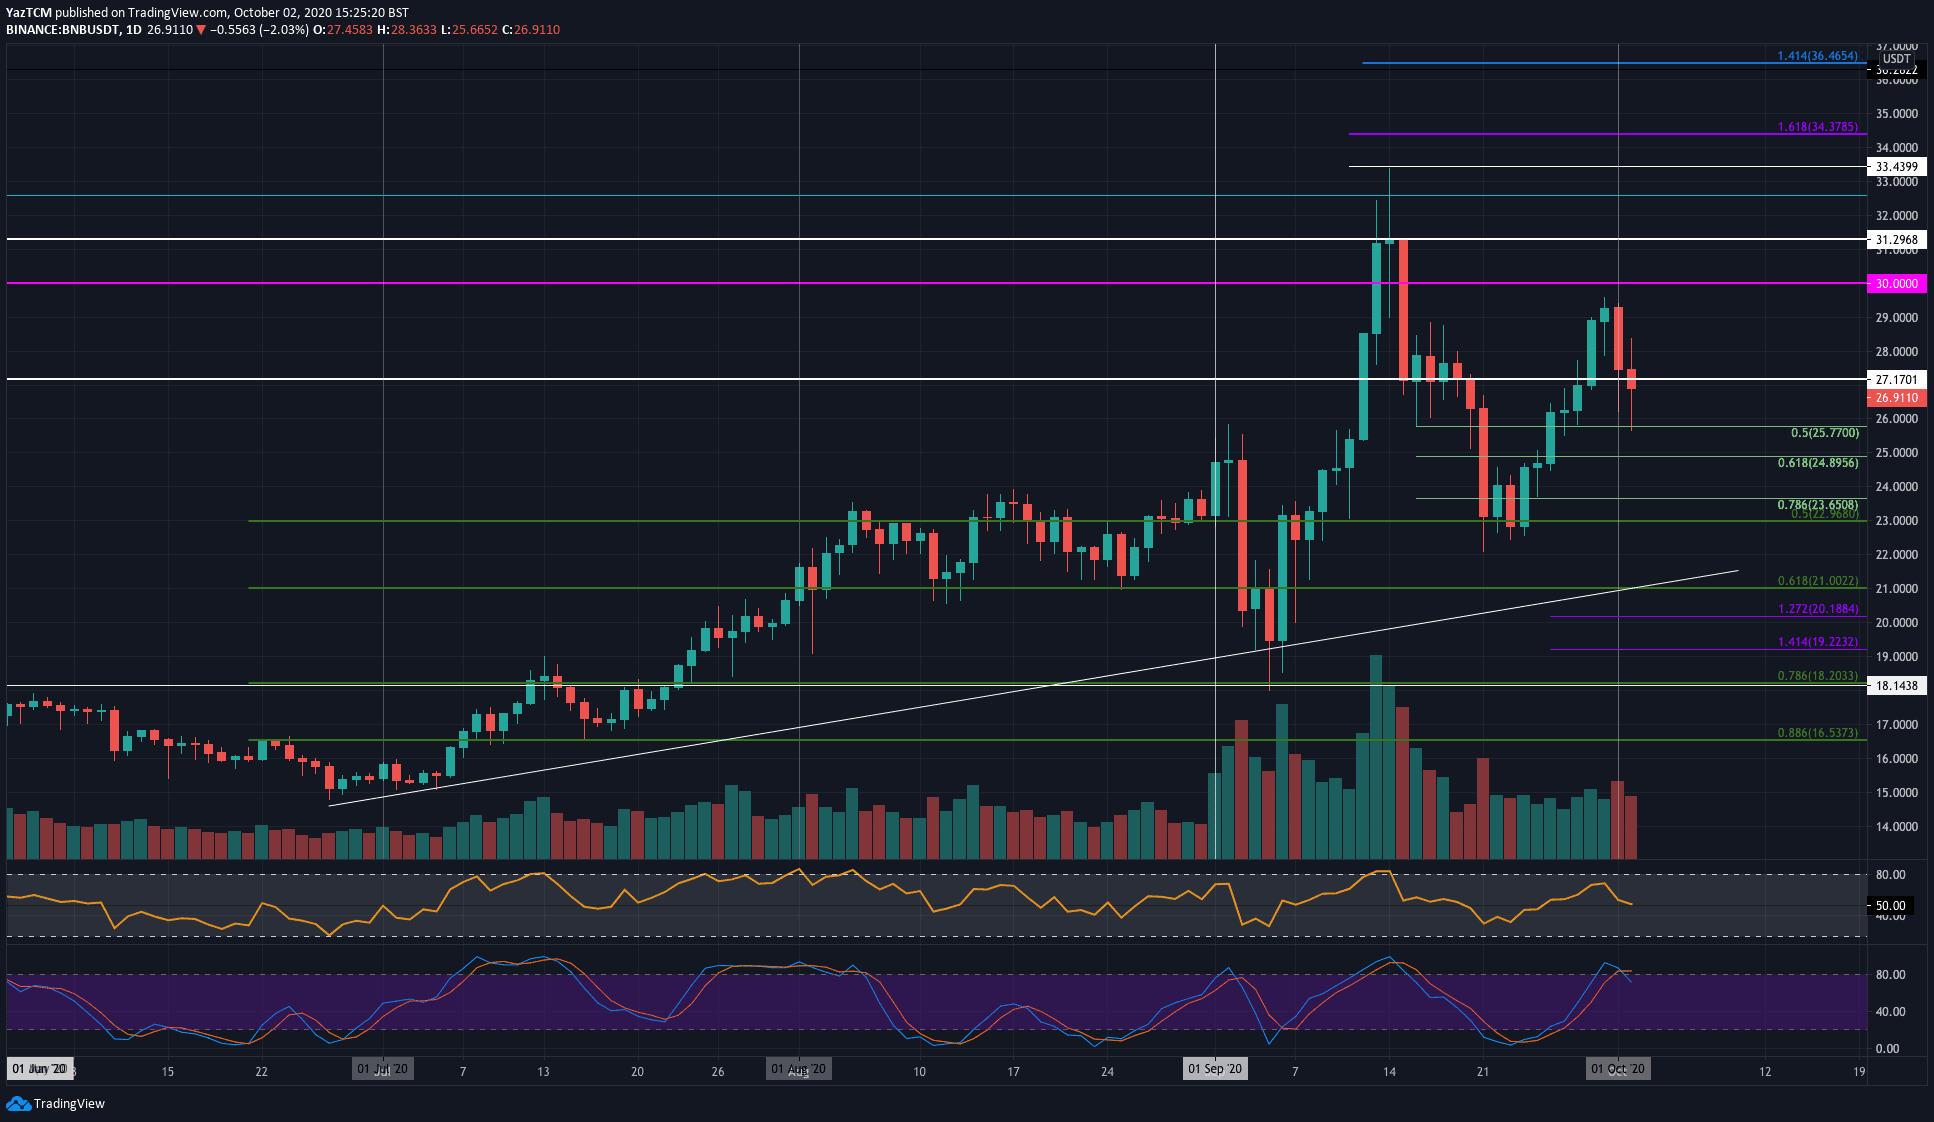
Binance Coin
BNB saw a remarkable 10% price increase over the past seven days as it trades at $27 today. The coin was trading beneath $25 last Friday as it started to surge higher throughout the week. Yesterday, BNB managed to reach as high as $29.50 before the bears took control and lowered the market.
During the price drop today, BNB managed to find strong support at the .5 Fib Retracement around $22.77, allowing the coin to bounce higher to the current $26.91 level.
Looking ahead, if the bulls can continue with the rebound, the first level of resistance is located at $27.20. Above this, resistance lies at $28, $29, and $30. Beyond $30, additional resistance is found at $31.30, $32.60, and $33.44.
On the other side, the first level of support lies at $25.77 (.5 Fib). Beneath this, support lies at $24.90 (.618 Fib ), $24, and $23.
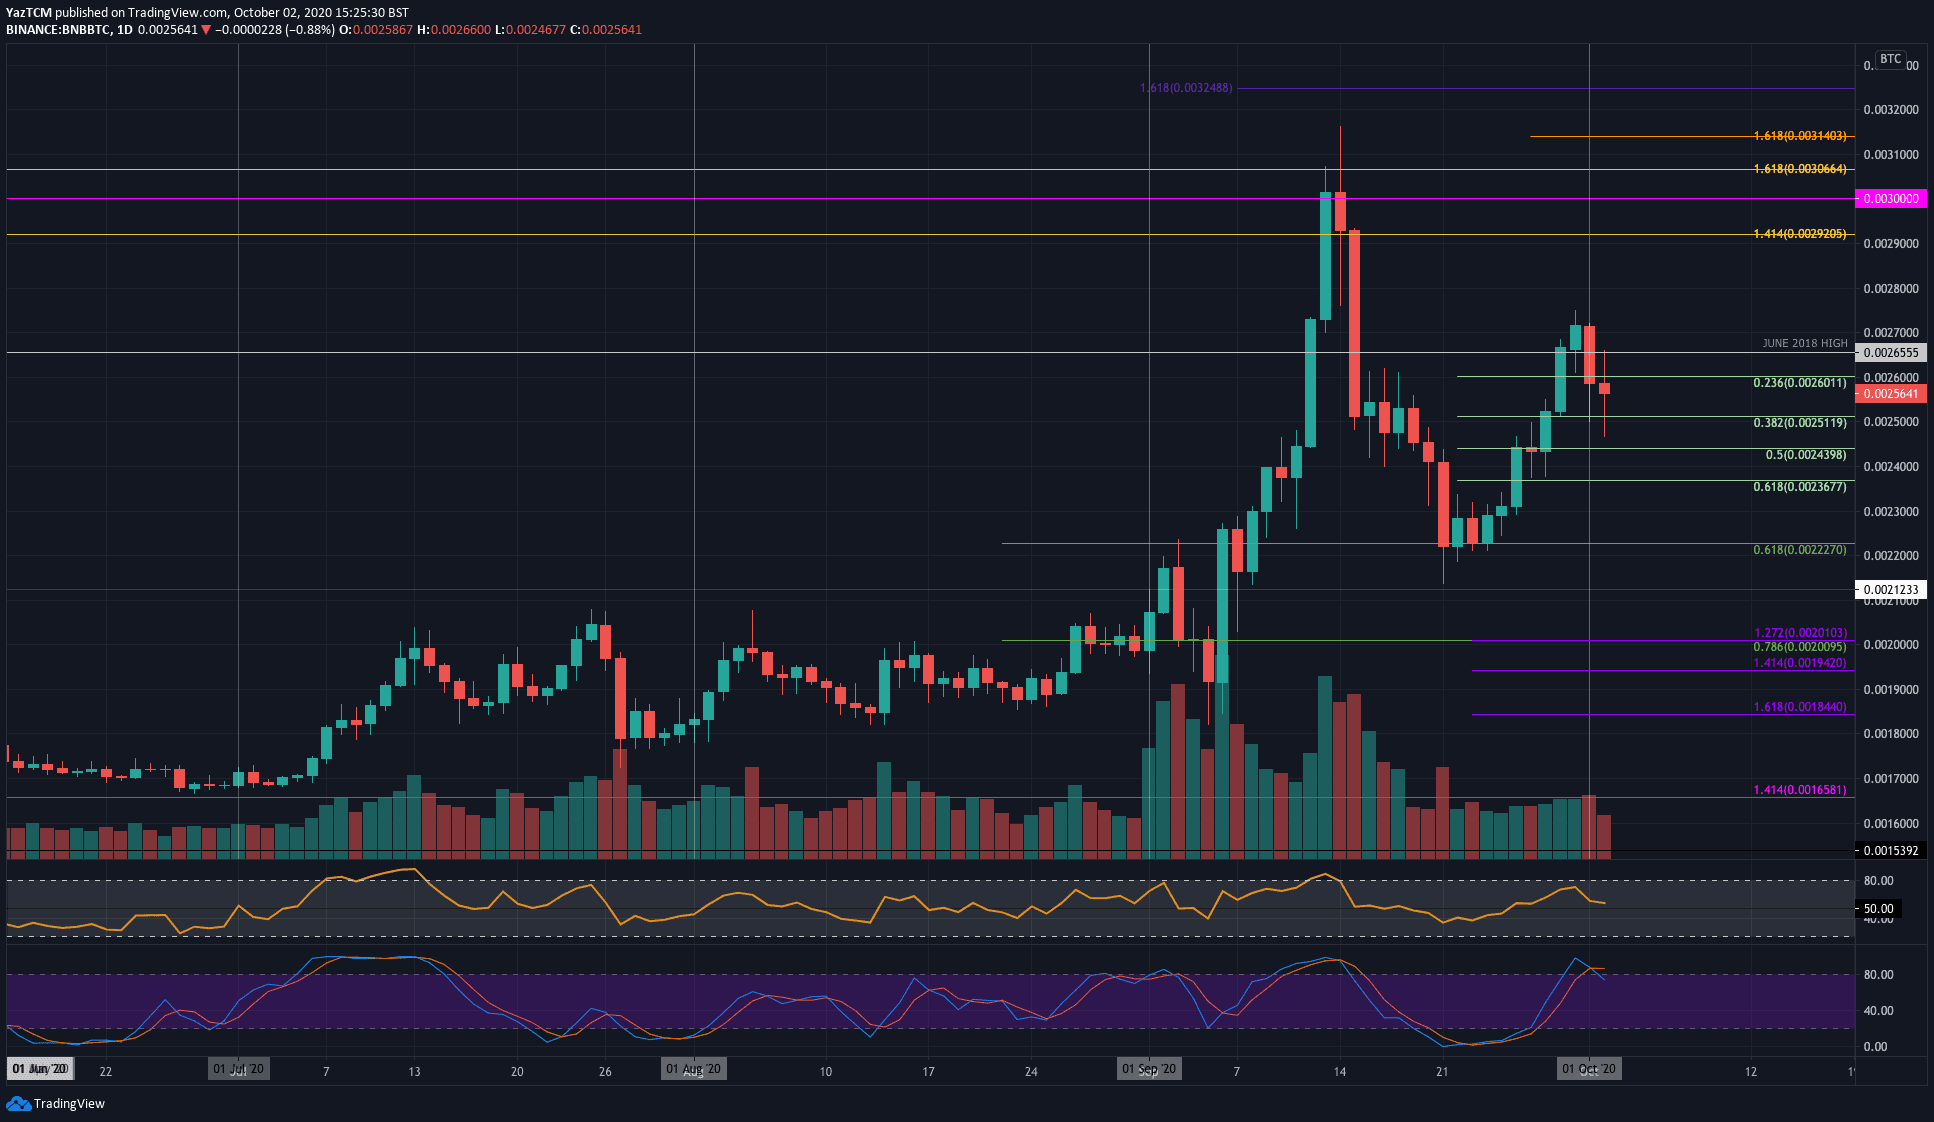
BNB is also performing well against Bitcoin after rebounding from the 0.00222 BTC (.618 Fib) level last week. After bouncing, BNB continued to surge until it hit resistance at 0.00272 yesterday. From there, BNB has dropped slightly to trade at the current 0.00256 BTC level.
Moving forward, if the sellers continue lower, the first level of support lies at 0.0025 BTC. Beneath this, support is found at 0.00243 BTC (.5 Fib), 0.00236 BTC (.618 Fib), and 0.0023 BTC.
On the other side, resistance is first expected at 0.00256 BTC (June 2018 High). Above this, additional resistance is found at 0.00272 BTC, 0.0028 BTC, 0.00292 BTC, and 0.003 BTC.
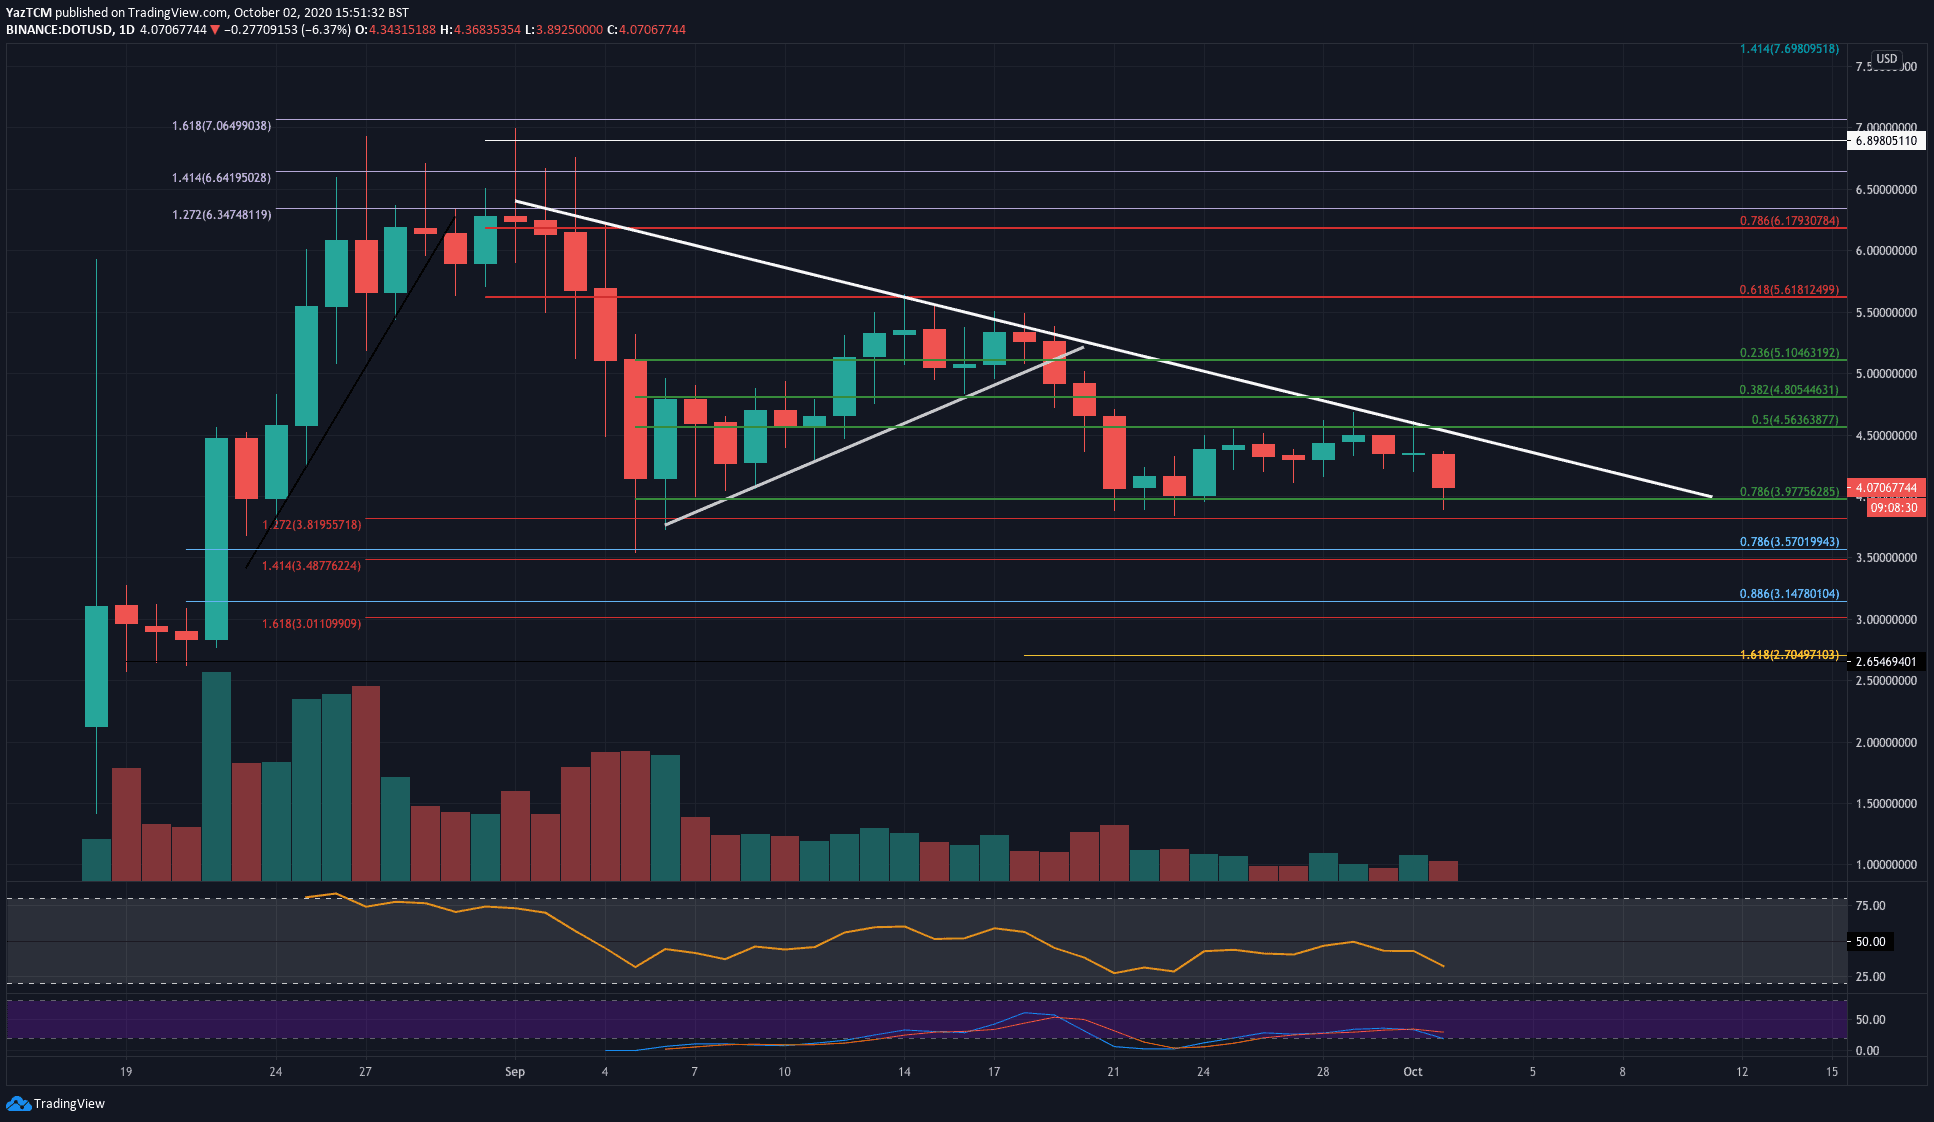
Polkadot
DOT suffered a steep 7.1% price drop this week as it fell into the $3.97 support level today – provided by the .786 Fib Retracement. The coin bounced from this support earlier in September but could never overcome resistance at $4.50 due to a falling trend line being located at this level.
DOT has since jumped back above the $4.00 level to trade at $4.10.
Moving forward, if the sellers break beneath $4.00 and push below the .786 Fib Retracement level, support lies at $3.81, $3.57, and $3.15.
On the other side, the first level of resistance lies in the falling trend line. Above this, resistance lies at $4.56, $4.80, $5.00, and $5.50.
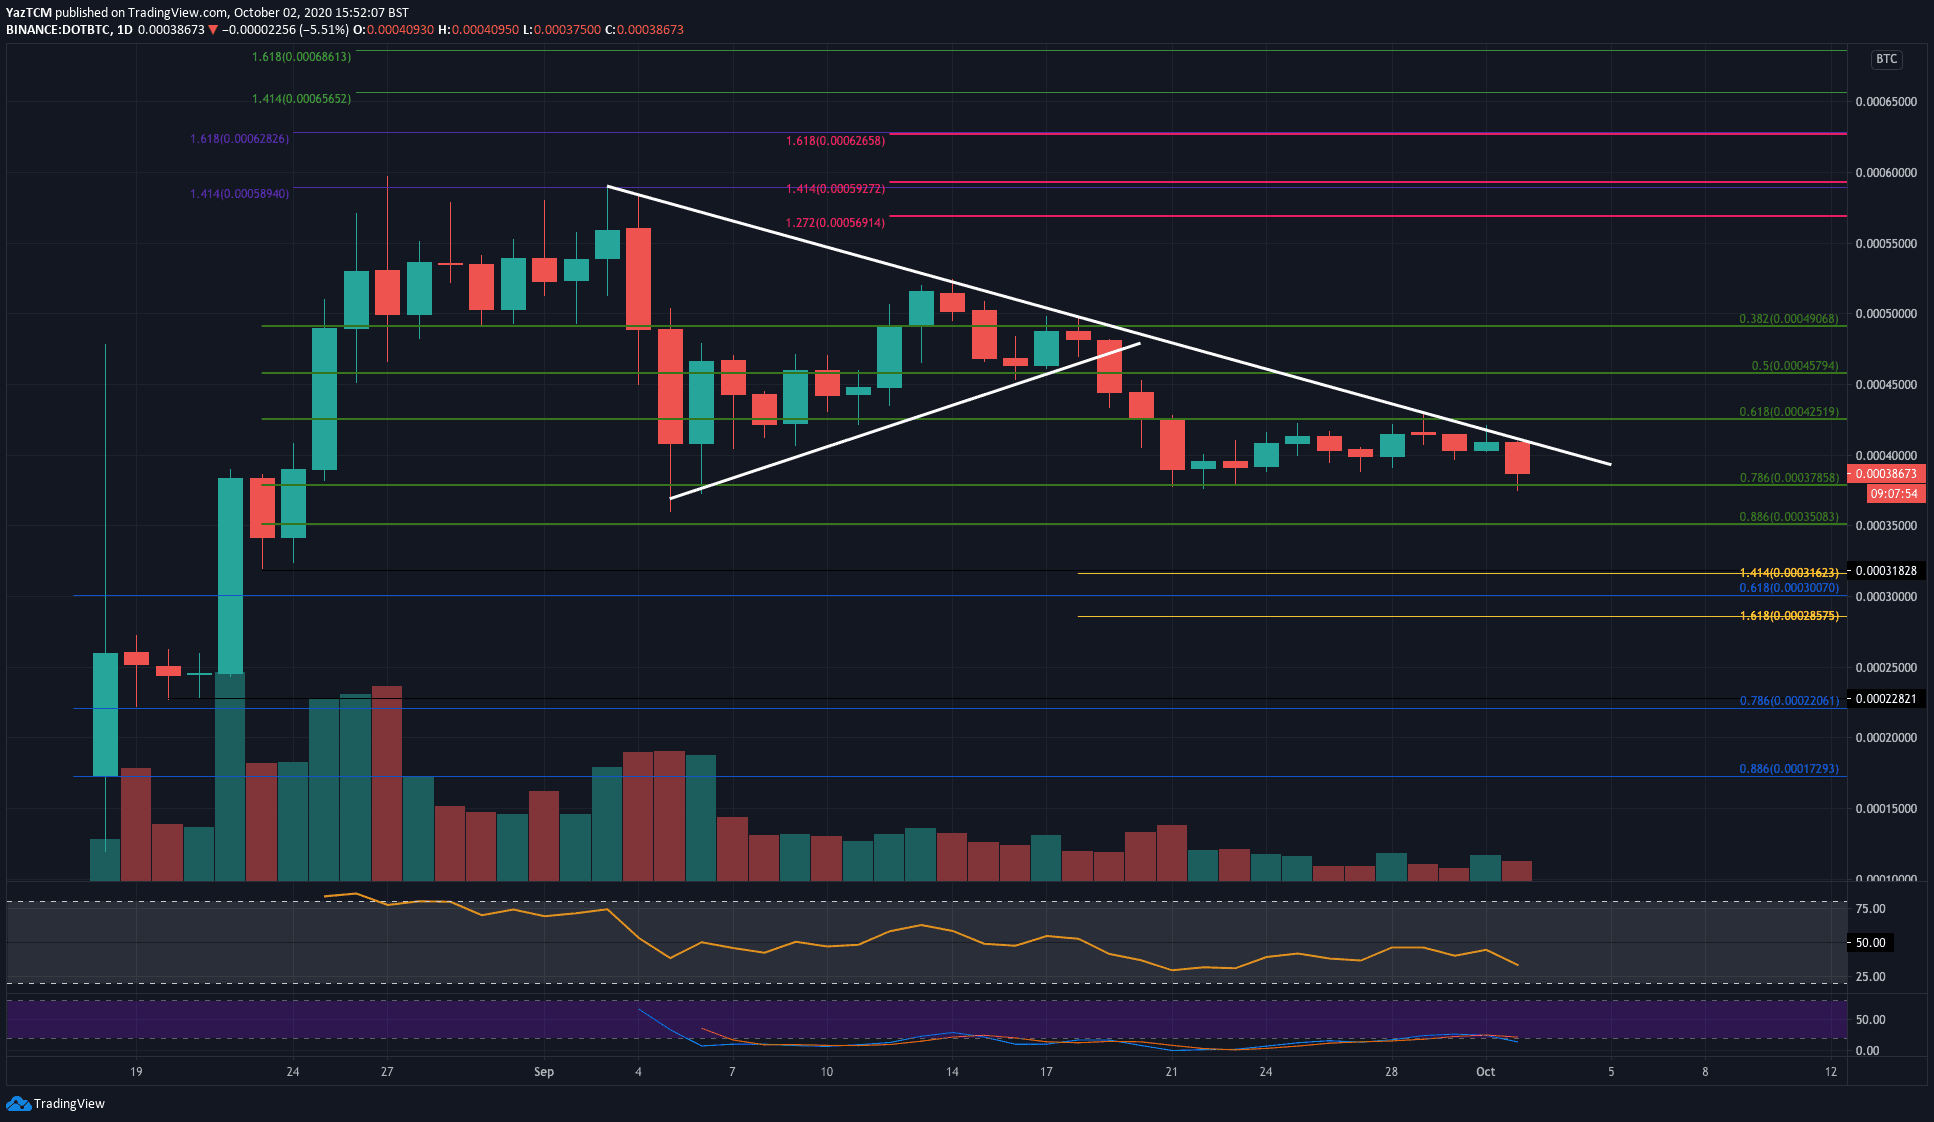
The situation is relatively similar for DOT vs. Bitcoin. The coin struggled to break above a falling trend line this week at around 42,500 SAT. As a result, it has dropped lower to head back to the 37,900 SAT (.786 Fib Retracement) support.
If the sellers break beneath 37,900 SAT, the first level of support lies at 35,000 SAT (.886 Fib Retracement). Beneath this, support is found at 31,600 SAT, 30,000 SAT, and 28,575 SAT.
On the other side, the first level of resistance lies in the falling trend line. Above this, resistance lies at 42,500 SAT, 45,800 SAT, and 50,000 SAT.