Ethereum is moving sideways at the 3 level as it attempts to overcome resistance at 7.Against BTC, ETH is struggling to overcome resistance at 0.0179 BTC but remains supported at 0.0175 BTC.Ethereum still remains within a neutral condition until the bulls can bring the market above the December highs at 2.Key Support & Resistance LevelsETH/USDSupport: 3.50, 8, 0.Resistance: 5, 2, 8.ETH/BTC:Support: 0.0171 BTC, 0.0169 BTC, 0.0164 BTC.Resistance: 0.0175 BTC, 0.0185 BTC, 0.019 BTC.ETH/USD: ETH Rebounds From 7 Support But Struggles At 7Since our last analysis, after ETH rolled over it went on to fall into the support at 7.88 which is provided by the short term .382 Fibonacci Retracement level. It did spike lower into 5 but the bulls quickly brought the
Topics:
Yaz Sheikh considers the following as important: ETH Analysis, Ethereum (ETH) Price
This could be interesting, too:
Mandy Williams writes Ethereum Derivatives Metrics Signal Modest Downside Tail Risk Ahead: Nansen
CryptoVizArt writes Will Weak Momentum Drive ETH to .5K? (Ethereum Price Analysis)
Mandy Williams writes Ethereum Key Metrics Point to Persistent Bullish Outlook for ETH: CryptoQuant
CryptoVizArt writes Ethereum Price Analysis: Following a 15% Weekly Crash, What’s Next for ETH?
- Ethereum is moving sideways at the $143 level as it attempts to overcome resistance at $147.
- Against BTC, ETH is struggling to overcome resistance at 0.0179 BTC but remains supported at 0.0175 BTC.
- Ethereum still remains within a neutral condition until the bulls can bring the market above the December highs at $152.
Key Support & Resistance Levels
ETH/USD
Support: $133.50, $128, $120.
Resistance: $145, $152, $158.
ETH/BTC:
Support: 0.0171 BTC, 0.0169 BTC, 0.0164 BTC.
Resistance: 0.0175 BTC, 0.0185 BTC, 0.019 BTC.
ETH/USD: ETH Rebounds From $137 Support But Struggles At $147
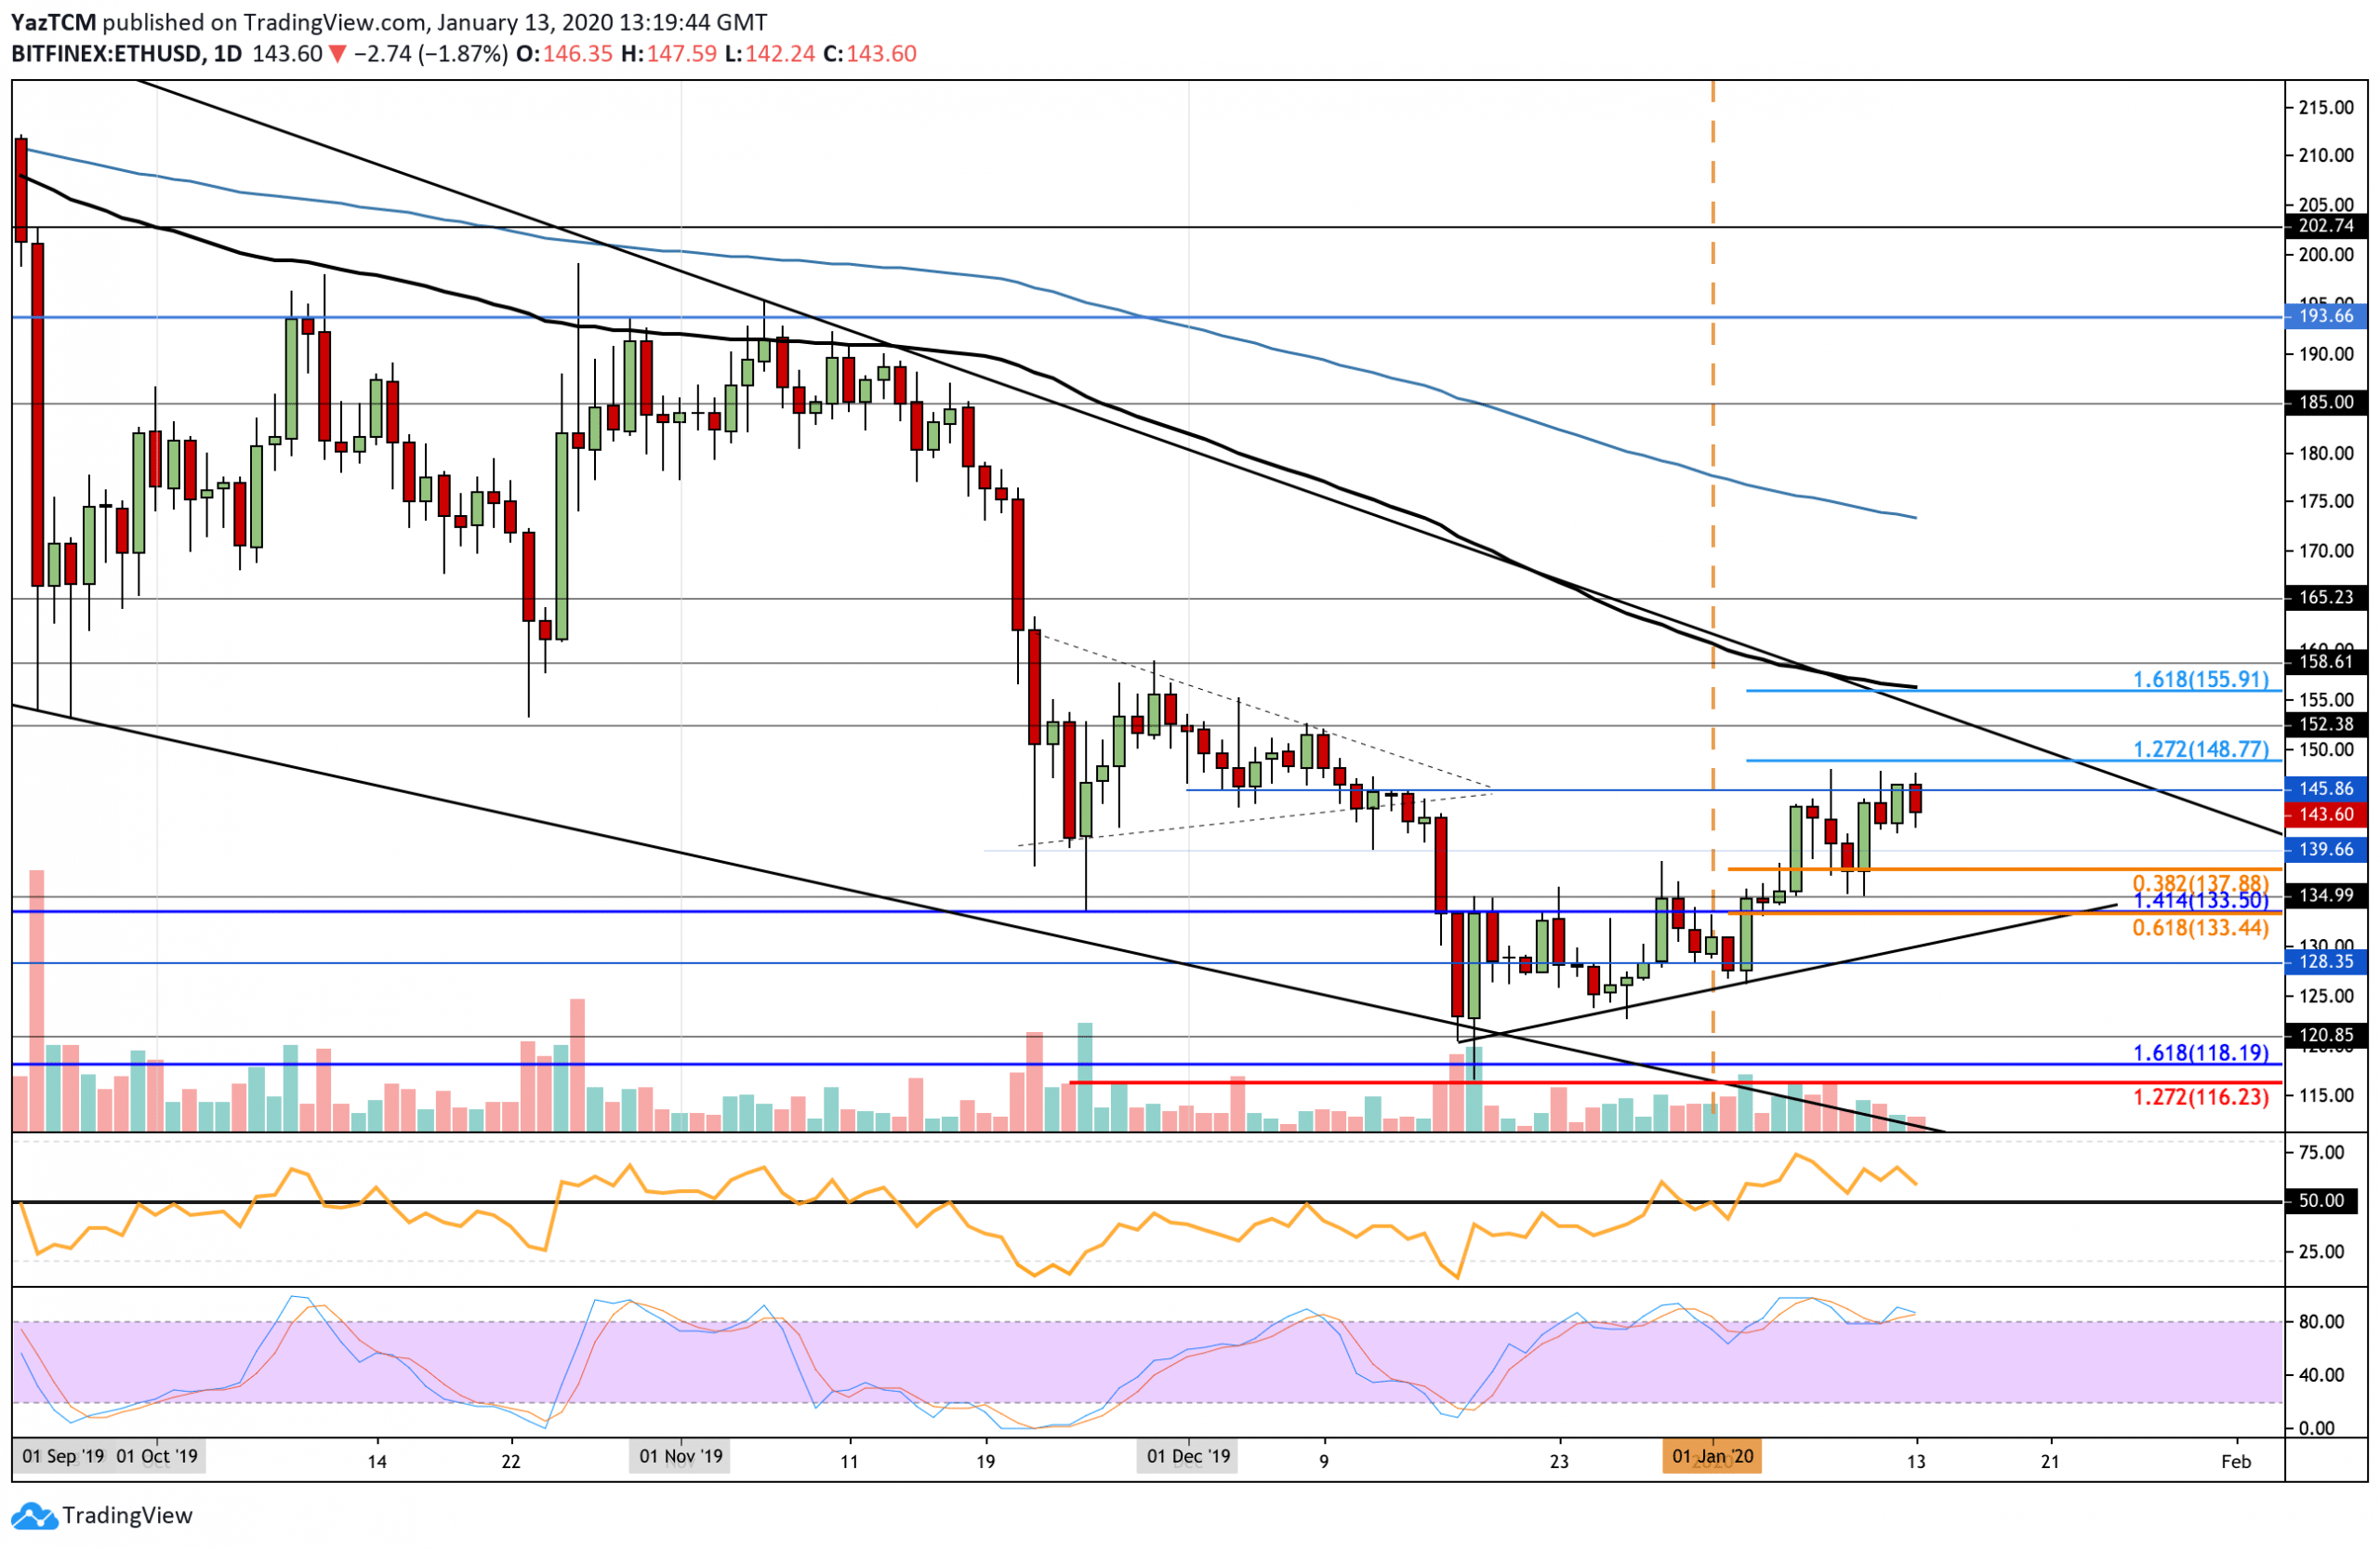
Since our last analysis, after ETH rolled over it went on to fall into the support at $137.88 which is provided by the short term .382 Fibonacci Retracement level. It did spike lower into $135 but the bulls quickly brought the market higher. After bouncing from this point, ETH went on to climb upward but is currently struggling to make any movement above $147.
As Ethereum is still trading sideways, the market condition is considered as neutral until the December highs at $152 can be broken. For this market to turn bearish, ETH must drop and fall beneath the support at $125.
Ethereum Short Term Price Prediction
If the bulls kick into gear and push ETH above the resistance at $147, immediate higher resistance lies at $150 and $152 (December highs). Above this, resistance lies at $155.91 (1.618 Fib Extension level) which is further bolstered by the 100-days EMA and the upper boundary of a long term descending price channel. Beyond this, resistance lies at $160, $165, and $173 (200-days EMA).
Alternatively, if the sellers push the market lower, immediate support is located at $137.88 (.short term .382 Fib Retracement). Beneath this, support lies at $135, $133.44, $130, and $128.35.
The RSI is falling which is a worrying sign for the bulls as it shows the positive momentum is fading. Furthermore, there is a divergence between the RSI and price action which could be an indication that a large price drop is imminent. Additionally, the Stochastic RSI is in overbought conditions and is primed for a bearish crossover signal that would send the market lower.
ETH/BTC: ETH Struggles At 0.0179 BTC
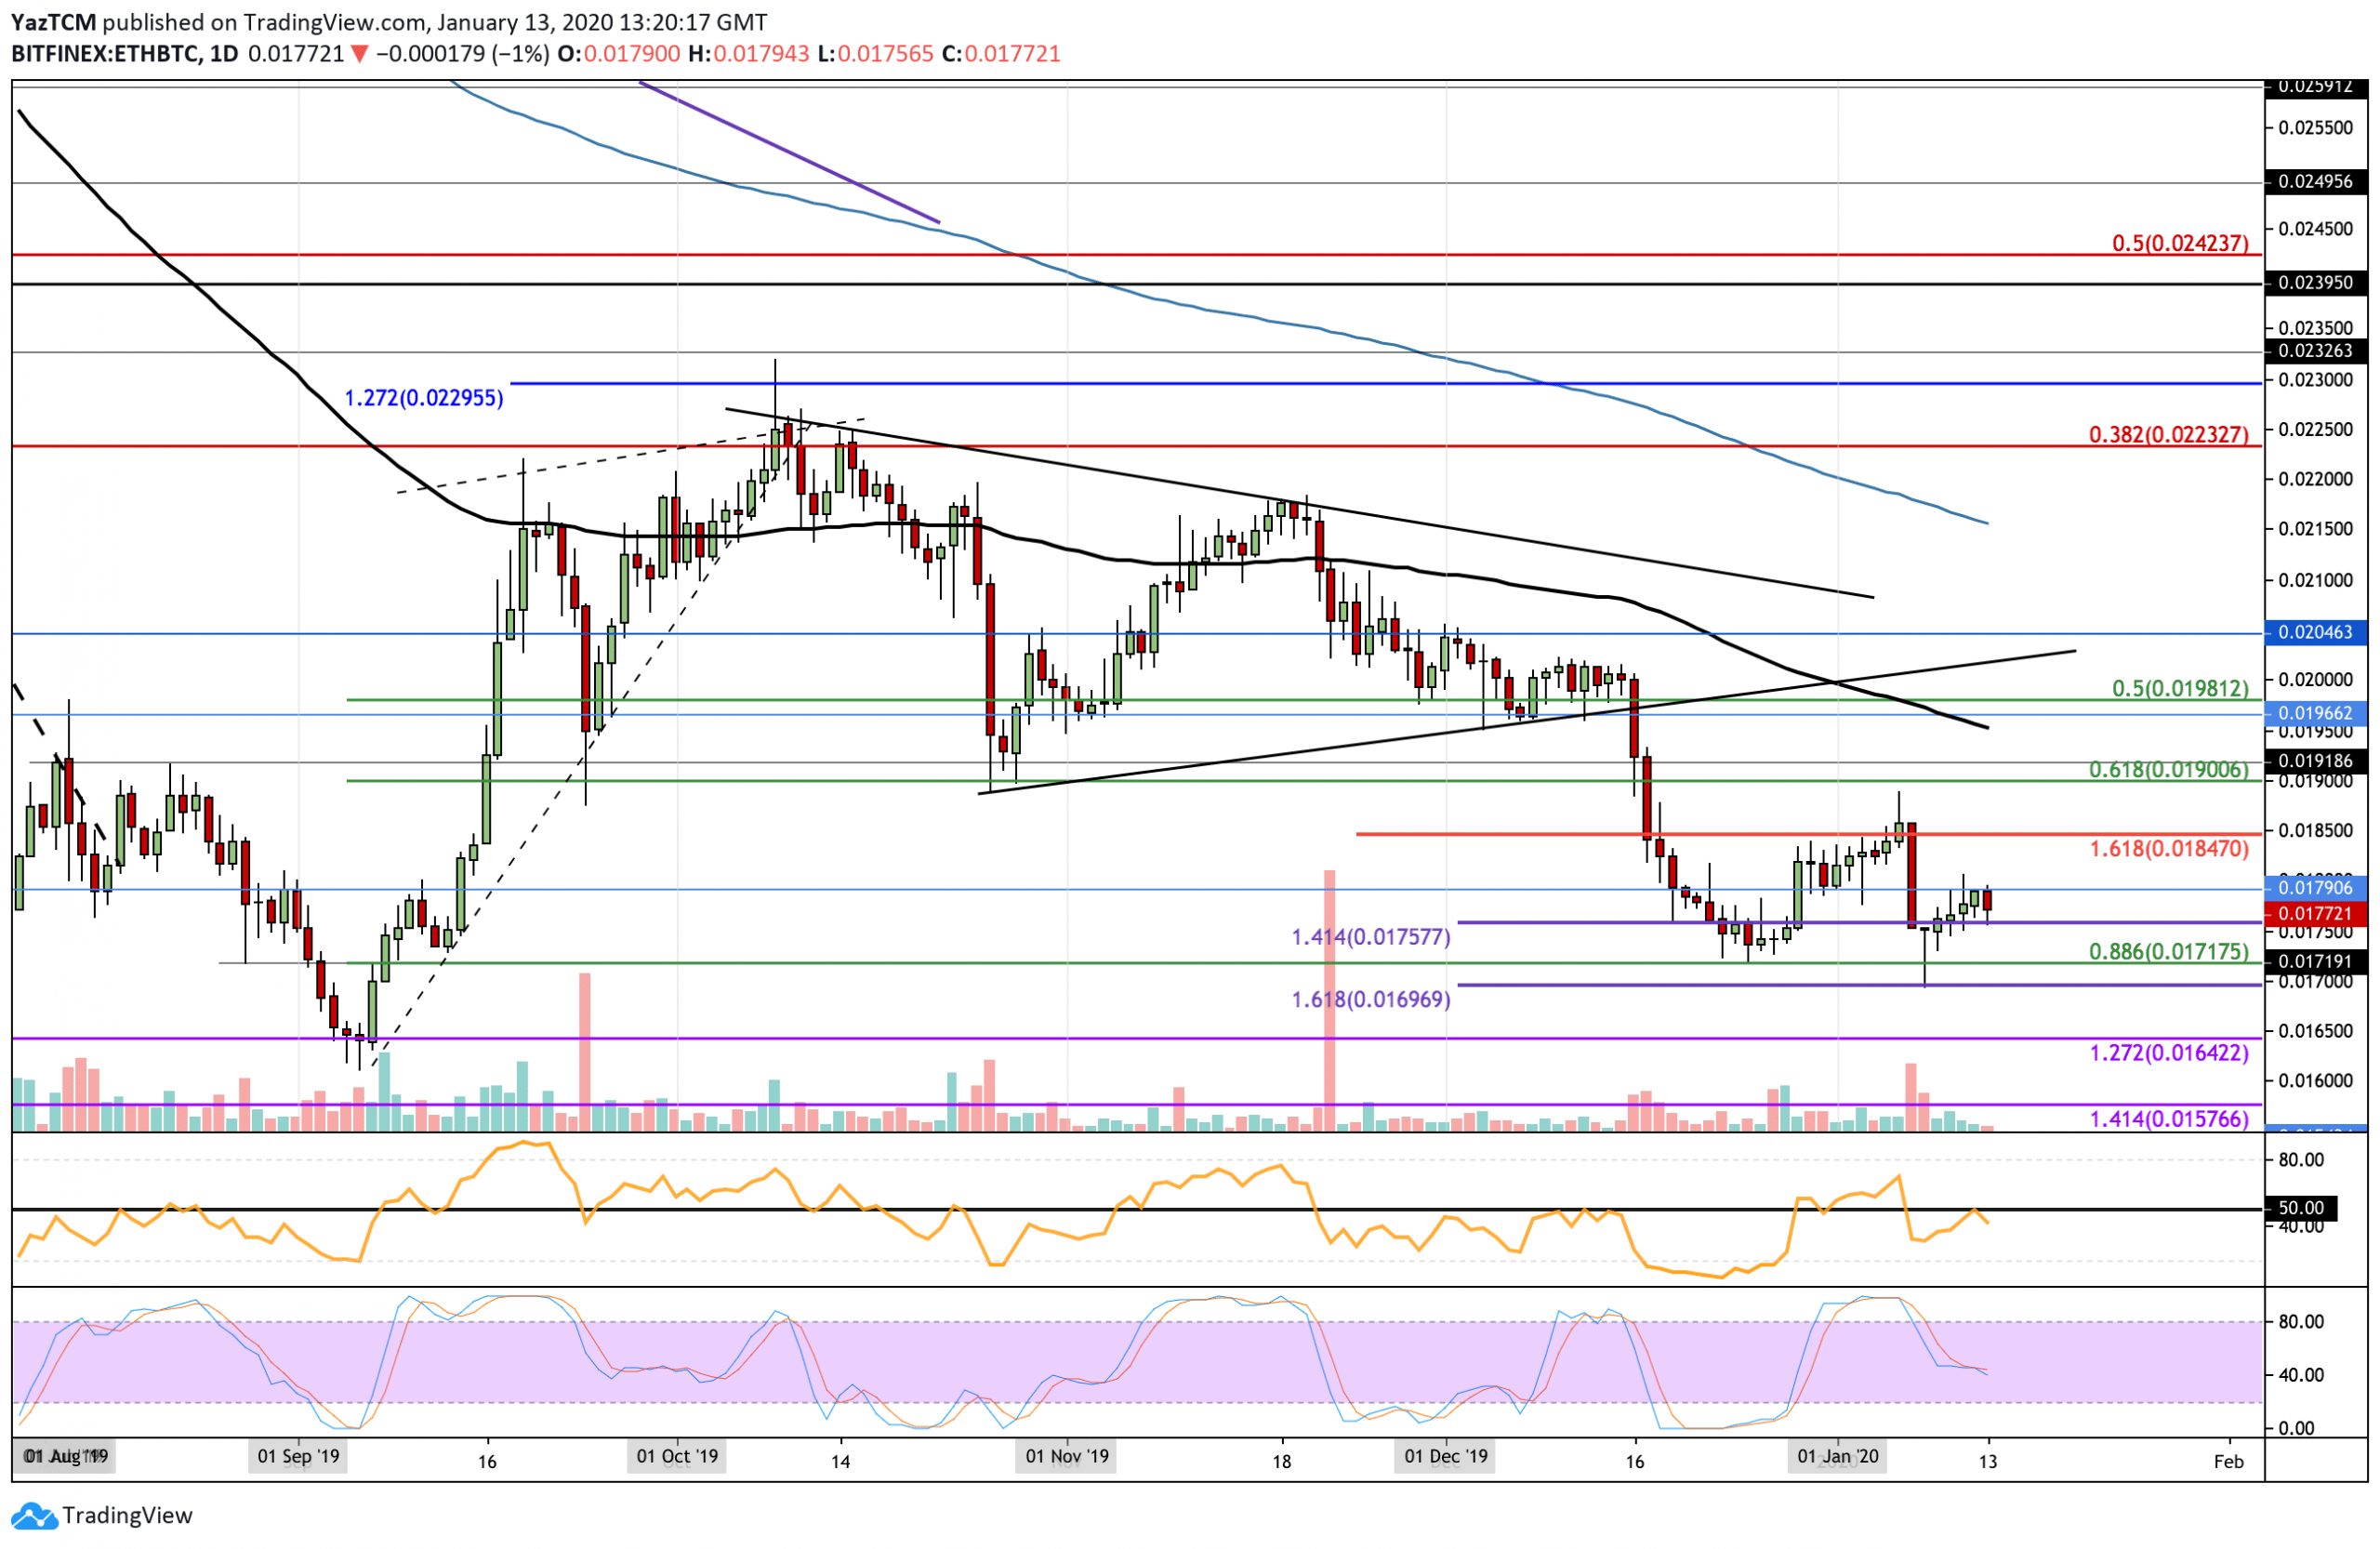
Against Bitcoin, ETH went on to rise from the support at 0.0175 BTC but met resistance at 0.0179 BTC. This resistance proved to be too strong for the bulls which caused ETH to drop back into the support at 0.0175 BTC.
ETH still remains neutral and must break above the 0.020 BTC level to turn bullish by any means. However, if it was to drop beneath the support at 0.0171 BTC, the market would turn bearish.
Ethereum Short Term Price Prediction
If the sellers push ETH beneath the support at 0.0175 BTC, initial support is found at 0.0171 BTC (.886 Fibonacci Retracement level). Beneath this, support lies at 0.0169 BTC, 0.0164 BTC, and 0.016 BTC. Alternatively, if the bulls defend the support at 0.0175 BTC and push higher, the first level of resistance is located at 0.0179 BTC. Above this, resistance lies at 0.0184 BTC, 0.019 BTC and 0.0195 BTC (100-days EMA).
The RSI has turned away from the 50 level which shows that the sellers remain in control over the market momentum. If the RSI continues to fall, we can expect ETH to drop further.