Ethereum saw a massive price increase over the past 24 hours, which allowed it to push above the 0 level.The cryptocurrency continued to drive upward from 0 today as it reached as high as 0 before dropping.Against Bitcoin, Ethereum created a fresh 2020 high as it reached 0.0317 BTC.ETH/USD: Break Above 0 Sets Fresh 2020 Highs For ETHKey Support Levels: 0, 7, 7.Key Resistance Levels: 0, 3, 2.Ethereum saw an impressive 31% price surge over the past week of trading. It started the week off by jumping from a rising trend line at around 5 and pushing above the upper boundary of an ascending triangle at 0.ETH then went on a rampage as it swooped past the previous 2020 high at 7 to break above 0. After breaking 0, it continued higher until reaching the
Topics:
Yaz Sheikh considers the following as important: ETH Analysis, ETHBTC, Ethereum (ETH) Price, ethusd
This could be interesting, too:
Mandy Williams writes Ethereum Derivatives Metrics Signal Modest Downside Tail Risk Ahead: Nansen
Jordan Lyanchev writes Weekly Bitcoin, Ethereum ETF Recap: Light at the End of the Tunnel for BTC
CryptoVizArt writes Will Weak Momentum Drive ETH to .5K? (Ethereum Price Analysis)
Jordan Lyanchev writes Bybit Hack Fallout: Arthur Hayes, Samson Mow Push for Ethereum Rollback
- Ethereum saw a massive price increase over the past 24 hours, which allowed it to push above the $300 level.
- The cryptocurrency continued to drive upward from $300 today as it reached as high as $320 before dropping.
- Against Bitcoin, Ethereum created a fresh 2020 high as it reached 0.0317 BTC.
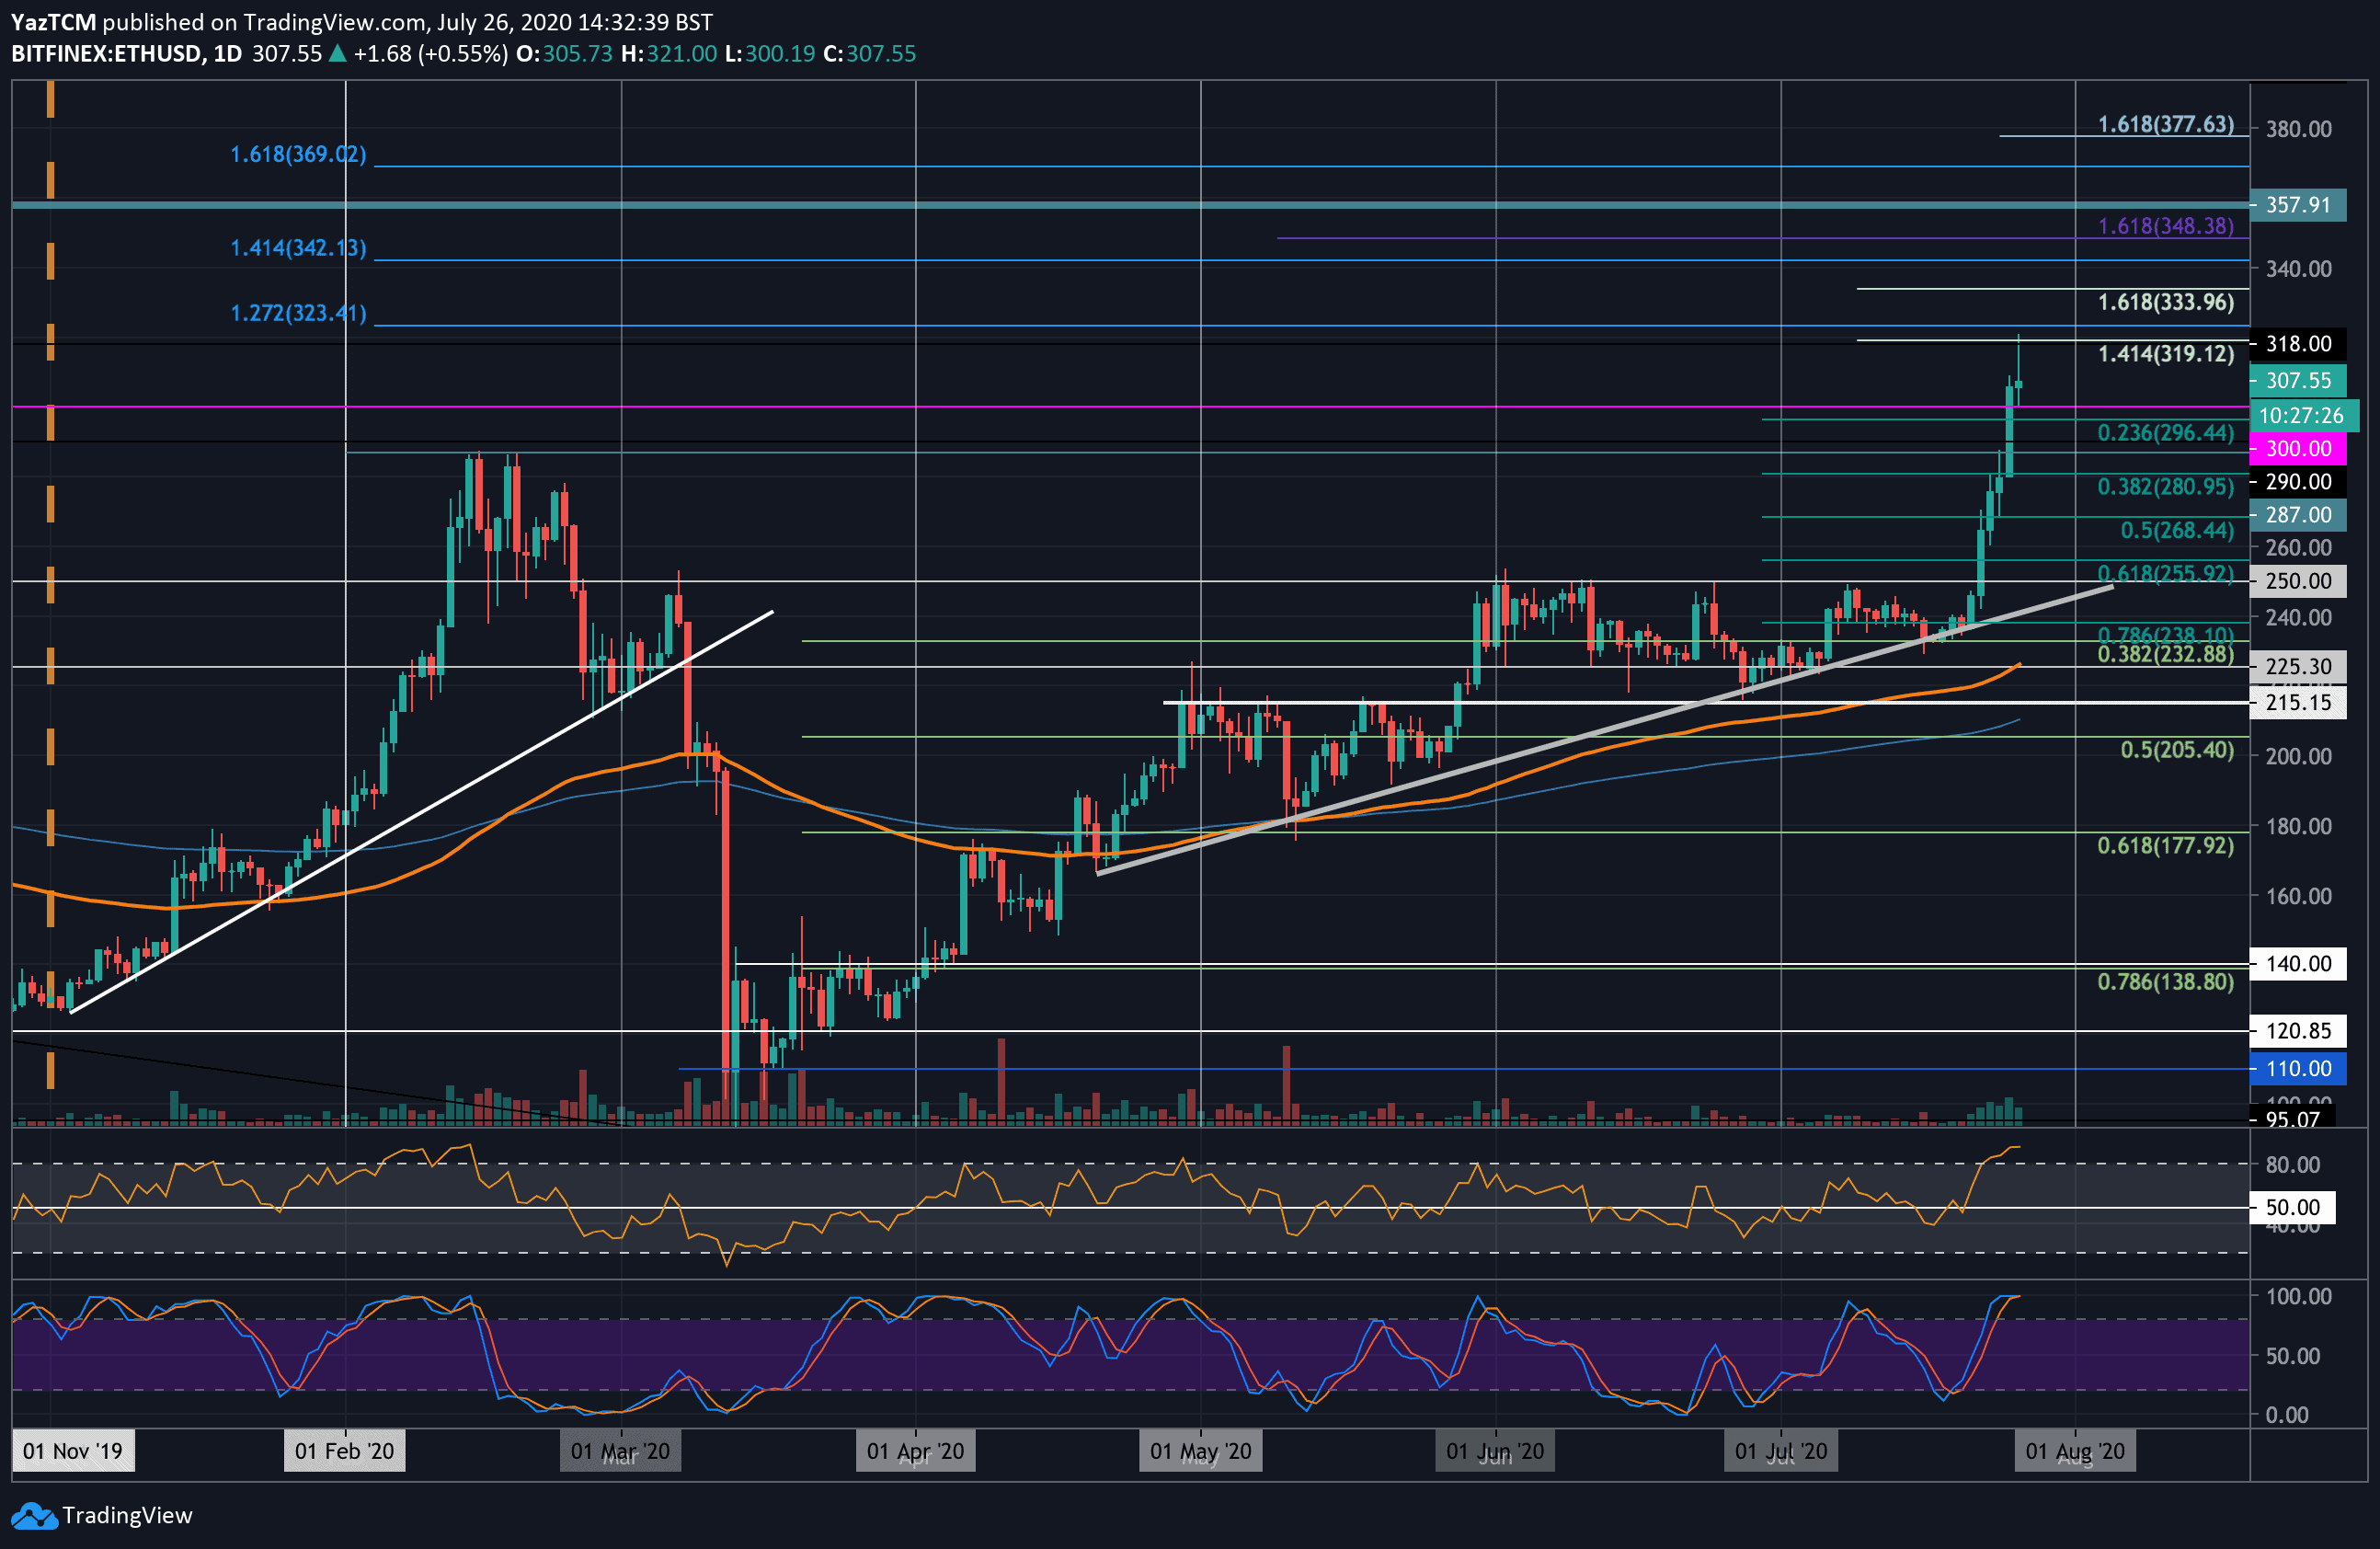
ETH/USD: Break Above $300 Sets Fresh 2020 Highs For ETH
Key Support Levels: $300, $297, $287.
Key Resistance Levels: $320, $333, $342.
Ethereum saw an impressive 31% price surge over the past week of trading. It started the week off by jumping from a rising trend line at around $235 and pushing above the upper boundary of an ascending triangle at $250.
ETH then went on a rampage as it swooped past the previous 2020 high at $287 to break above $300. After breaking $300, it continued higher until reaching the $320 level, where it met resistance. It has since dropped to the $307 level at the time of writing.
ETH-USD Short Term Price Prediction
Looking ahead, if the bulls continue to drive ETH above $320, resistance is expected at $333. This is followed by added resistance at $342, $350, and $357.
On the other side, the first level of strong support lies at $300. Beneath this, support is found at $297 (.236 Fib Retracement), $287, and $280 (.382 Fib Retracement). Further support is located at $268 (.5 Fib Retracement), and $255 (.618 Fib Retracement).
The RSI has hit extremely overbought levels, not seen since February 2020. This suggests the bulls maybe a little overextended, and we should see some form of brief retracement. Additionally, the Stochastic RSI is ready for a bearish crossover signal that would help to send the market lower.
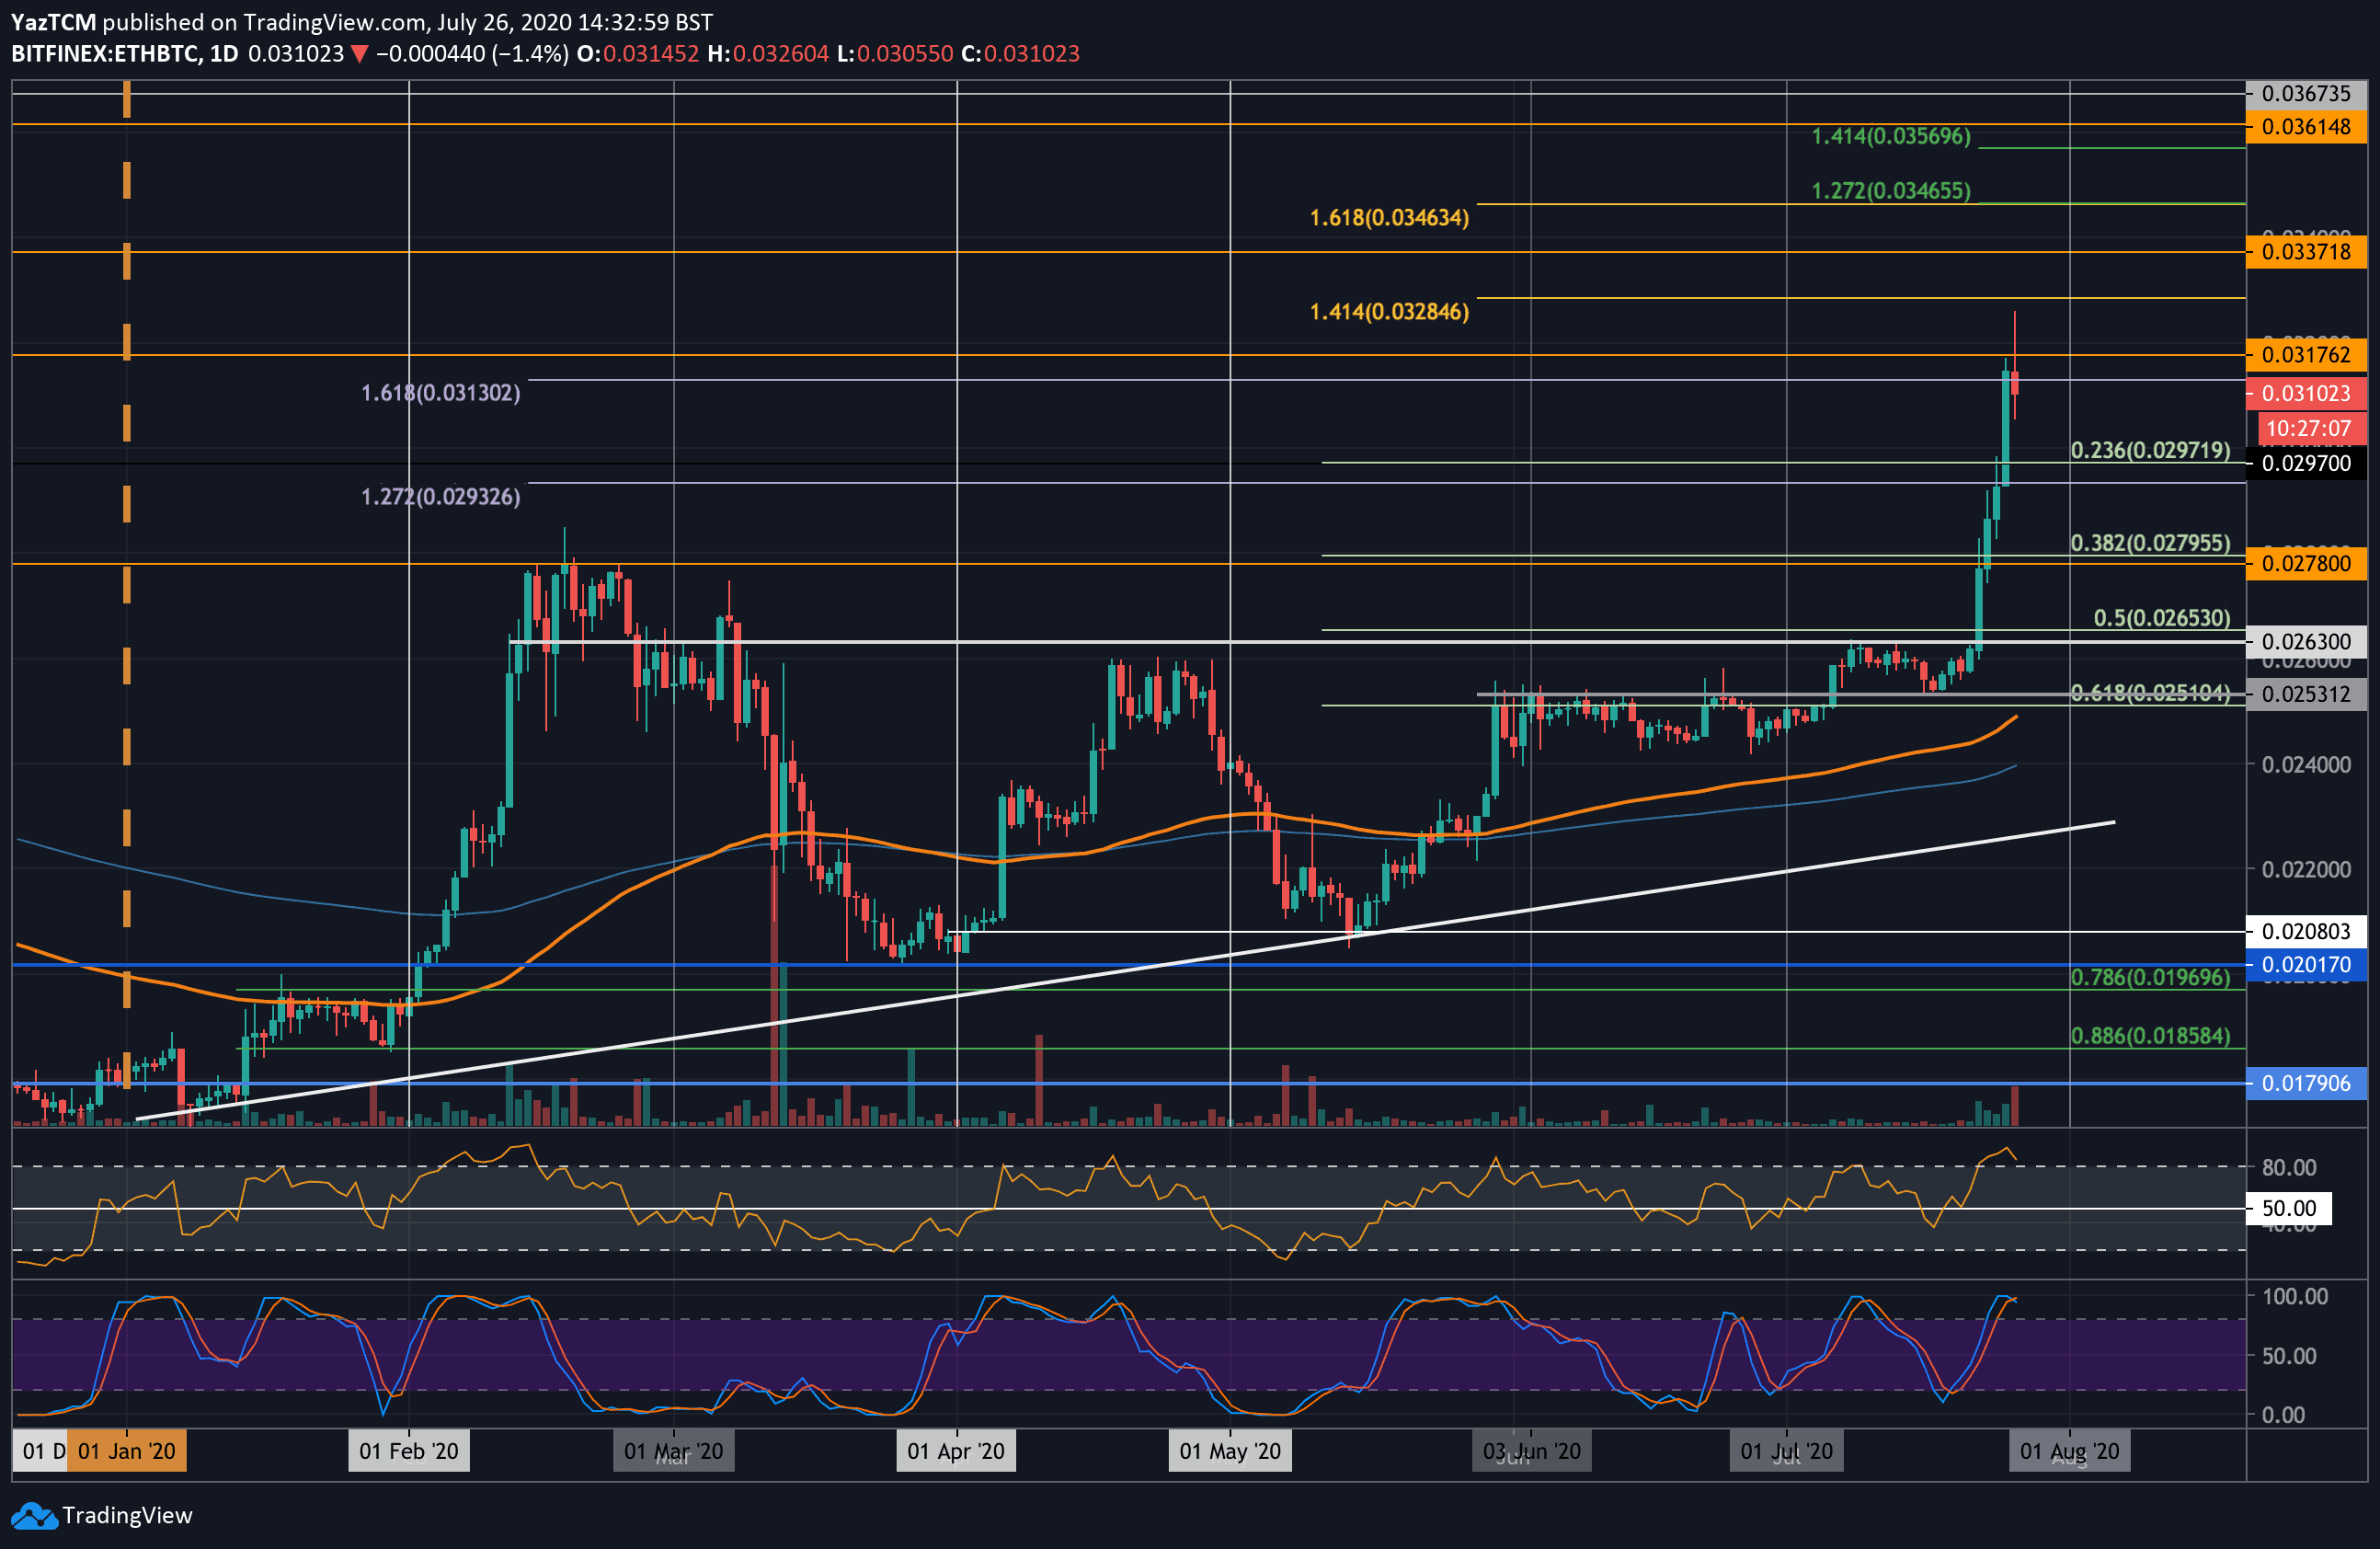
ETH/BTC – Ethereum Bulls Create Fresh 13 Month High
Key Support Levels: 0.03 BTC, 0.0297 BTC, 0.029 BTC.
Key Resistance Levels: 0.0317 BTC, 0.0328 BTC, 0.0337 BTC.
Ethereum has also surged significantly against Bitcoin itself. This week, ETH managed to push higher above the previous 2020 high at 0.0278 BTC as it moved upward to break above the 0.03 BTC level.
ETH continued as it reached as high as 0.0317 BTC before hitting resistance and stalling. This created a fresh 13 month high for ETH/BTC as the market finally turns extremely bullish in 2020 with ETH 2.0 on the horizon.
ETH-BTC Short Term Price Prediction
If the bulls break above 0.0317 BTC, resistance is expected at 0.0328 BTC (1.414 Fib Extension), 0.0337 BTC, and 0.0346 BTC (1.618 Fib Extension).
On the other side, the first level of support lies at 0.03 BTC. Beneath this, added support is found at 0.0297 BTC (.236 Fib Retracement), 0.029 BTC, and 0.0279 BTC (.382 Fib Retracement).
Likewise, the RSI has reached extremely overbought levels that have not been seen since Feb 2020. Additionally, the Stochastic RSI is primed for a bearish crossover signal that should send the market lower.