Ethereum fell by another 14% over the past 24 hours of trading as the cryptocurrency briefly slips to 0. This is a 35% drop over the past four days.The cryptocurrency dropped beneath the 0 support today, primarily driven by the new coronavirus financial crisis.Against Bitcoin, ETH broke beneath the previous strong support at 0.0247 BTC to reach below 0.0228 BTC.Key Support & Resistance LevelsETH/USD:Support:5, 0, 2.Resistance: 1, 0, 0.ETH/BTC:Support: 0.0225 BTC, 0.0223 BTC, 0.0221 BTC.Resistance: 0.023 BTC, 0.0235 BTC, 0.024 BTC.ETH/USD – ETH Drops Beneath 0Since our last analysis, ETH plunged beneath the support at 0 and continued to decline beneath the support at 0 provided by the 200-days EMA. It sank beneath added support at 5 and 0 to reach the
Topics:
Yaz Sheikh considers the following as important: ETH Analysis, ETHBTC, Ethereum (ETH) Price, ethusd
This could be interesting, too:
Mandy Williams writes Ethereum Derivatives Metrics Signal Modest Downside Tail Risk Ahead: Nansen
Jordan Lyanchev writes Weekly Bitcoin, Ethereum ETF Recap: Light at the End of the Tunnel for BTC
CryptoVizArt writes Will Weak Momentum Drive ETH to .5K? (Ethereum Price Analysis)
Jordan Lyanchev writes Bybit Hack Fallout: Arthur Hayes, Samson Mow Push for Ethereum Rollback
- Ethereum fell by another 14% over the past 24 hours of trading as the cryptocurrency briefly slips to $160. This is a 35% drop over the past four days.
- The cryptocurrency dropped beneath the $190 support today, primarily driven by the new coronavirus financial crisis.
- Against Bitcoin, ETH broke beneath the previous strong support at 0.0247 BTC to reach below 0.0228 BTC.
Key Support & Resistance Levels
ETH/USD:
Support:$165, $160, $152.
Resistance: $171, $180, $190.
ETH/BTC:
Support: 0.0225 BTC, 0.0223 BTC, 0.0221 BTC.
Resistance: 0.023 BTC, 0.0235 BTC, 0.024 BTC.
ETH/USD – ETH Drops Beneath $170
Since our last analysis, ETH plunged beneath the support at $200 and continued to decline beneath the support at $190 provided by the 200-days EMA. It sank beneath added support at $185 and $170 to reach the current trading level of $186.
The drop is driven by the fact that President Trump announced that the US would close its borders to all European visitors. This sparked a “risk-on” move within the global market, and Bitcoin was included within the uncertainty – causing the other cryptocurrencies to plummet even further.
Ethereum is now strongly bearish, and we could see the cryptocurrency dropping as low as $145 over the next few days.
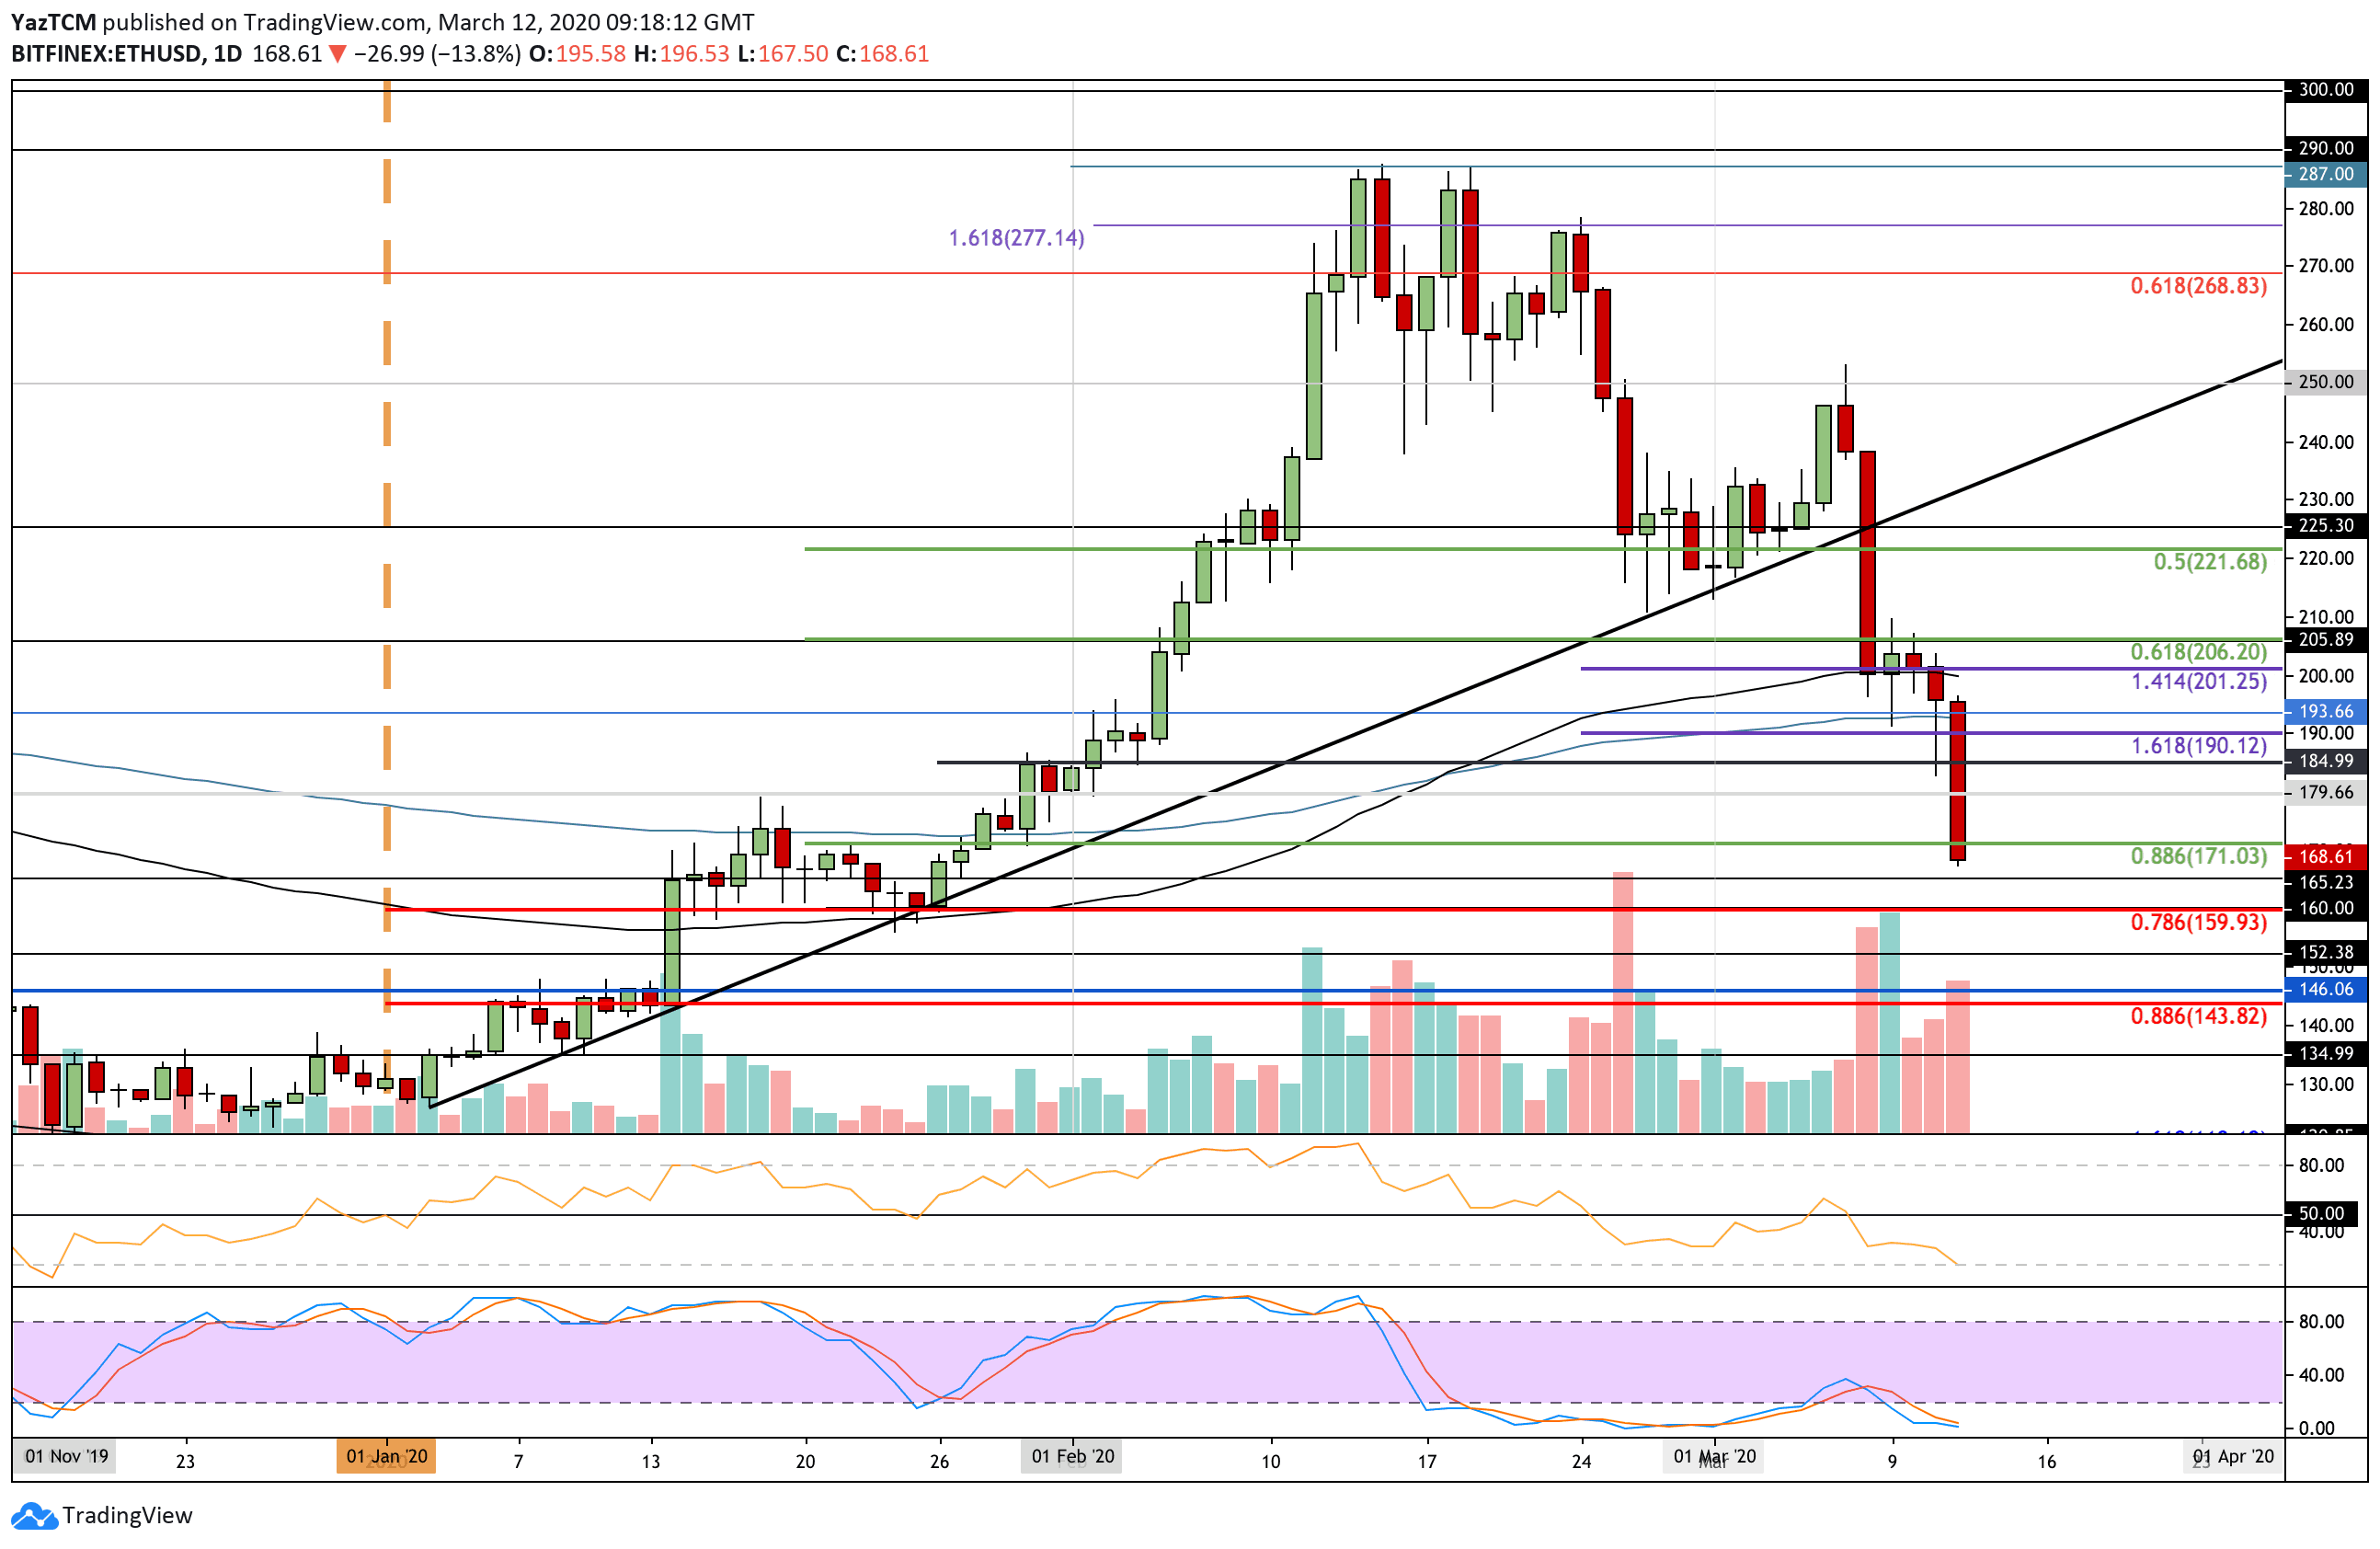
ETH-USD Short Term Price Prediction
From below, the first level of support is located at $165. This is followed with support at $160, which is provided by the .786 Fibonacci Retracement level. Beneath this, additional support lies at $152, $146, and $144 (.886 Fib Retracement level).
From above, resistance lies at $171, $180, and $190.
The RSI has dropped into extremely oversold conditions with the latest price declines. Additionally, the Stochastic RSI is in oversold conditions as we wait for a bullish crossover signal.
ETH/BTC – ETH Breaks 0.024 BTC Support and Plummets
Against Bitcoin, Ethereum dropped beneath the previous strong support at 0.0247 BTC, provided by the .382 Fib Retracement. The cryptocurrency continued to fall further lower as it broke beneath support at 0.0235 BTC and 0.023 BTC to reach the current support at 0.0228 BTC, provided by a downside 1.414 Fibonacci Extension.
The break beneath 0.0247 BTC has now turned Ethereum bearish against Bitcoin, which is why the Etheruem price drop is so steep today.
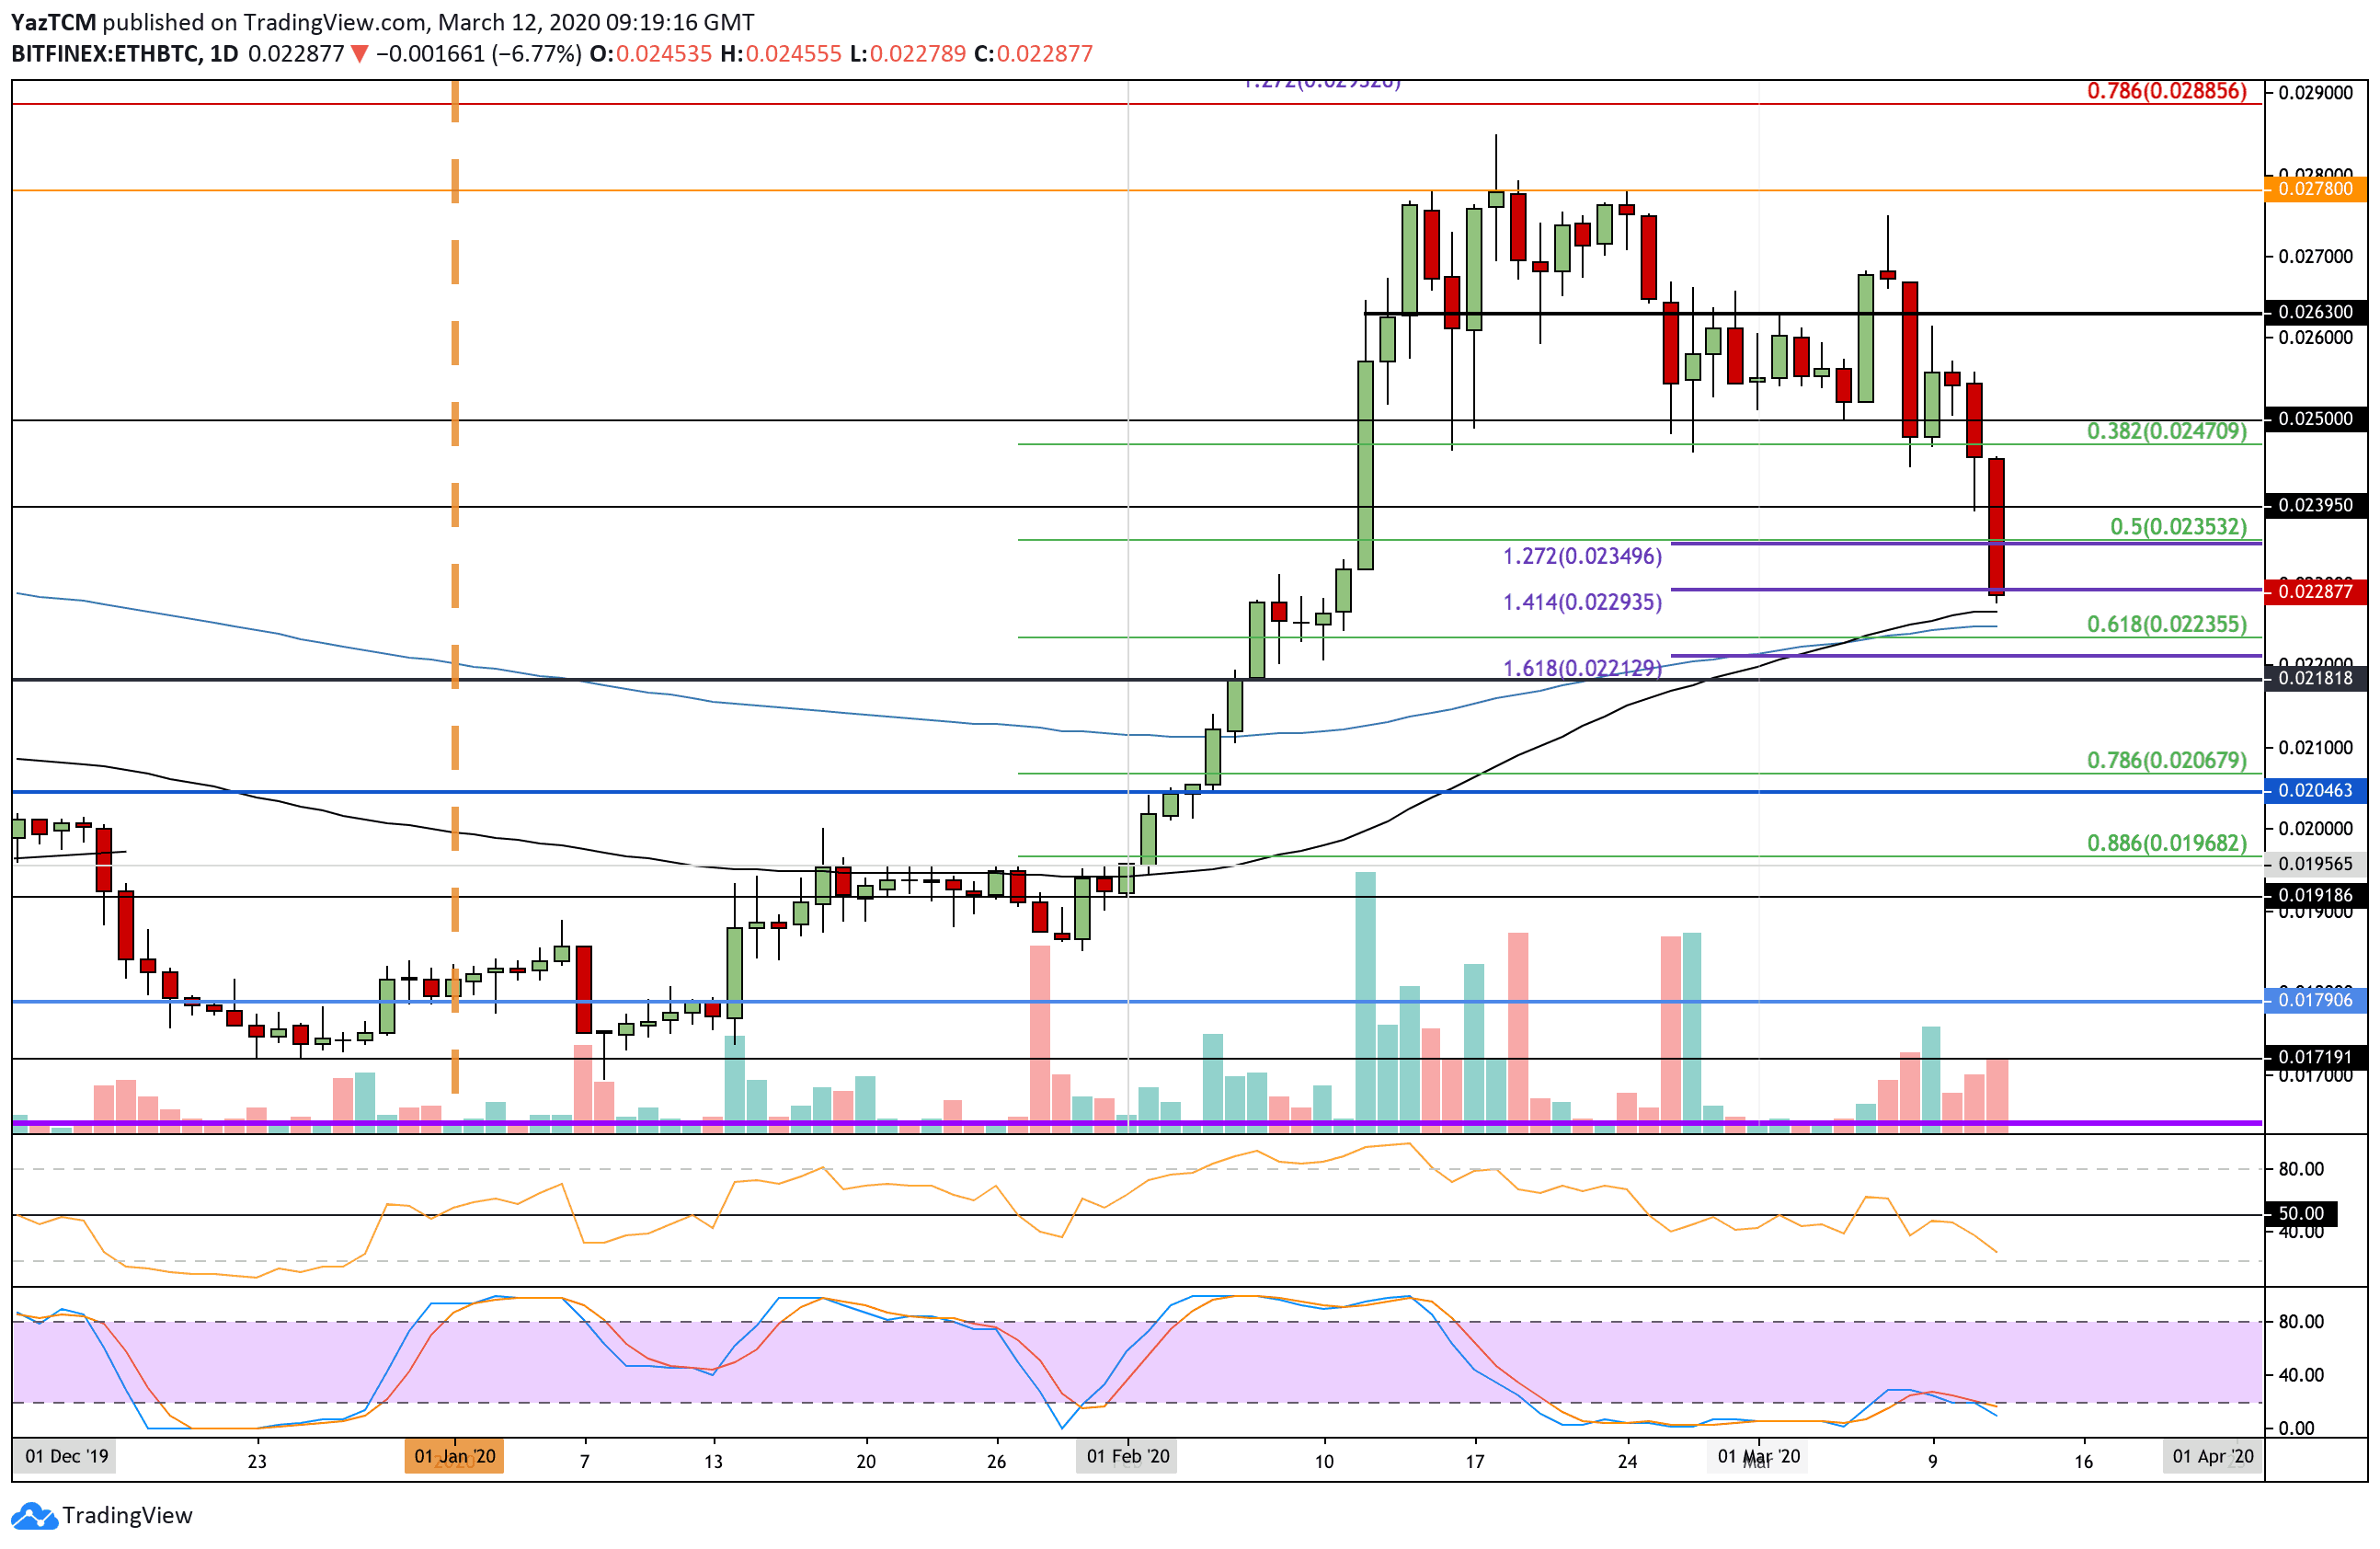
ETH-BTC Short Term Price Prediction
From below, the first level of support lies around 0.0225 BTC, which contains both the 100-days and 200-days EMA. Beneath this, support lies at 0.0223 BTC (.618 Fib Retracement), 0.0221 BTC (downside 1.618 Fib Extension) and 0.0218 BTC.
On the other side, resistance lies at 0.023 BTC, 0.0235 BTC, and 0.024 BTC.
The RSI has also plummetted toward oversold conditions; however, it is not quite there yet, which shows there is still room for some more selling pressure on the way.