Ethereum decreased by 8.5% today as the cryptocurrency struggles to hold the support at the 0 level.This price drop is largely a result of Bitcoin falling below ,000 as it returns to ,800.Ethereum has been declining against Bitcoin all month as the buyers battle to keep the coin above the 0.021 BTC level.Key Support & Resistance LevelsETH/USD:Support: 0, 0, 5.Resistance: 5, 0, 5.ETH/BTC:Support: 0.021 BTC, 0.0204 BTC, 0.02 BTC.Resistance: 0.0215 BTC, 0.022 BTC, 0.0225 BTC.ETH/USD: Bearish Momentum Gathers SteamAfter rolling over at 5 earlier in the week, Ethereum has continued to drop as the buyers try to keep the coin above the 0 support.It is still trading sideways within a range between 5 and 0, however, a drop beneath 0 is likely to put the coin
Topics:
Yaz Sheikh considers the following as important: ETH Analysis, Ethereum (ETH) Price
This could be interesting, too:
Mandy Williams writes Ethereum Derivatives Metrics Signal Modest Downside Tail Risk Ahead: Nansen
CryptoVizArt writes Will Weak Momentum Drive ETH to .5K? (Ethereum Price Analysis)
Mandy Williams writes Ethereum Key Metrics Point to Persistent Bullish Outlook for ETH: CryptoQuant
CryptoVizArt writes Ethereum Price Analysis: Following a 15% Weekly Crash, What’s Next for ETH?
- Ethereum decreased by 8.5% today as the cryptocurrency struggles to hold the support at the $120 level.
- This price drop is largely a result of Bitcoin falling below $6,000 as it returns to $5,800.
- Ethereum has been declining against Bitcoin all month as the buyers battle to keep the coin above the 0.021 BTC level.
Key Support & Resistance Levels
ETH/USD:
Support: $120, $110, $105.
Resistance: $135, $150, $165.
ETH/BTC:
Support: 0.021 BTC, 0.0204 BTC, 0.02 BTC.
Resistance: 0.0215 BTC, 0.022 BTC, 0.0225 BTC.
ETH/USD: Bearish Momentum Gathers Steam
After rolling over at $135 earlier in the week, Ethereum has continued to drop as the buyers try to keep the coin above the $120 support.
It is still trading sideways within a range between $135 and $110, however, a drop beneath $120 is likely to put the coin back a the bottom boundary of the range and, perhaps, even beneath $100.
A rebound from $120 would be promising, however, it is unlikely to come if Bitcoin itself continues to drop further beneath $5,800.
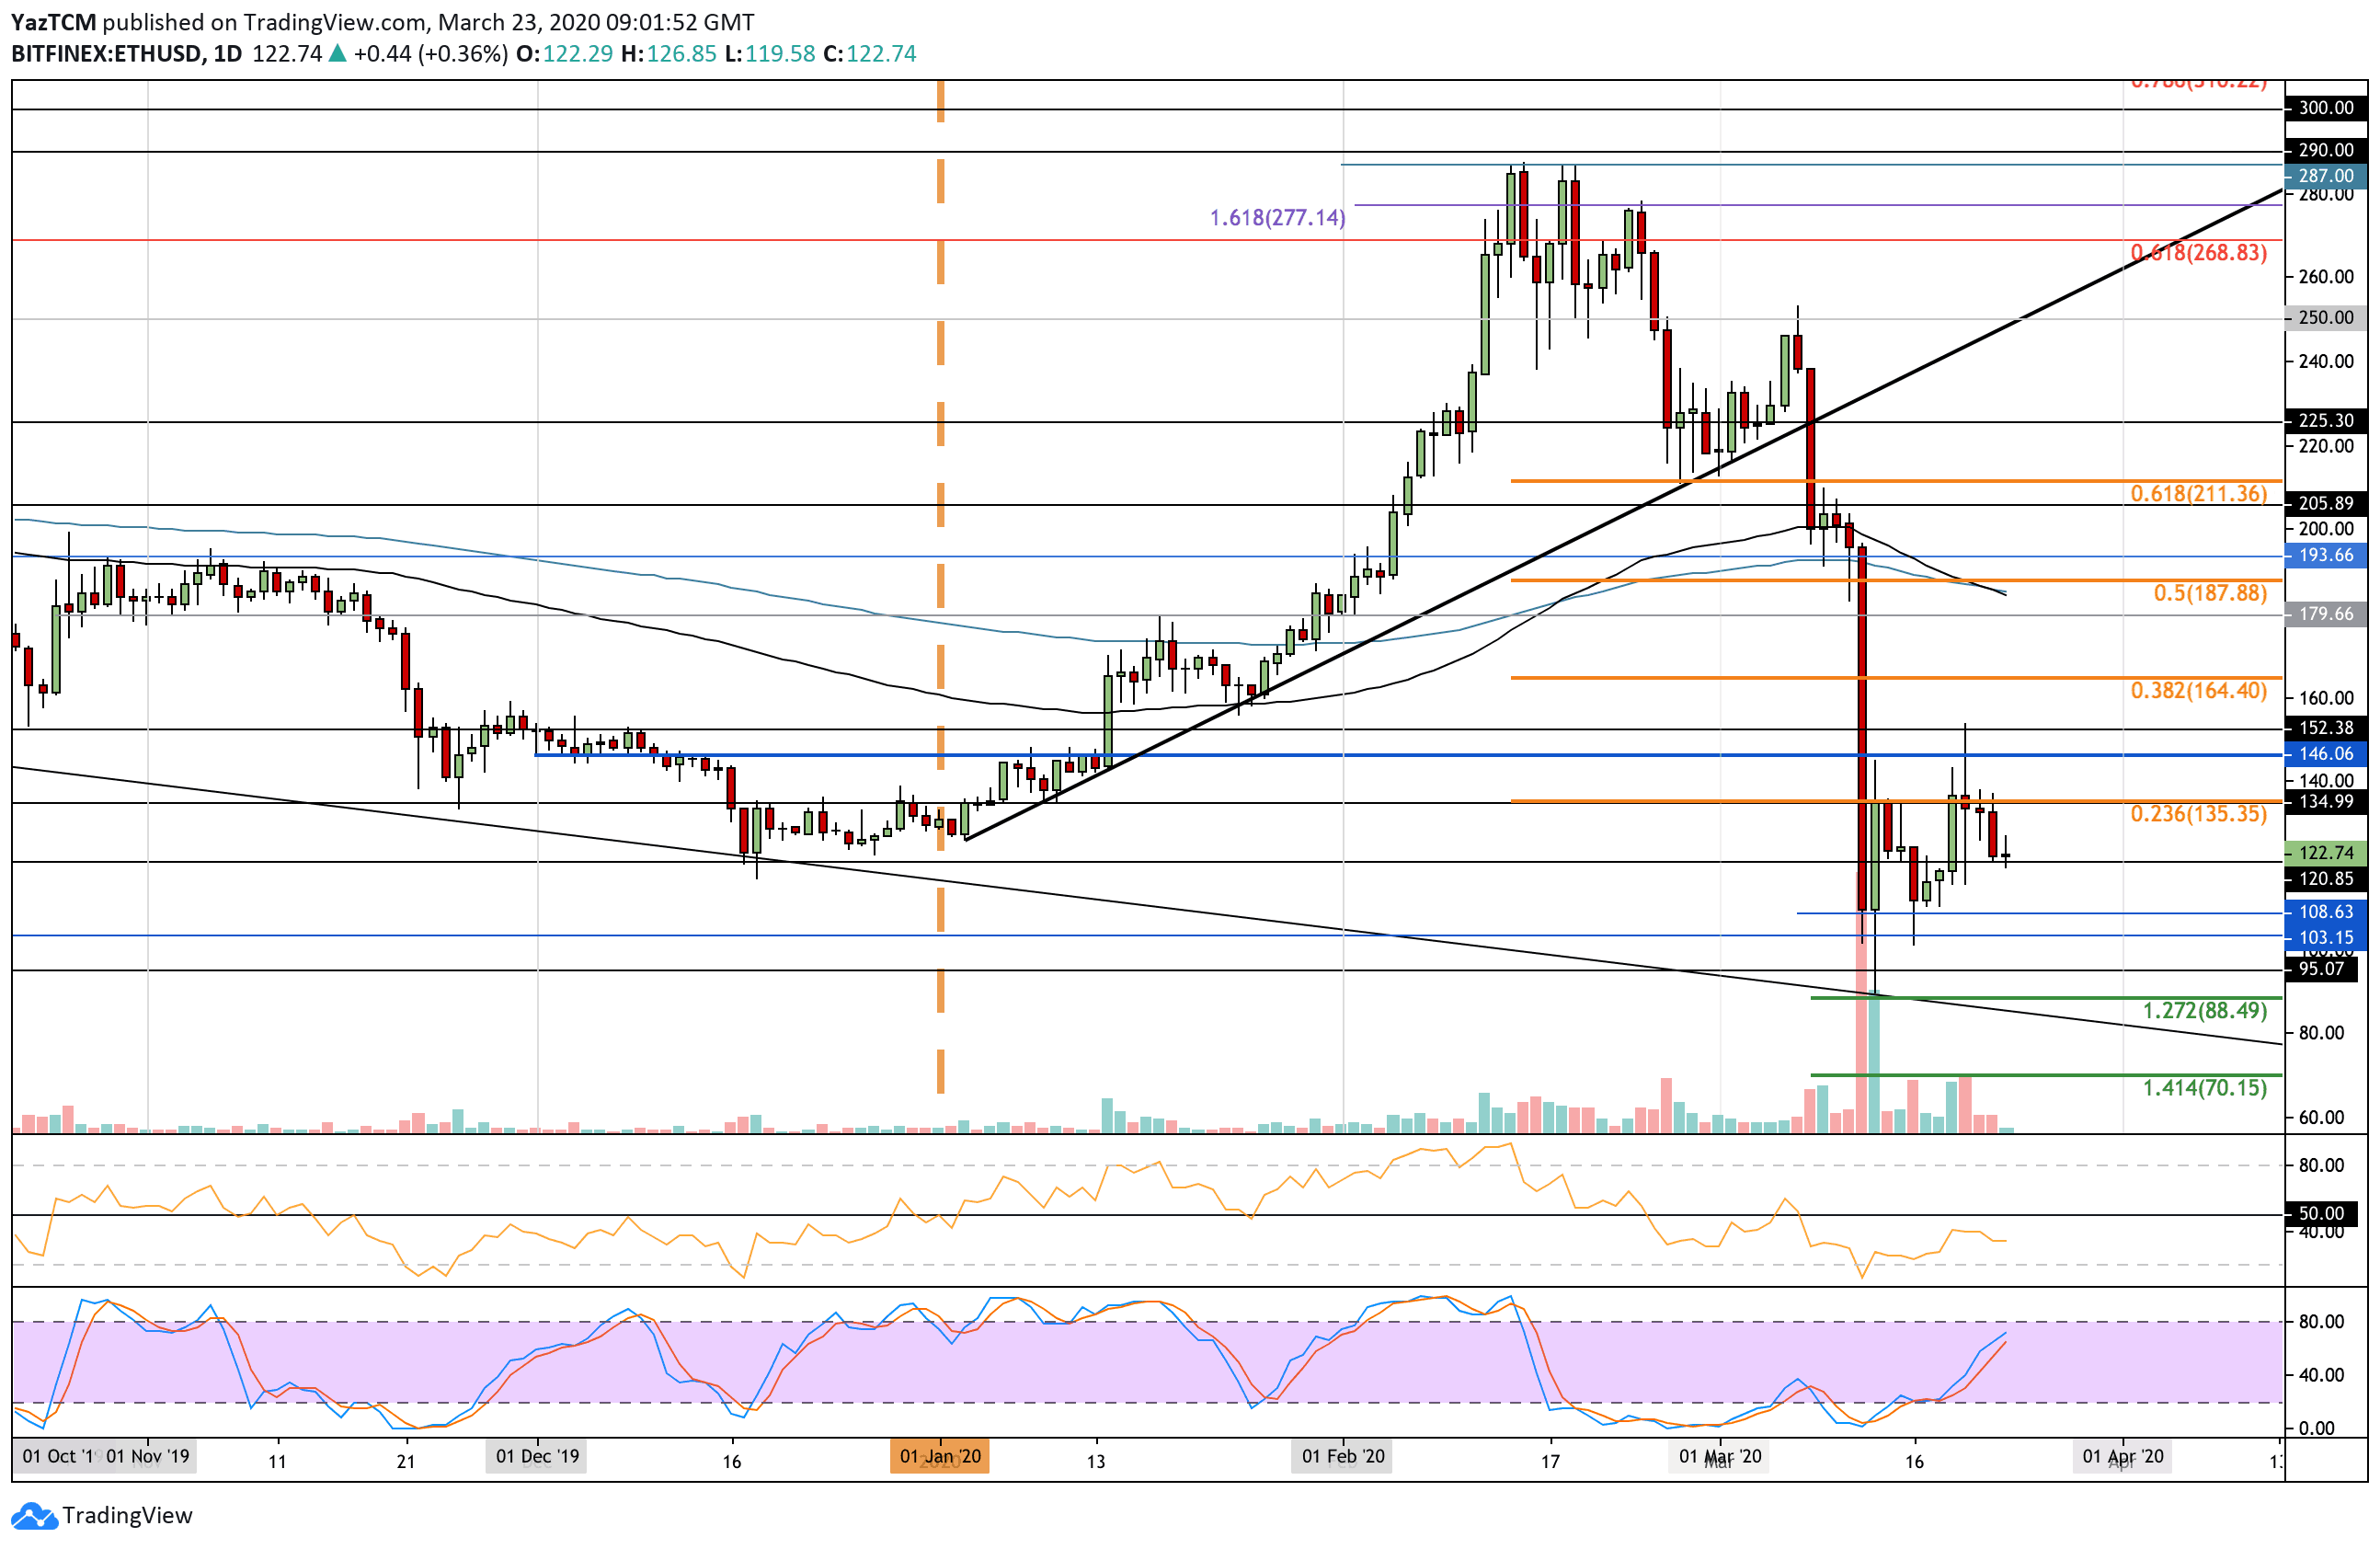
ETH/USD Short Term Price Prediction
Once $120 is broken, we can expect immediate support at $110. This is followed up with support at $105 and $100. Beneath $100, additional support is expected at $95, $90, and $80.
On the other hand, if the bulls can rebound at $120 and push higher, the first level of resistance lies at $135. This is followed by resistance at $150, $165, and $180.
The RSI was climbing but has started to flatten out as the sellers begun to battle to increase their momentum within the market. If it heads lower, Ethereum can be expected to head toward $110 at the very least.
Additionally, the Stochastic RSI is approaching oversold conditions and looks like it is primed for a bearish crossover signal which will help the case for the sellers.
ETH/BTC – ETH Bulls Battle For Support At 0.021 BTC
Against Bitcoin, Ethereum continued to struggle after breaking beneath the support at 0.0215 BTC provided by the .618 Fib Retracement. It has since declined as the buyers attempt to keep the price above 0.021 BTC.
A drop beneath 0.02 BTC could be devastating for Ethereum and would likely result in the coin heading back toward the 2020 lows at around 0.017 BTC.
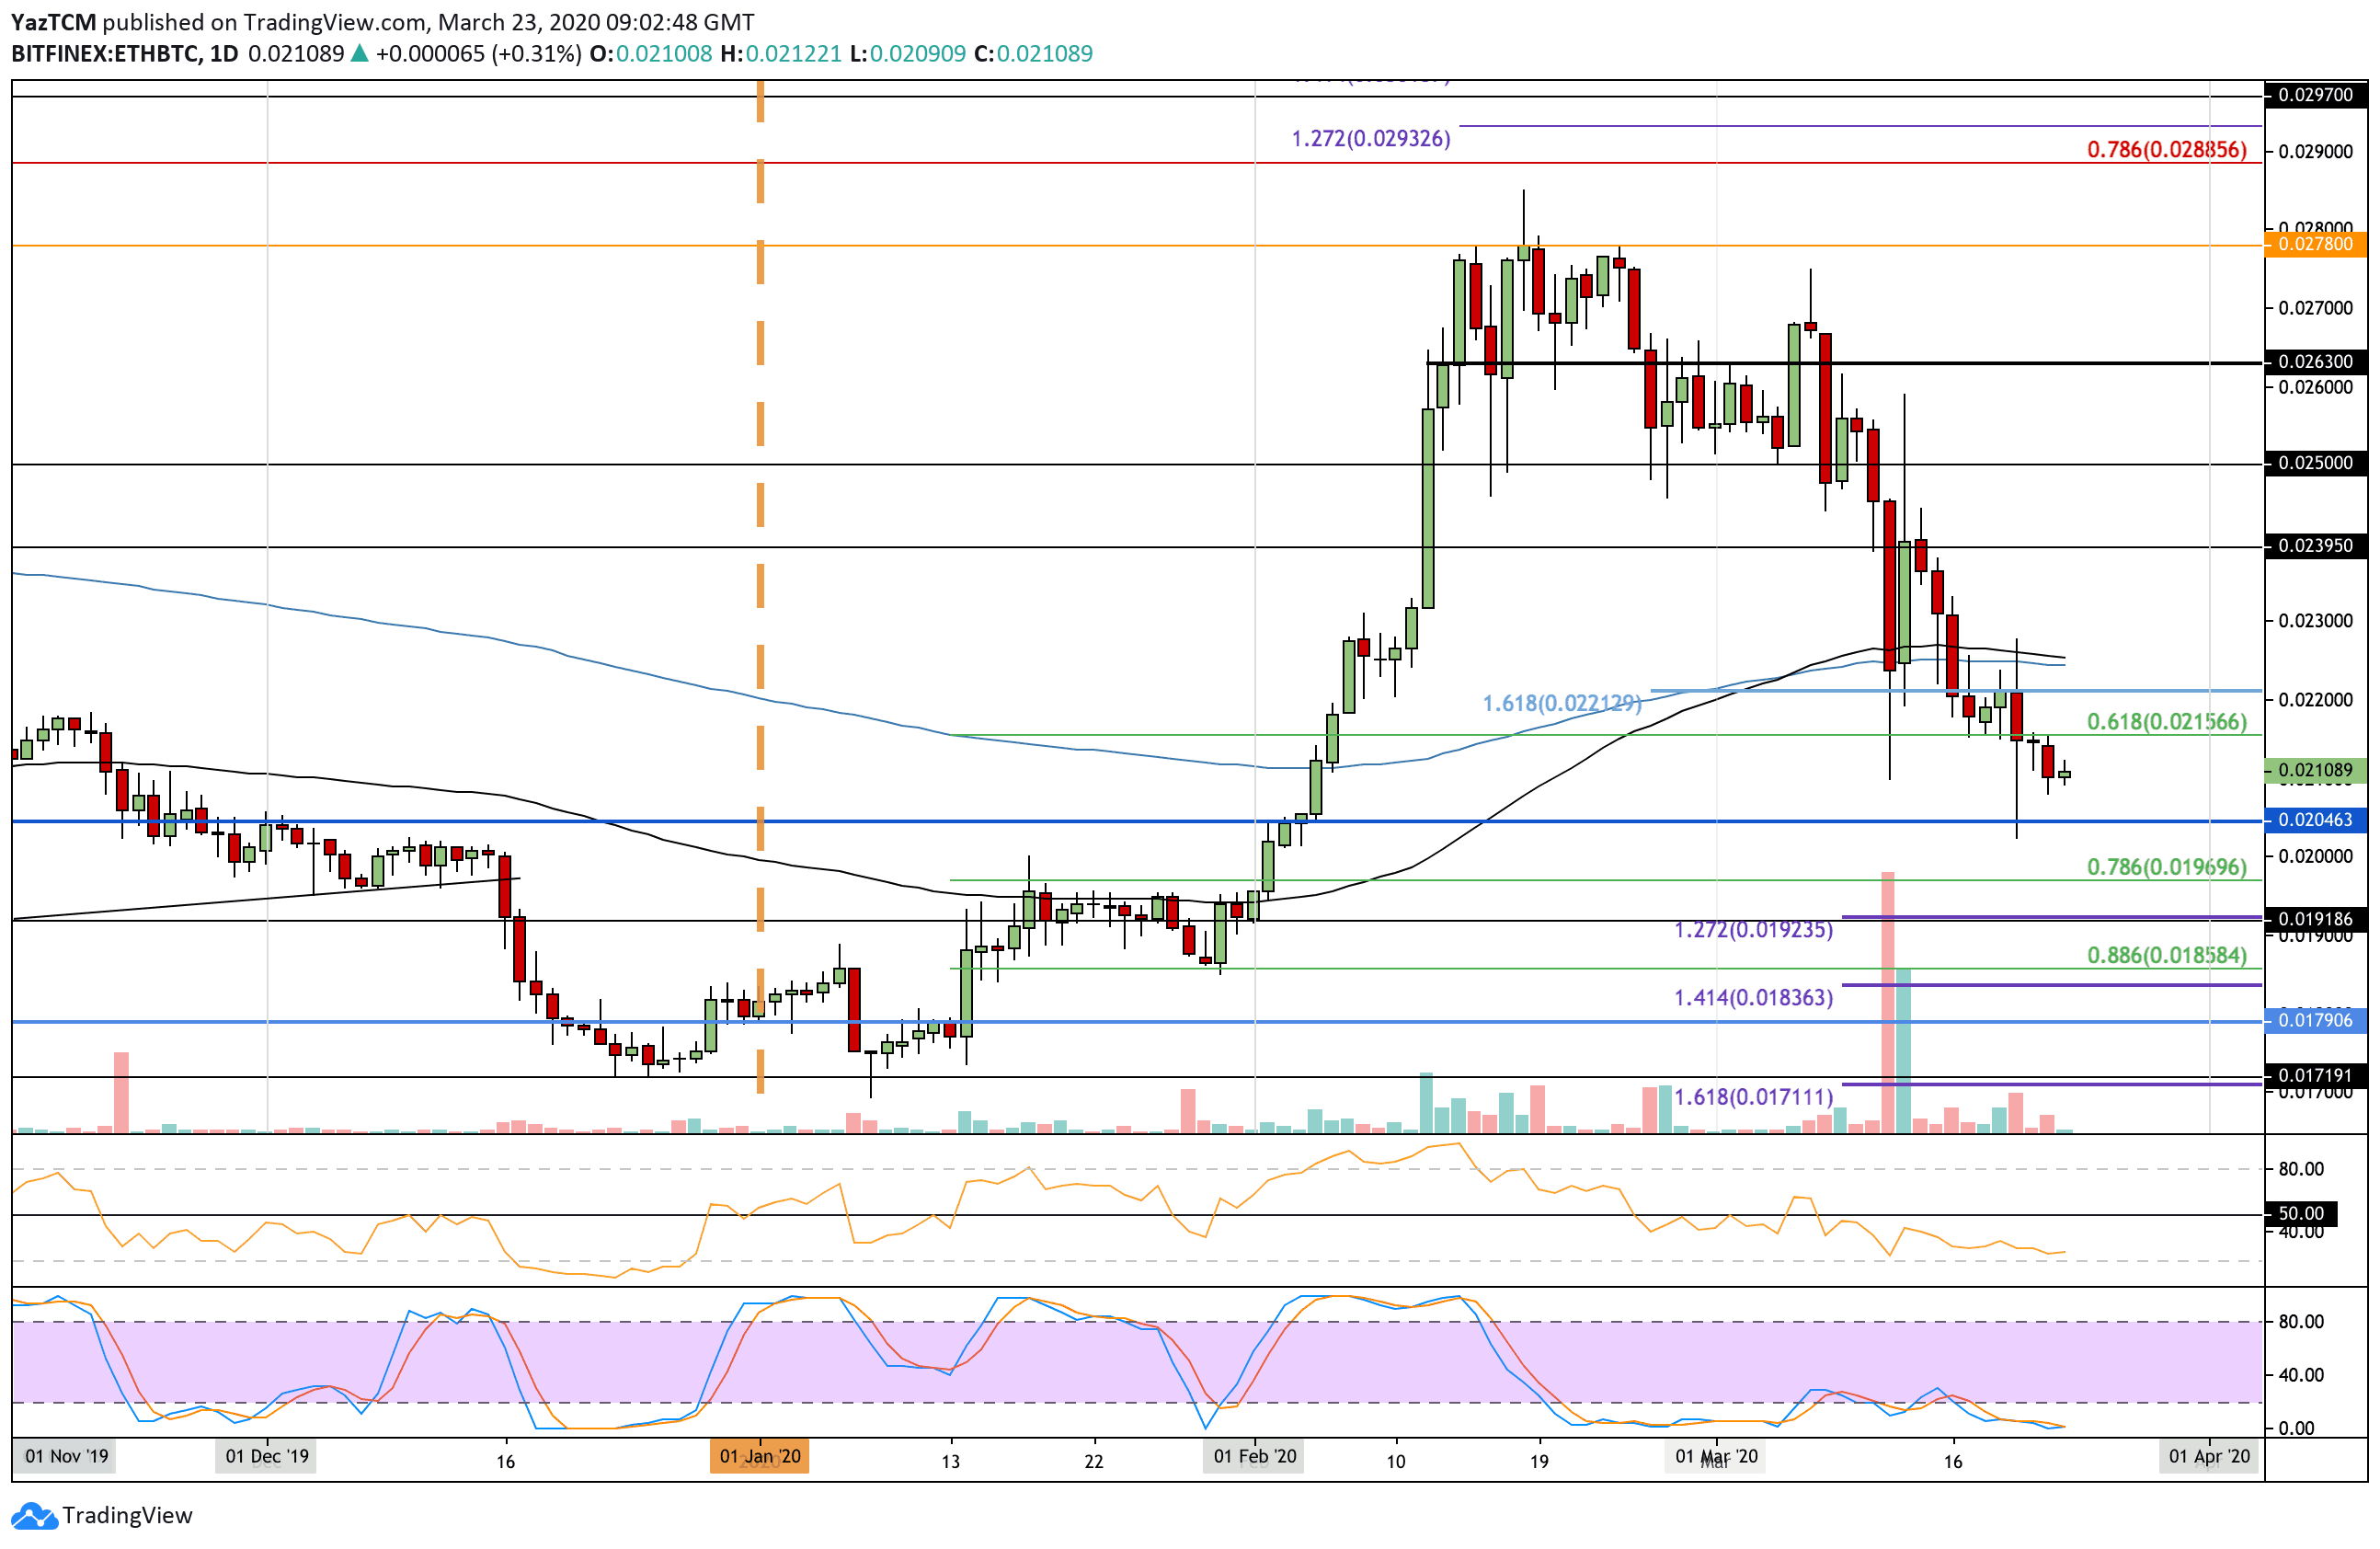
ETH/BTC Short Term Price Prediction
If 0.021 BTC is breached, the first level of support lies at 0.0204 BTC. This is followed by support at 0.020 BTC, 0.0196 BTC (.786 Fib Retracement), and 0.0192 BTC. Beneath 0.019 BTC, added support lies at 0.0185 BTC (.886 Fib Retracement), and 0.0183 BTC.
On the other hand, if the bulls can rebound from 0.021 BTC, the first level of resistance lies at 0.0215 BTC. This is followed by resistance at 0.022 BTC and 0.0225 BTC (100-days and 200-days EMA’s).
The RSI is headed back toward oversold conditions as the sellers continue to dominate the market momentum. If it can start to rise, this will serve as the first signal that the selling pressure is starting to fade.