Ethereum continues to struggle as it remains beneath 0 today with a small decline.The cryptocurrency fell below the ascending triangle consolidation pattern, bringing in another bearish scenario for ETH.Against Bitcoin, Ethereum managed to rebound from support at 0.0201 BTC to climb back above 0.021 BTC.Key Support & Resistance LevelsETH/USD:Support: 8, 0, 0.Resistance: 5, 0, 0.ETH/BTC:Support: 0.021 BTC, 0.0201 BTC, 0.0196 BTC.Resistance: 0.0215 BTC, 0.022 BTC, 0.0225 BTC.ETH/USD: Breaks Below Ascending TriangleEthereum was trading sideways within a consolidation pattern for the past 2-weeks but recently dropped beneath the triangle as the selling momentum starts to gather some steam again.It was expected that ETH would break beneath this triangle as the previous
Topics:
Yaz Sheikh considers the following as important: ETH Analysis, Ethereum (ETH) Price
This could be interesting, too:
Mandy Williams writes Ethereum Derivatives Metrics Signal Modest Downside Tail Risk Ahead: Nansen
CryptoVizArt writes Will Weak Momentum Drive ETH to .5K? (Ethereum Price Analysis)
Mandy Williams writes Ethereum Key Metrics Point to Persistent Bullish Outlook for ETH: CryptoQuant
CryptoVizArt writes Ethereum Price Analysis: Following a 15% Weekly Crash, What’s Next for ETH?
- Ethereum continues to struggle as it remains beneath $130 today with a small decline.
- The cryptocurrency fell below the ascending triangle consolidation pattern, bringing in another bearish scenario for ETH.
- Against Bitcoin, Ethereum managed to rebound from support at 0.0201 BTC to climb back above 0.021 BTC.
Key Support & Resistance Levels
ETH/USD:
Support: $128, $120, $110.
Resistance: $135, $140, $150.
ETH/BTC:
Support: 0.021 BTC, 0.0201 BTC, 0.0196 BTC.
Resistance: 0.0215 BTC, 0.022 BTC, 0.0225 BTC.
ETH/USD: Breaks Below Ascending Triangle
Ethereum was trading sideways within a consolidation pattern for the past 2-weeks but recently dropped beneath the triangle as the selling momentum starts to gather some steam again.
It was expected that ETH would break beneath this triangle as the previous trend was extremely bearish. It is currently trading at short term support at $128 (short term .382 Fib Retracement) but it is likely that ETH will now be headed back to $110 and, possibly, even lower.

ETH/USD: Short Term Price Prediction
Once the support at $128 is broken, the next level of support lies at $120. Beneath this, additional support can be found at $110, $108, $105, and $100. If ETH breaks $100, support is expected at $95 and $88.50.
Toward the upside, resistance lies at $135, $140, $145, and $150.
The RSI recently turned away from the 50 level to show that the buyers are still unable to take charge of the market momentum. The recent RSI drop shows that the selling momentum is starting to gather steam and if it falls lower, ETH is likely to head toward $110.
Furthermore, the Stochastic RSI produced a bearish crossover signal in the overbought territory to add to the bearish scenario.
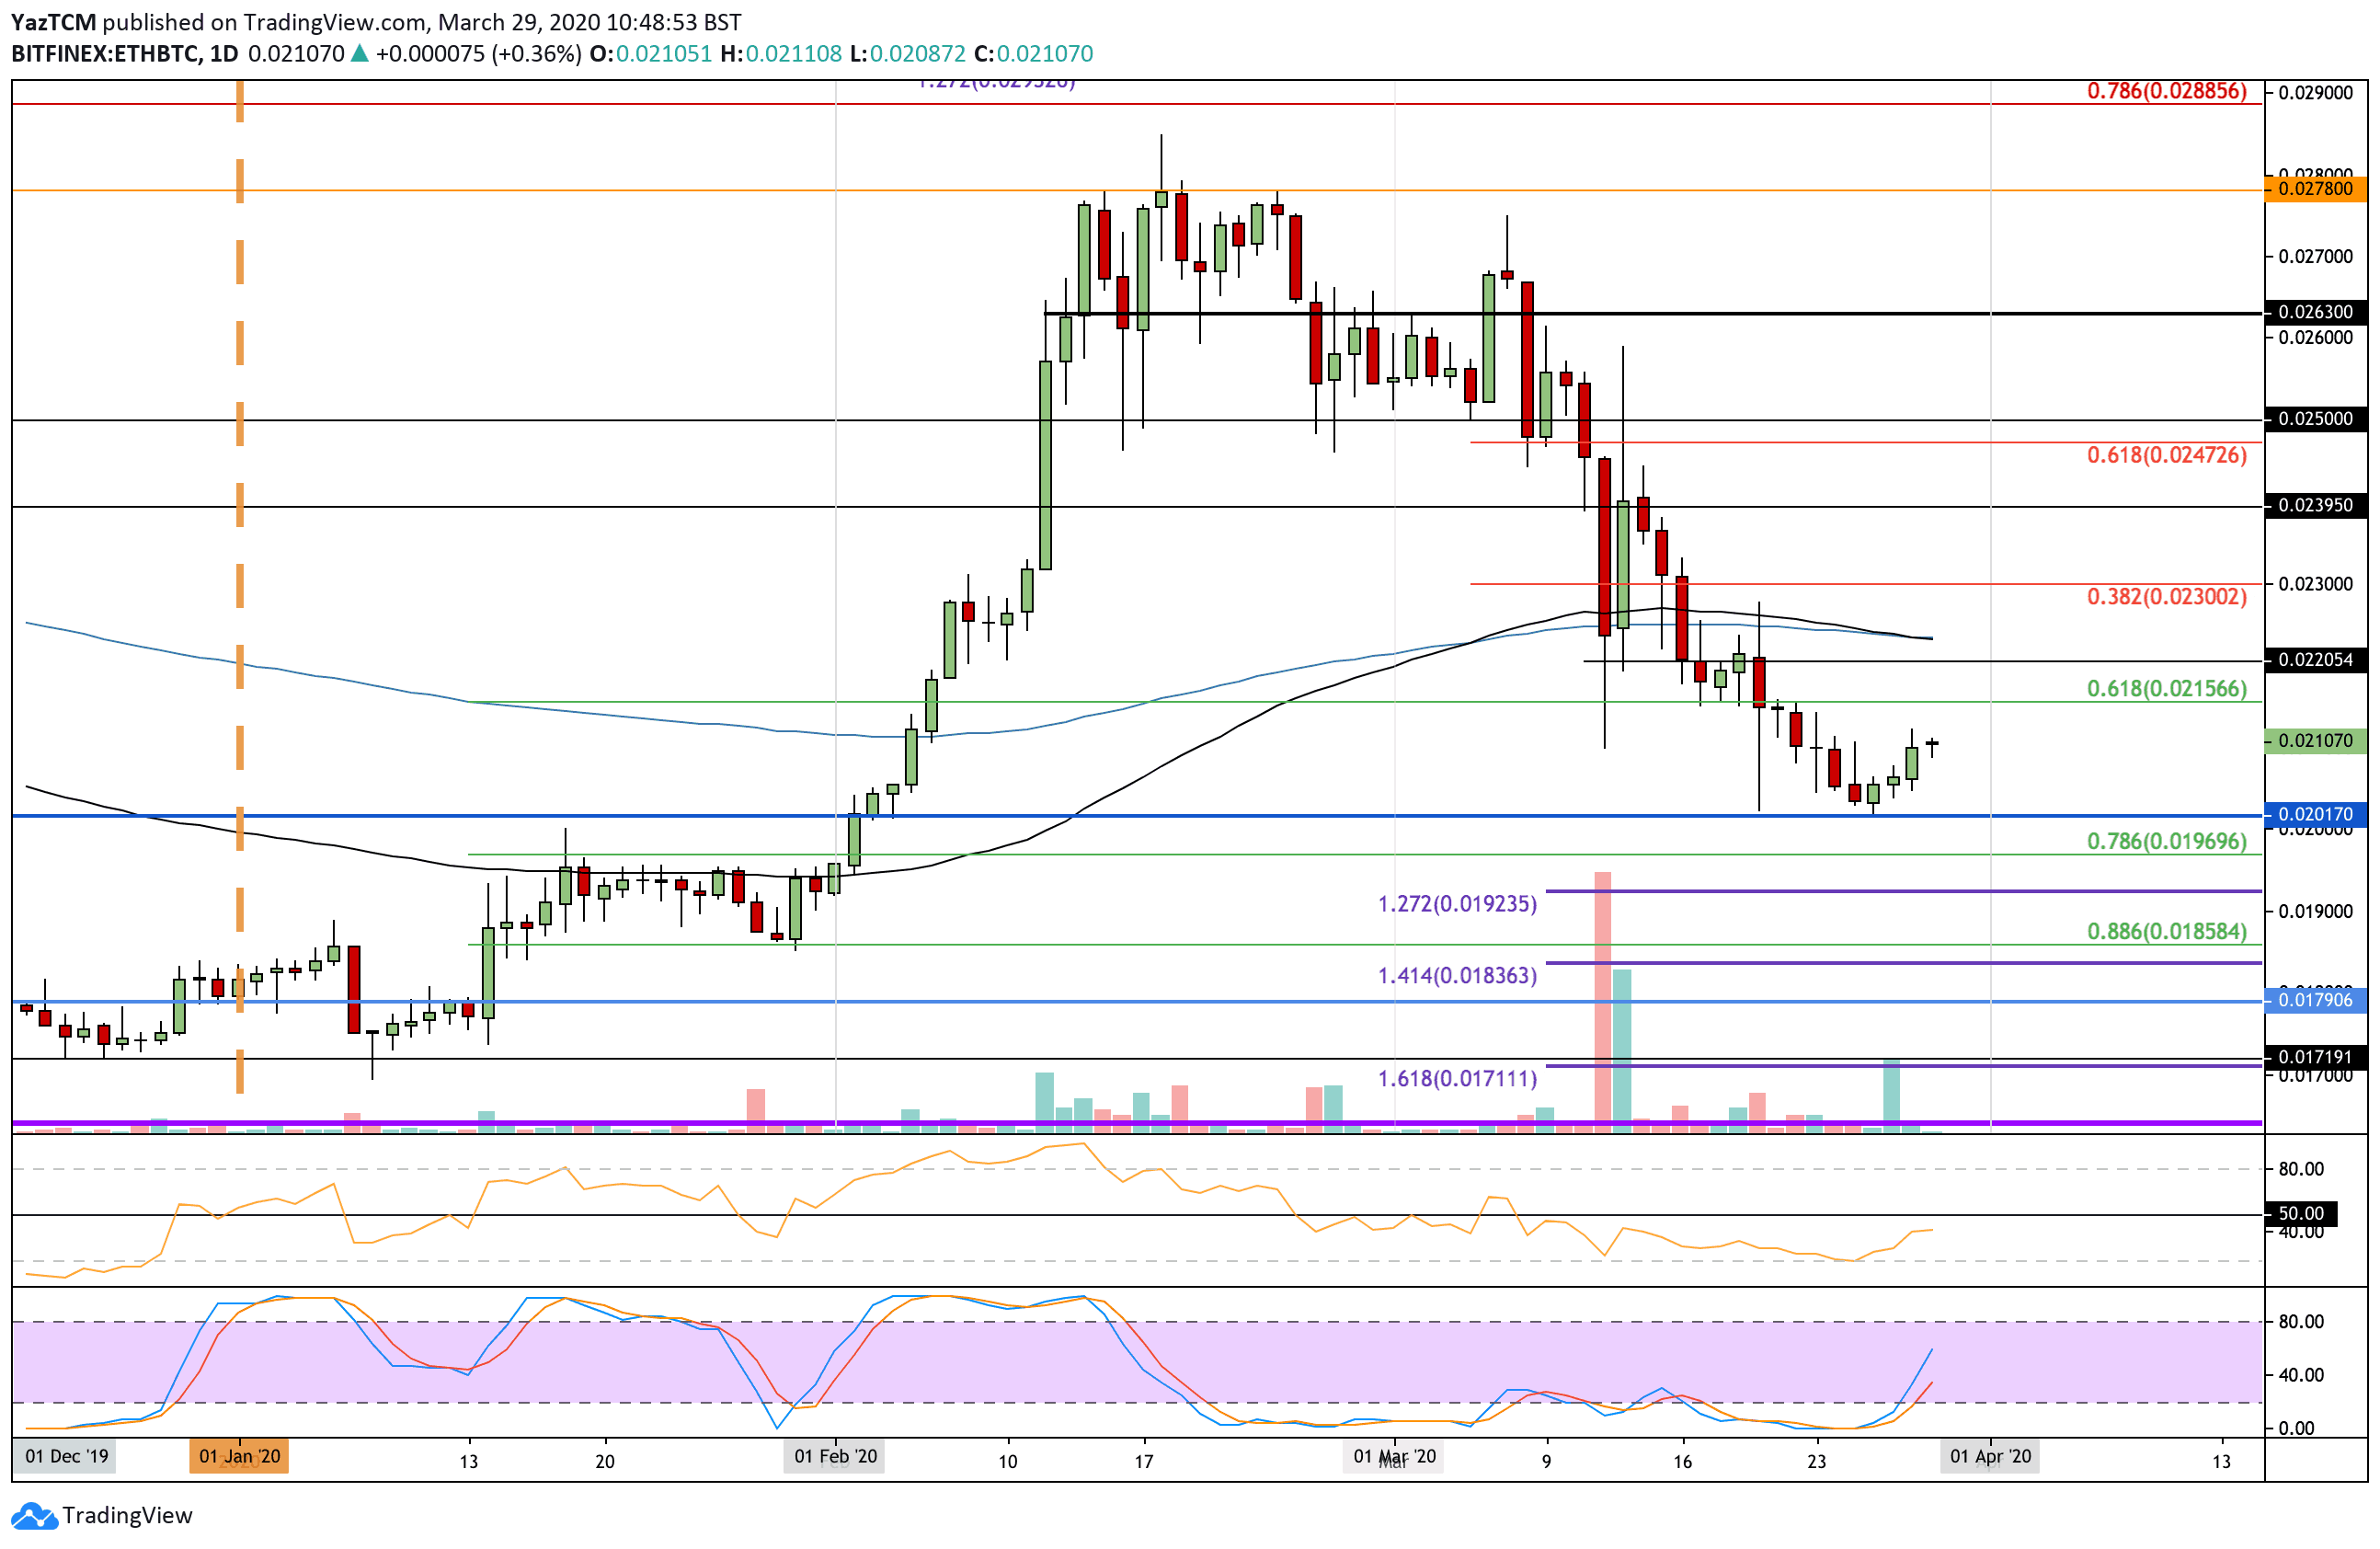
ETH/BTC: ETH Climbs Back Above 0.021 BTC
Against Bitcoin, Ethereum continued to rebound higher from the support at 0.0201 BTC. It previously broke strong support at 0.0215 BTC to drop as low as 0.0201 BTC but has since rebounded to climb back above 0.021 BTC today.
If ETH can continue to rise against Bitcoin, this should help prevent ETH/USD from slipping beneath $100 if BTC/USD continues to drop.
ETH-BTC Short Term Price Prediction
If the buyers continue to push ETH above 0.0215 BTC, resistance is located at 0.022 BTC and 0.0225 BTC (100-days and 200-days EMA’s). Above this, resistance is expected at 0.023 BTC (bearish .382 Fib Retracement).
From below, if the sellers break 0.021 BTC, support lies at 0.201 BTC and 0.02 BTC. Beneath this, support is located at 0.0196 BTC (.786 Fib Retracement).
The Stochastic RSI recently produced a bullish crossover signal in oversold conditions that helped ETH rise against BTC. Additionally, the RSI is also increasing which shows that the selling momentum is started to fade in the short term.