Ethereum saw a 2.7% price hike today as it reached 5.The cryptocurrency rebounded from the rising trend line to push higher and keep the bull run alive.Against Bitcoin, Ethereum also bounced higher from 0.0245 BTC to reach the June resistance at 0.0253 BTC.Key Support & Resistance LevelsETH/USD:Support: 5, 5, 0.Resistance: 0, 5, 5.ETH/BTC:Support: 0.025 BTC, 0.0243 BTC, 0.0239 BTC.Resistance: 0.026 BTC, 0.0263 BTC, 0.0266 BTC.ETH/USD: Ethereum Rebounds From Rising Trend LineEthereum was on a decline over the past two weeks after falling from 0 to reach as low as 5. Despite this downturn, Ethereum managed to remain above a rising trend line that has been in play since March 2020 and recently rebounded from there.This allowed ETH to remain within its bullish
Topics:
Yaz Sheikh considers the following as important: ETH Analysis, ETHBTC, Ethereum (ETH) Price, ethusd
This could be interesting, too:
Mandy Williams writes Ethereum Derivatives Metrics Signal Modest Downside Tail Risk Ahead: Nansen
Jordan Lyanchev writes Weekly Bitcoin, Ethereum ETF Recap: Light at the End of the Tunnel for BTC
CryptoVizArt writes Will Weak Momentum Drive ETH to .5K? (Ethereum Price Analysis)
Jordan Lyanchev writes Bybit Hack Fallout: Arthur Hayes, Samson Mow Push for Ethereum Rollback
- Ethereum saw a 2.7% price hike today as it reached $245.
- The cryptocurrency rebounded from the rising trend line to push higher and keep the bull run alive.
- Against Bitcoin, Ethereum also bounced higher from 0.0245 BTC to reach the June resistance at 0.0253 BTC.
Key Support & Resistance Levels
ETH/USD:
Support: $225, $215, $210.
Resistance: $250, $265, $275.
ETH/BTC:
Support: 0.025 BTC, 0.0243 BTC, 0.0239 BTC.
Resistance: 0.026 BTC, 0.0263 BTC, 0.0266 BTC.
ETH/USD: Ethereum Rebounds From Rising Trend Line
Ethereum was on a decline over the past two weeks after falling from $250 to reach as low as $225. Despite this downturn, Ethereum managed to remain above a rising trend line that has been in play since March 2020 and recently rebounded from there.
This allowed ETH to remain within its bullish pattern as the buyers set their sights to break the $250 resistance next.
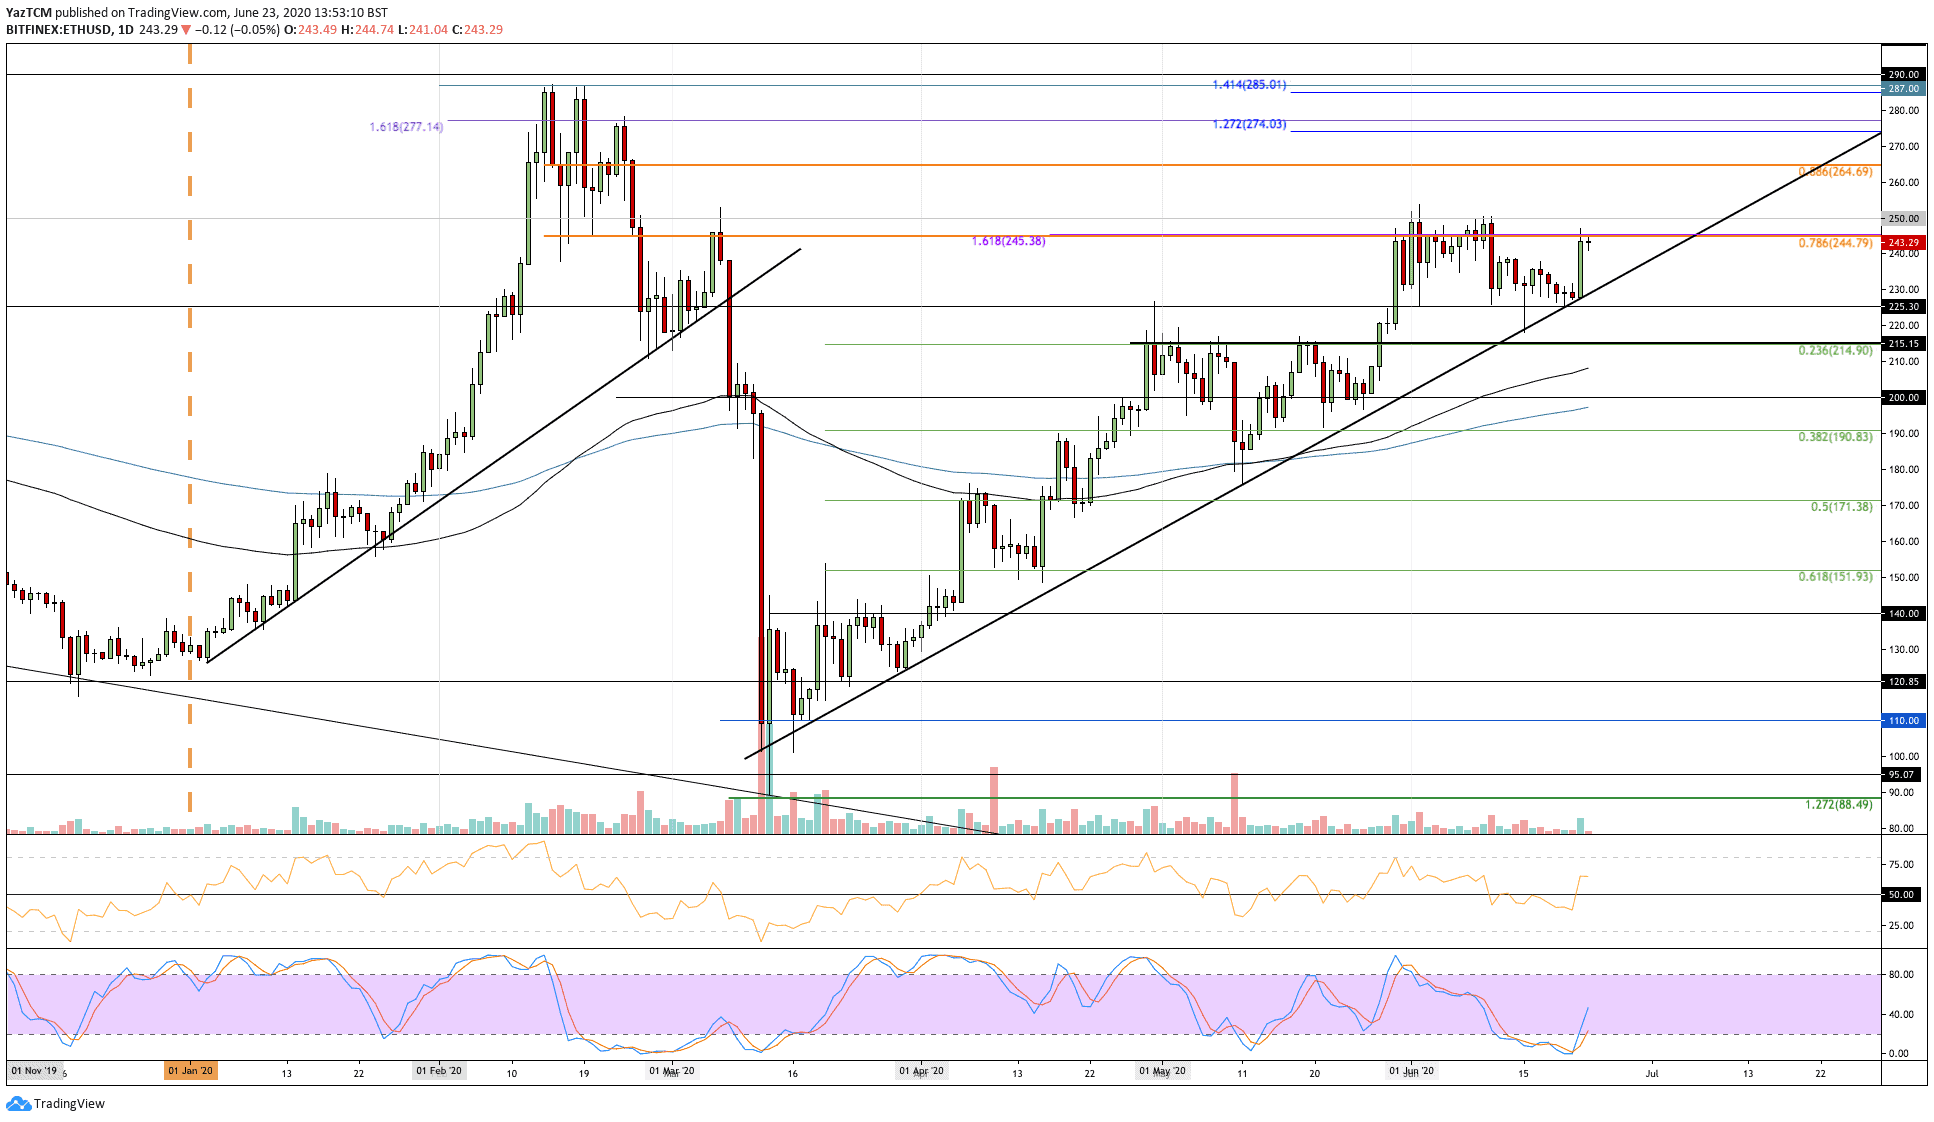
ETH/USD Short Term Price Prediction
Looking ahead, if the buyers push higher, the first level of resistance lies at $250. Above this, resistance is found at $265 (bearish .886 Fib Retracement), $275, and $285 (1.414 Fib Extension level).
Alternatively, if the sellers push lower, the first level of support is located at the rising trend line. Beneath this, support is found at $225, $215, and $200.
The RSI recently pushed above the 50 line to indicate that the buyers are in control of the market momentum. Additionally, the Stochastic RSI produced a bullish crossover signal showing that the bullish pressure is increasing.
ETH/BTC: ETH Returns To June 0.0253 BTC Resistance.
Against Bitcoin, Ethereum had found support at the 0.0243 BTC level (.236 Fib Retracement) last week. The coin bounced higher from there as it pushed back above 0.025 BTC yesterday to re-test the June high at 0.0253 BTC.
A break above 0.0253 BTC would allow ETH to continue higher toward the 2020 high at 0.0278 BTC.

ETH-BTC Short Term Price Prediction
Once the buyers break 0.0253 BTC, resistance is expected at 0.026 BTC (bearish .786 Fib Retracement), 0.0263 BTC, and 0.0266 BTC (bearish .886 Fib Retracement).
On the other side, the first level of support lies at 0.025 BTC. Beneath this, support is found at 0.0243 BTC (.236 Fib Retracement), 0.0239 BTC, and 0.0235 BTC.
The RSI has also risen above 50 to indicate the bullish momentum within the market. Furthermore, the Stochastic RSI produced a bullish crossover signal to help the bullish position.