Ethereum dropped since hitting the 2-year high at 8 over the weekend to reach 3.The coin spiked beneath 0 yesterday but found reliable support at 6.Against Bitcoin, Ethereum dropped from the 0.0371 BTC resistance to reach support at 0.0347 BTC (.236 Fib Retracement).ETH/USD: Momentum Reaches A Period Of IndecisionKey Support Levels: 8, 0, 0.Key Resistance Levels: 8, 5, 5.The bullish pressure has faded since ETH reached the 2-year high at 8 last week. The coin has since fallen into the support at 3 (previous flipped resistance) as the buyers defend the level.At the start of August, the coin struggled to pass the 0 level as it established a range between here and 3 (2019 high). The push toward 8 broke this range, and it seems that ETH is
Topics:
Yaz Sheikh considers the following as important: ETH Analysis, ETHBTC, Ethereum (ETH) Price, ethusd
This could be interesting, too:
Mandy Williams writes Ethereum Derivatives Metrics Signal Modest Downside Tail Risk Ahead: Nansen
Jordan Lyanchev writes Weekly Bitcoin, Ethereum ETF Recap: Light at the End of the Tunnel for BTC
CryptoVizArt writes Will Weak Momentum Drive ETH to .5K? (Ethereum Price Analysis)
Jordan Lyanchev writes Bybit Hack Fallout: Arthur Hayes, Samson Mow Push for Ethereum Rollback
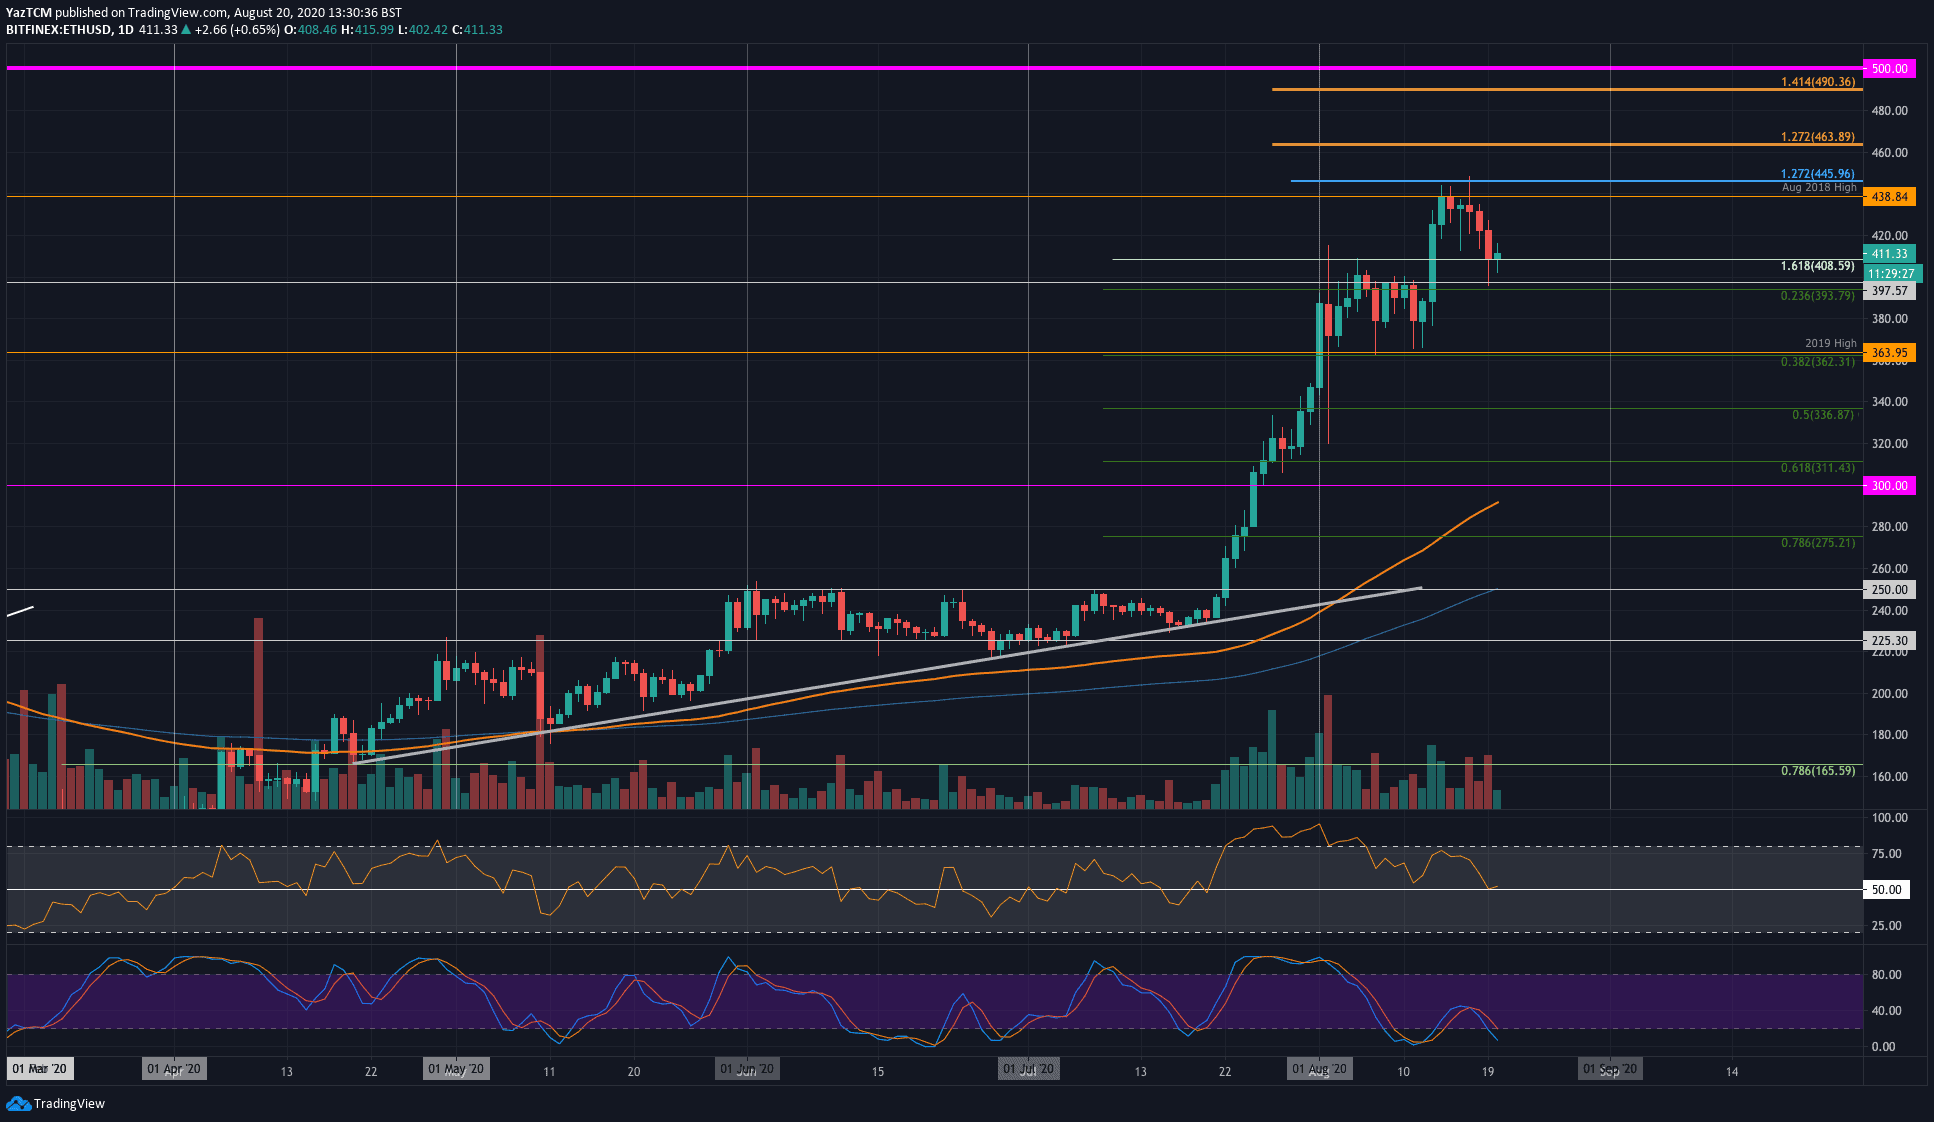
- Ethereum dropped since hitting the 2-year high at $438 over the weekend to reach $413.
- The coin spiked beneath $400 yesterday but found reliable support at $396.
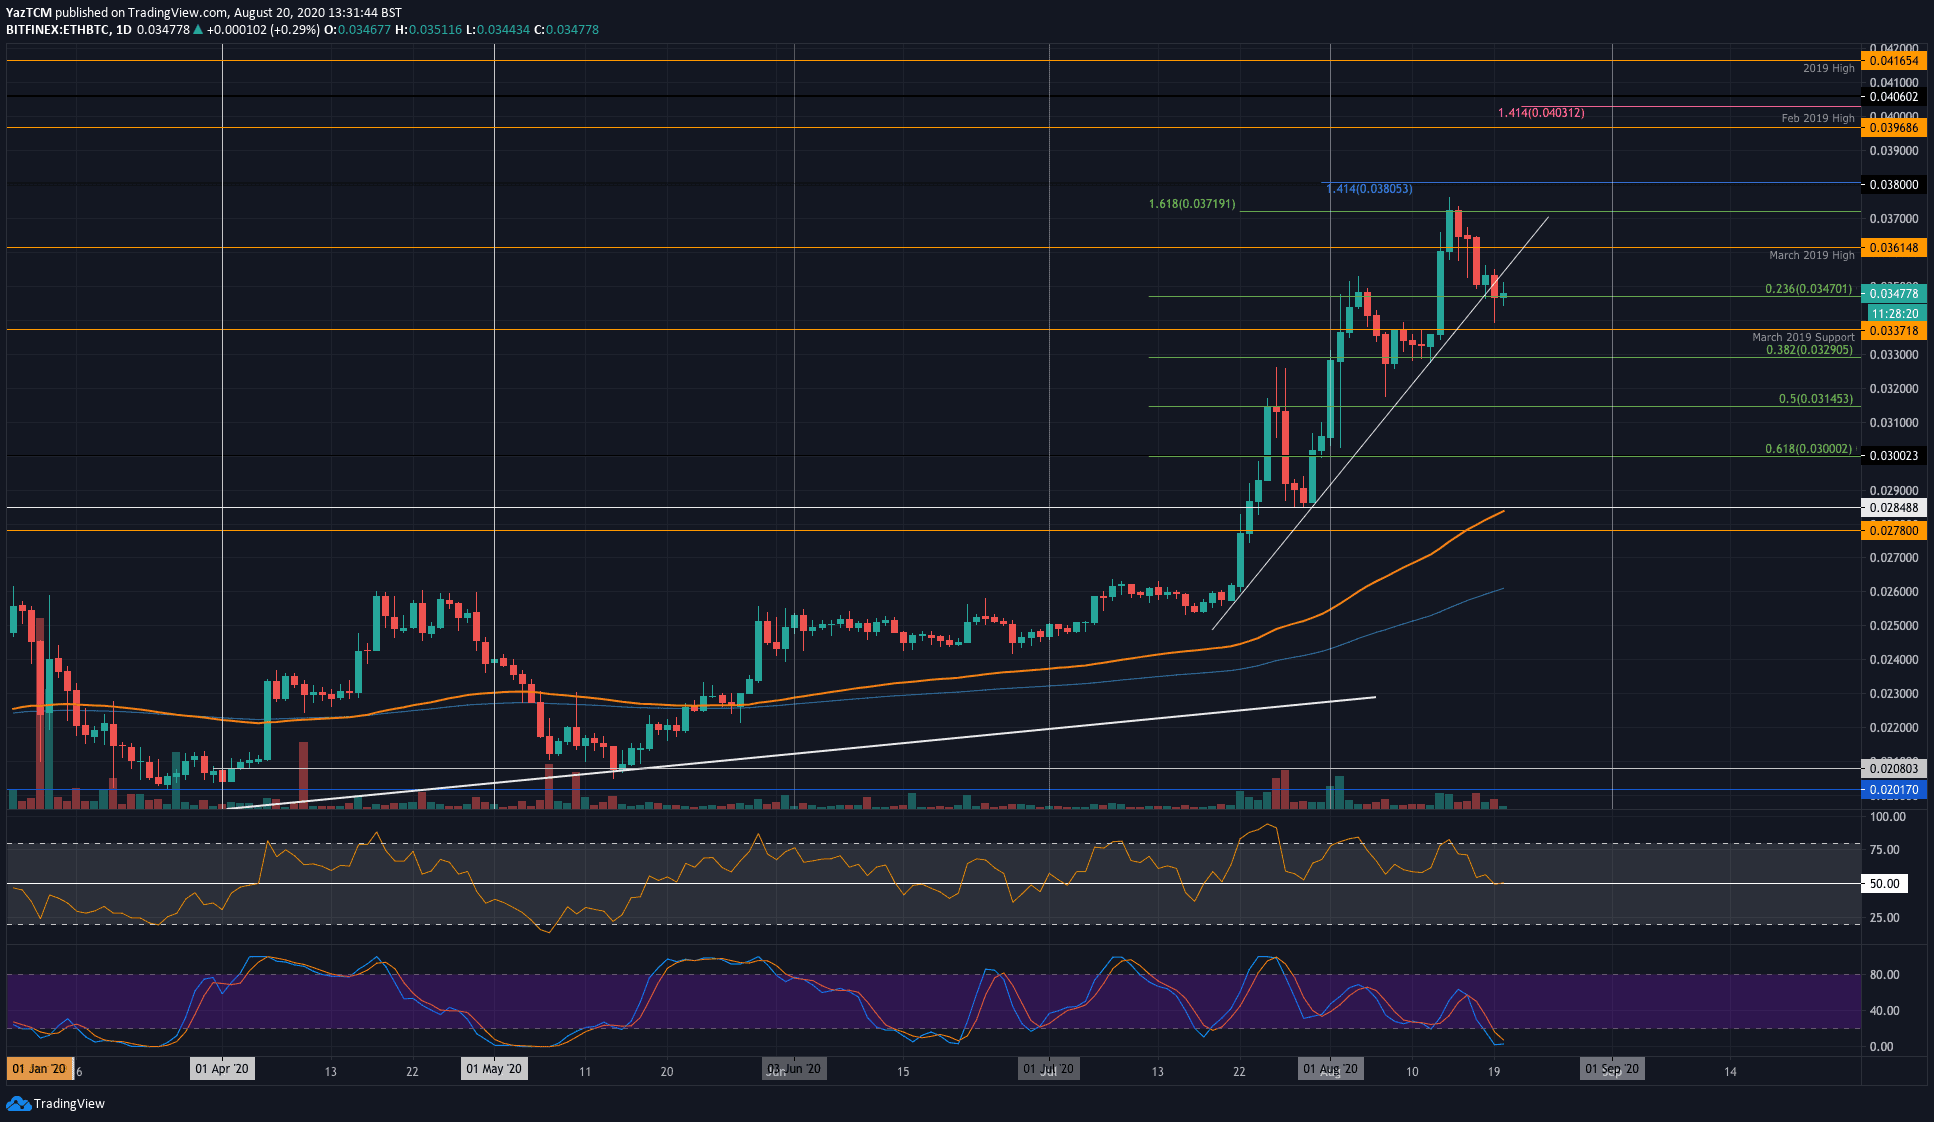
- Against Bitcoin, Ethereum dropped from the 0.0371 BTC resistance to reach support at 0.0347 BTC (.236 Fib Retracement).
ETH/USD: Momentum Reaches A Period Of Indecision
Key Support Levels: $408, $400, $380.
Key Resistance Levels: $438, $445, $465.
The bullish pressure has faded since ETH reached the 2-year high at $438 last week. The coin has since fallen into the support at $413 (previous flipped resistance) as the buyers defend the level.
At the start of August, the coin struggled to pass the $400 level as it established a range between here and $363 (2019 high). The push toward $438 broke this range, and it seems that ETH is developing another range between $438 and $400.
Despite the recent downturn, Ethereum remains bullish and would need to drop beneath $363 (2019 high) for this to change. However, this bullish run cannot continue until the buyers push ETH above the $487 resistance level.
ETH-USD Short Term Price Prediction
If the bulls can defend $408 and rebound, the first level of resistance lies at $438 (Aug 2018 Highs). This is followed by resistance at $445 ($450), $463 (1.272 Fib Extension), $490 (1.414 Fib Extension), and $500.
On the other side, if the sellers break $408, the first level of support lies at $400. Following this, support is found at $380, $363 (2019 Highs & .382 Fib Retracement), and $336 (.5 Fib Retracement).
The RSI has dropped into the mid-line to show indecision within the market. However, it looks to be rebounding from here, suggesting that the bulls are still unwilling to give up their control of the market momentum.
ETH/BTC: Bulls Battle To Defend 0.0347 BTC (.236 Fib) Support
Key Support Levels: 0.0347 BTC, 0.0337 BTC, 0.0329 BTC.
Key Resistance Levels: 0.0361 BTC, 0.0371 BTC, 0.038 BTC.
Etherum also dropped lower from last week’s resistance at 0.0371 BTC. The coin initially found support at 0.0347 BTC (.236 Fib Retracement) a few days ago, bolstered by a steeply rising trend line.
Yesterday, this aforementioned trend line broke temporarily as ETH spiked as low as 0.0339 BTC. However, the bulls managed to rebound and allowed the daily candle to close above the 0.0347 BTC (.236 Fib Retracement) support level.
ETH-BTC Short Term Price Prediction
Looking ahead, if the bulls can rebound from 0.0347 BTC, the first level of resistance lies at 0.0361 BTC (March 2019 highs). This is followed by resistance at 0.0371 BTC and 0.038 BTC.
On the other side, if the sellers break beneath 0.0347 BTC, support lies at 0.0337 BTC (March 2019 support), 0.0329 BTC (.382 Fib Retracement), and 0.0315 BTC (.5 Fib Retracement).
Likewise, the RSI has dropped to the mid-line and is attempting to rebound as the buyers cling onto the control of the market momentum. A break beneath this mid-line could see ETH falling beneath the current 0.0347 BTC support.
Luckily, the Stochastic RSI shows oversold conditions as it primes itself for a bullish crossover signal that should send the market higher.