Etheruem is attempting to rebound from support at 0 as the previous price decline stalls.The cryptocurrency is supported by the .5 Fib Retracement at 0.Against Bitcoin, Ethereum bounced higher after reaching the 0.025 BTC support.Key Support & Resistance LevelsETH/USD:Support: 0, 0, 5.Resistance: 5, 0, 0.ETH/BTC:Support: 0.0256 BTC, 0.025 BTC, 0.0242 BTC.Resistance: 0.027 BTC, 0.0278 BTC, 0.0288 BTC.ETH/USD: Bulls Continue Battle To Defend 0.Since our last analysis, Ethereum continued to fall beneath the support at 0 (.382 Fib Retracement) as it dropped further lower into the 0 support, provided by the .5 Fib Retracement. The cryptocurrency declined to as low as 0 but found support at a rising trend line.ETH is still in a neutral trading condition but a
Topics:
Yaz Sheikh considers the following as important: ETH Analysis, Ethereum (ETH) Price
This could be interesting, too:
Mandy Williams writes Ethereum Derivatives Metrics Signal Modest Downside Tail Risk Ahead: Nansen
CryptoVizArt writes Will Weak Momentum Drive ETH to .5K? (Ethereum Price Analysis)
Mandy Williams writes Ethereum Key Metrics Point to Persistent Bullish Outlook for ETH: CryptoQuant
CryptoVizArt writes Ethereum Price Analysis: Following a 15% Weekly Crash, What’s Next for ETH?
- Etheruem is attempting to rebound from support at $220 as the previous price decline stalls.
- The cryptocurrency is supported by the .5 Fib Retracement at $220.
- Against Bitcoin, Ethereum bounced higher after reaching the 0.025 BTC support.
Key Support & Resistance Levels
ETH/USD:
Support: $220, $210, $205.
Resistance: $225, $240, $250.
ETH/BTC:
Support: 0.0256 BTC, 0.025 BTC, 0.0242 BTC.
Resistance: 0.027 BTC, 0.0278 BTC, 0.0288 BTC.
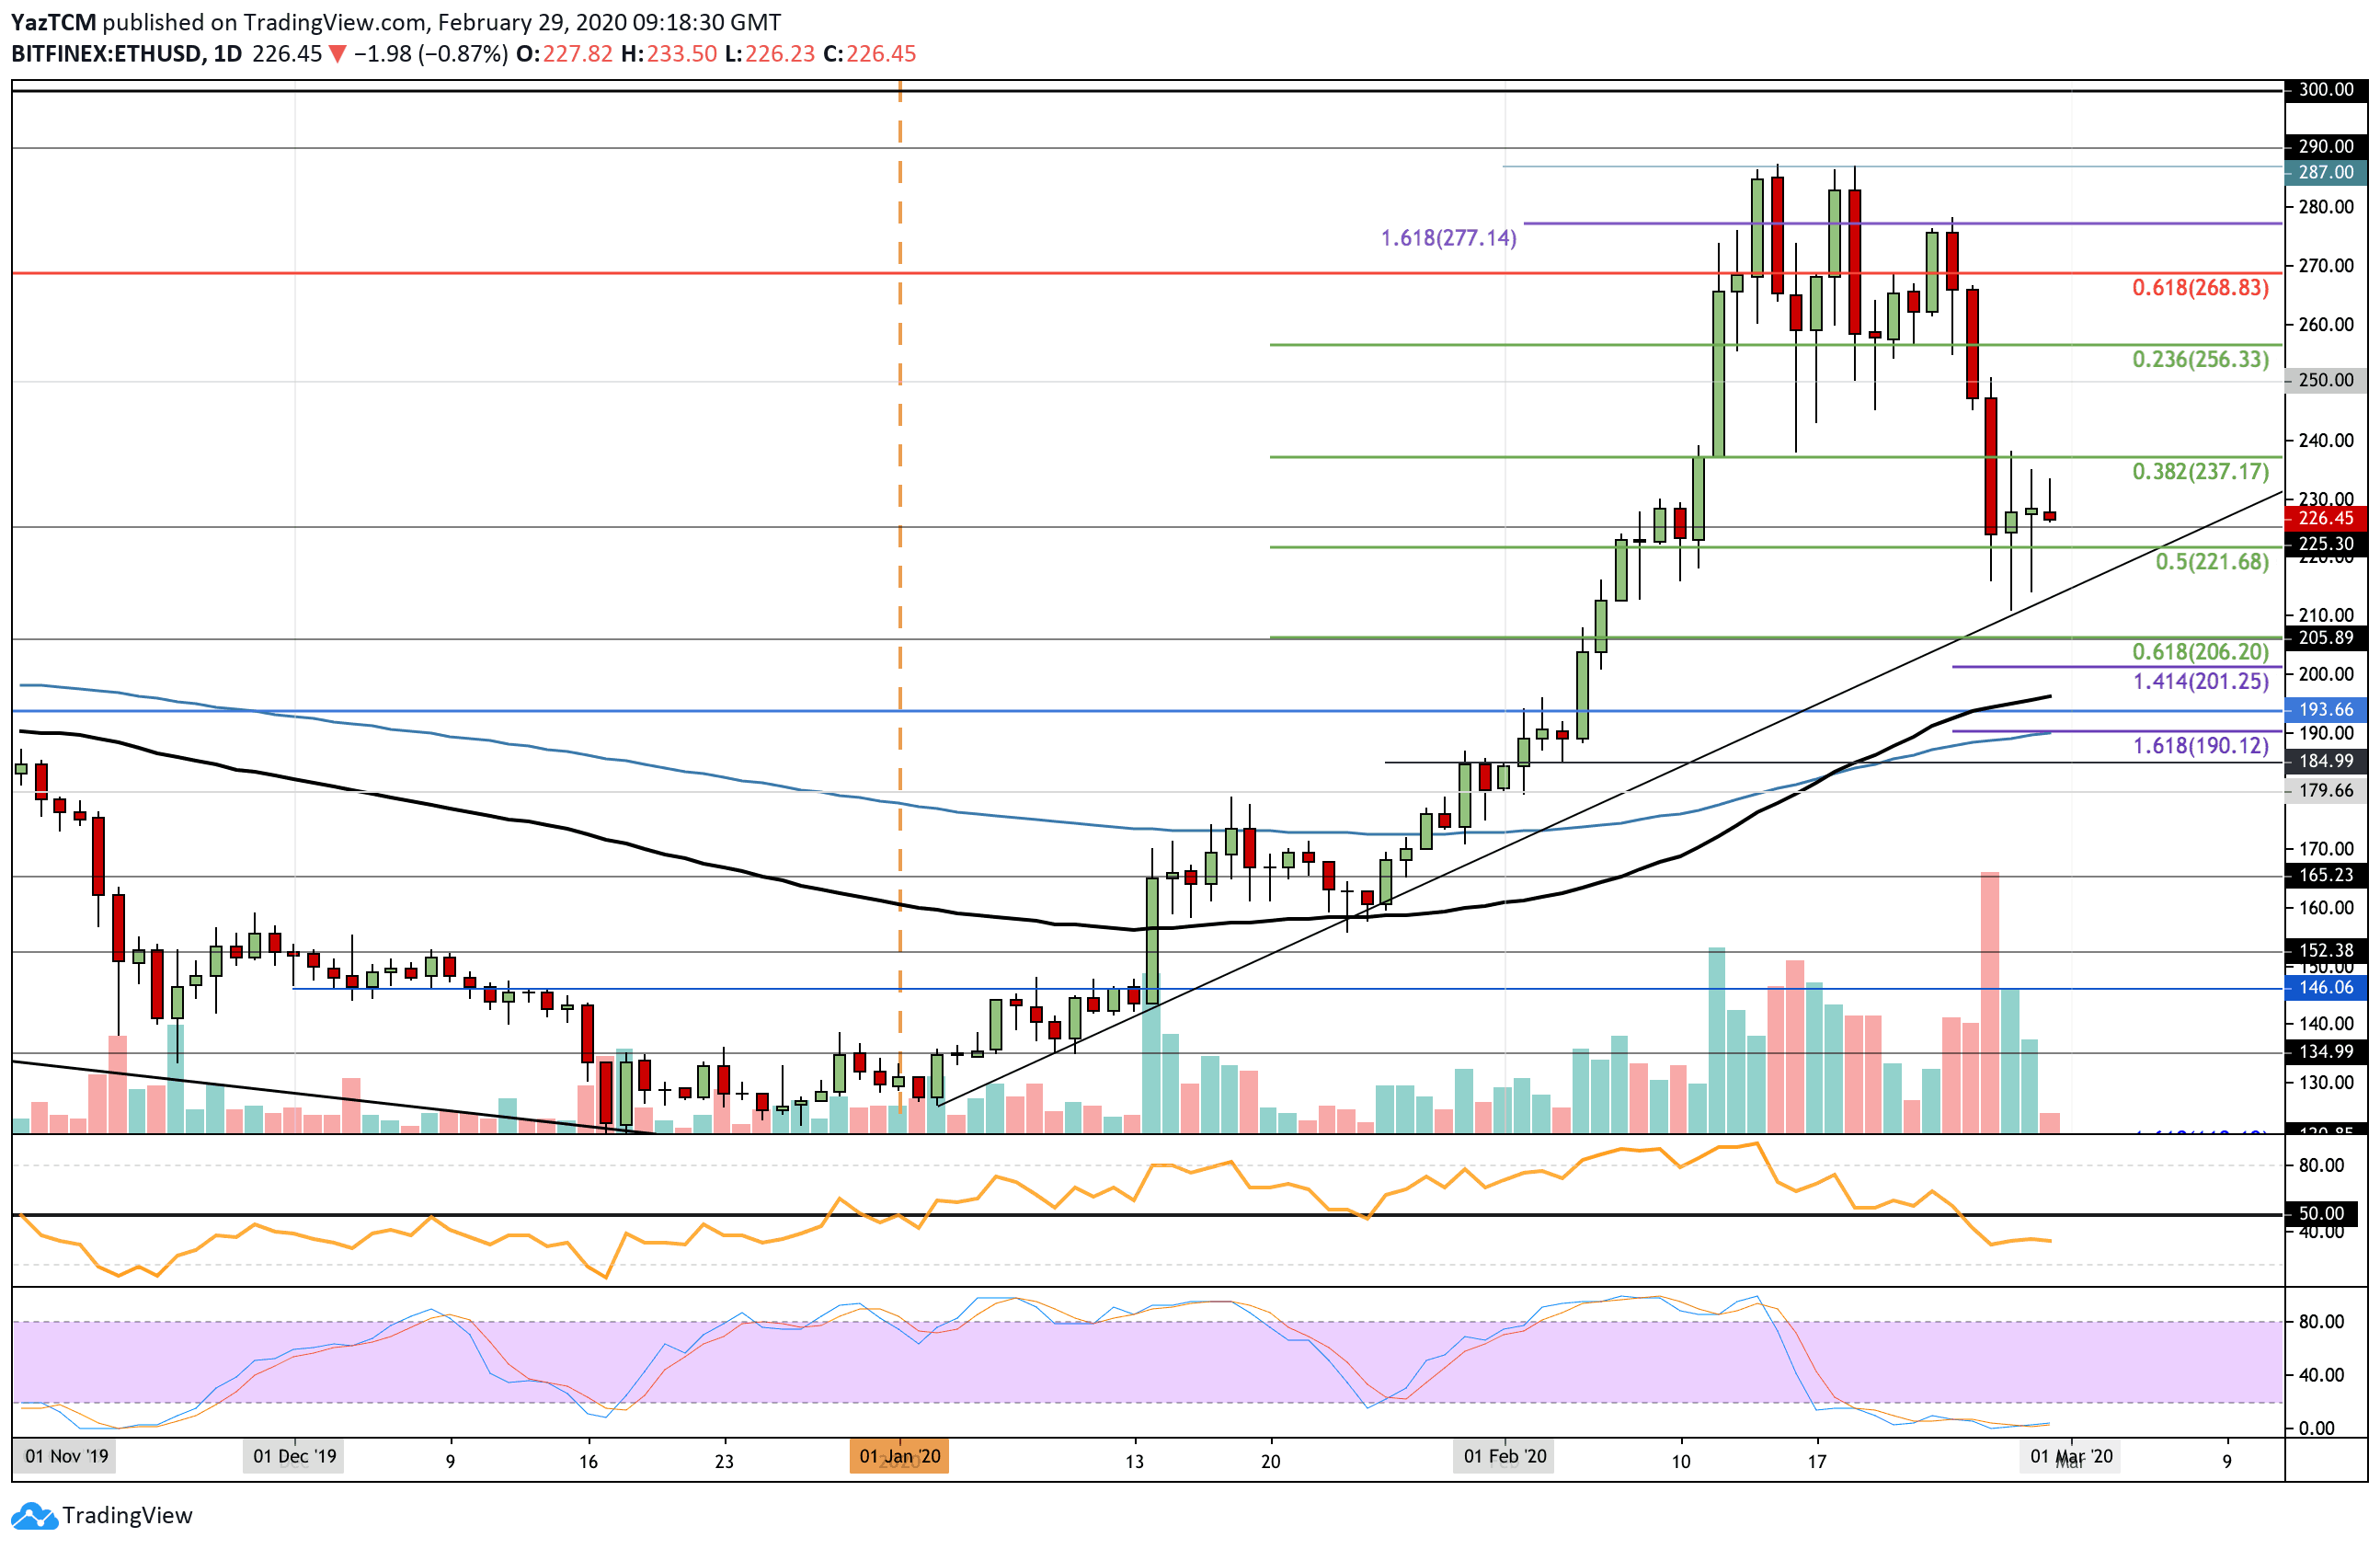
ETH/USD: Bulls Continue Battle To Defend $220.
Since our last analysis, Ethereum continued to fall beneath the support at $240 (.382 Fib Retracement) as it dropped further lower into the $220 support, provided by the .5 Fib Retracement. The cryptocurrency declined to as low as $210 but found support at a rising trend line.
ETH is still in a neutral trading condition but a fall beneath the $200 level would certainly turn ETH bearish.
Ethereum Short Term Price Prediction
If the sellers push ETH beneath $225 and $220, the first level of support is located at $205 (.618 Fib Retracement level). This is followed up with additional support at $200 (downside 1.414 FIb Extension), and $195 (100-days EMA). Beneath this, added strong support is found at $190 (200-days EMA).
On the other side, if the bulls rebound from $225, resistance lies at $240, $250, and $270.
The RSI is showing signs of stabilizing as it starts to trade sideways beneath the 50 level. A bullish crossover signal on the Stochastic RSI would confirm that the buyers are ready to start pushing higher.
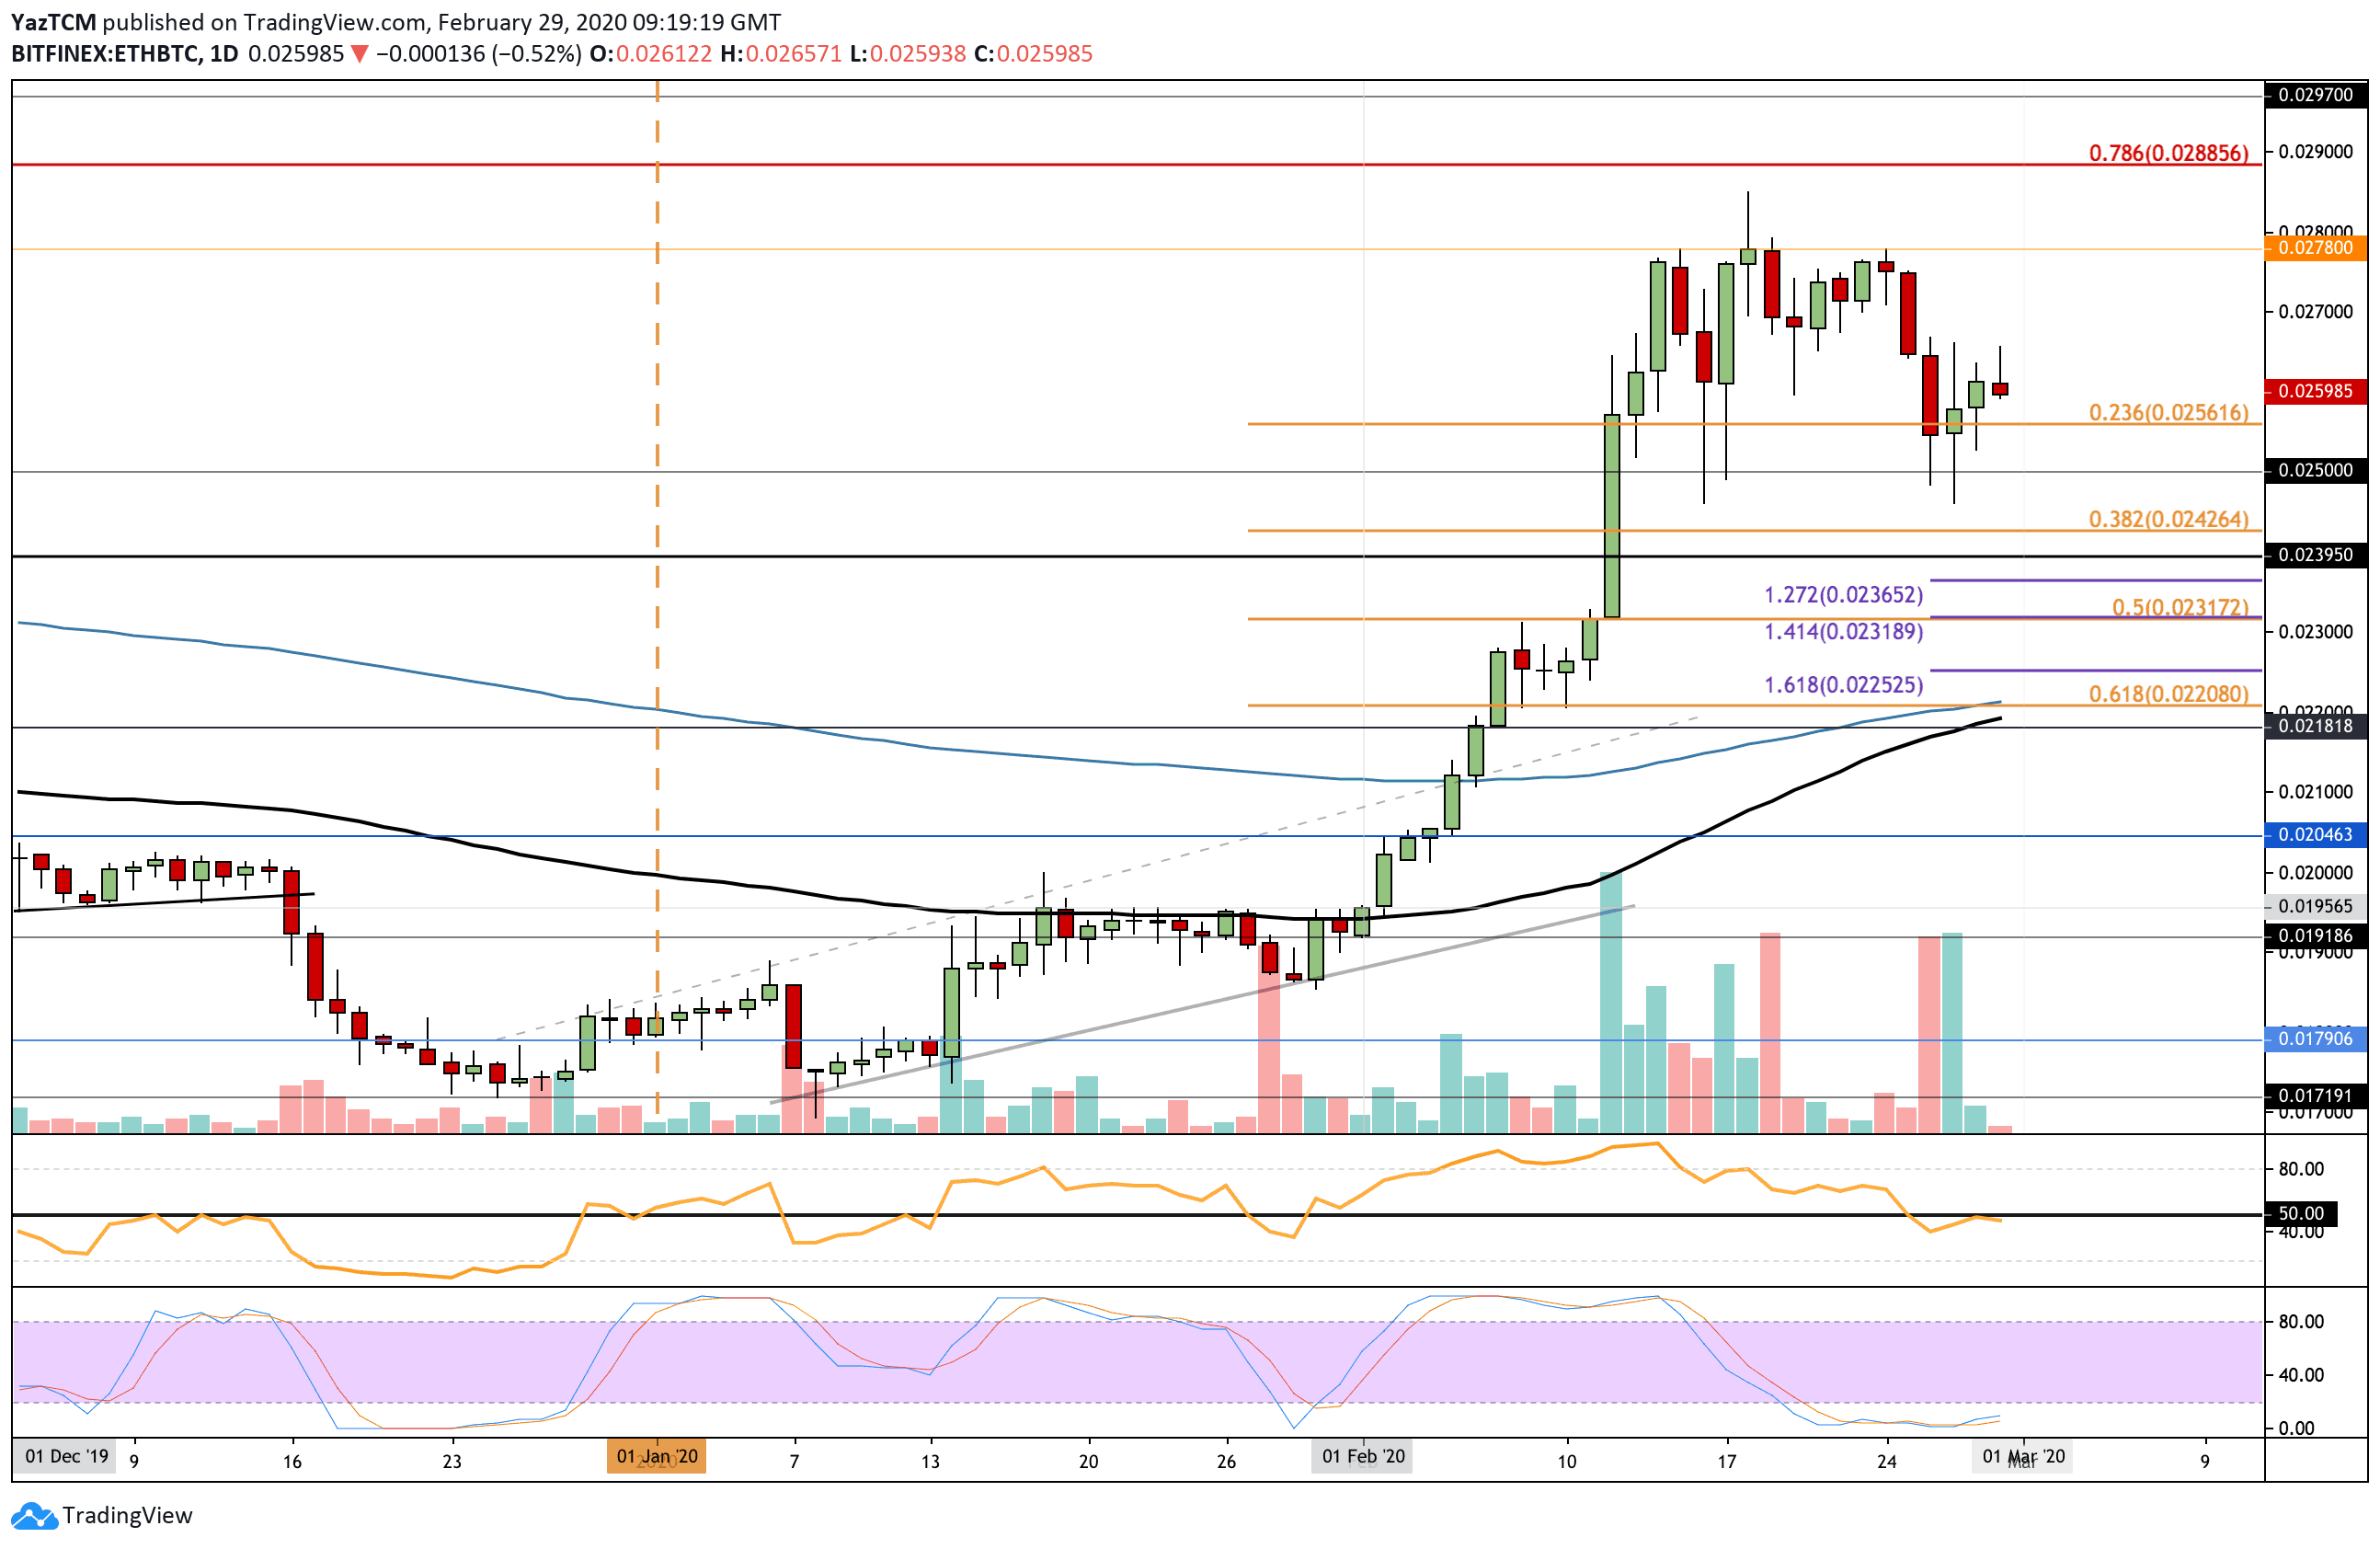
ETH/BTC: ETH Holds Above 0.025 BTC Support
Against Bitcoin, ETH dropped beneath 0.0256 BTC but found support at 0.0255 BTC. It did spike lower but managed to rebound at around 0.025 BTC and shoot back above 0.026 BTC, where it currently trades.
ETH is still within a bullish trend against BTC, however, it would need to continue above 0.027 BTC for this bull run to continue. A drop beneath 0.025 BTC would turn it bearish.
Ethereum Short Term Price Prediction
If the sellers push lower, the first 2 levels of support are located at 0.0256 BTC and 0.025 BTC. Beneath this, additional support lies at 0.0242 BTC (.382 Fib Retracement) and 0.0239 BTC.
On the other side, the first level of resistance is located at 0.027 BTC. This is followed by resistance at 0.0278 BTC, 0.0288 BTC (bearish .786 Fib Retracement), and 0.029 BTC.
The RSI has returned to the 50 level as indecision appears within the market. For a bullish recovery, the buyers must bring the RSI above 50. The Stochastic RSI has produced a bullish crossover signal and if the moving averages can start to expand, this will signal that the bulls are about to wake up.