Ethereum rebounded by 3% from support provided by a rising trend line.The cryptocurrency had dropped by a total of 15% over the last week before the recent bounce.Against Bitcoin, Ethereum managed to remain above 0.025 BTC but is struggling at 0.026 BTC.Key Support & Resistance LevelsETH/USD:Support: 0, 5, 5.Resistance:0, 0, 0.ETH/BTC:Support: 0.0255 BTC, 0.025 BTC, 0.0242 BTC.Resistance: 0.0263 BTC, 0.027 BTC, 0.0278 BTC.ETH/USD: Bulls Continue Battle To Defend 0.Since our last analysis, Ethereum dipped lower from the support at 0, provided by a .5 Fib Retracement, but managed to find additional support at a 2-month-old rising trend line. After reaching this trend line, ETH bounced by 3% to reach the resistance at 0.The rebound from the trend line prevented ETH
Topics:
Yaz Sheikh considers the following as important: ETH Analysis, Ethereum (ETH) Price
This could be interesting, too:
Mandy Williams writes Ethereum Derivatives Metrics Signal Modest Downside Tail Risk Ahead: Nansen
CryptoVizArt writes Will Weak Momentum Drive ETH to .5K? (Ethereum Price Analysis)
Mandy Williams writes Ethereum Key Metrics Point to Persistent Bullish Outlook for ETH: CryptoQuant
CryptoVizArt writes Ethereum Price Analysis: Following a 15% Weekly Crash, What’s Next for ETH?
- Ethereum rebounded by 3% from support provided by a rising trend line.
- The cryptocurrency had dropped by a total of 15% over the last week before the recent bounce.
- Against Bitcoin, Ethereum managed to remain above 0.025 BTC but is struggling at 0.026 BTC.
Key Support & Resistance Levels
ETH/USD:
Support: $220, $215, $205.
Resistance:$230, $240, $250.
ETH/BTC:
Support: 0.0255 BTC, 0.025 BTC, 0.0242 BTC.
Resistance: 0.0263 BTC, 0.027 BTC, 0.0278 BTC.
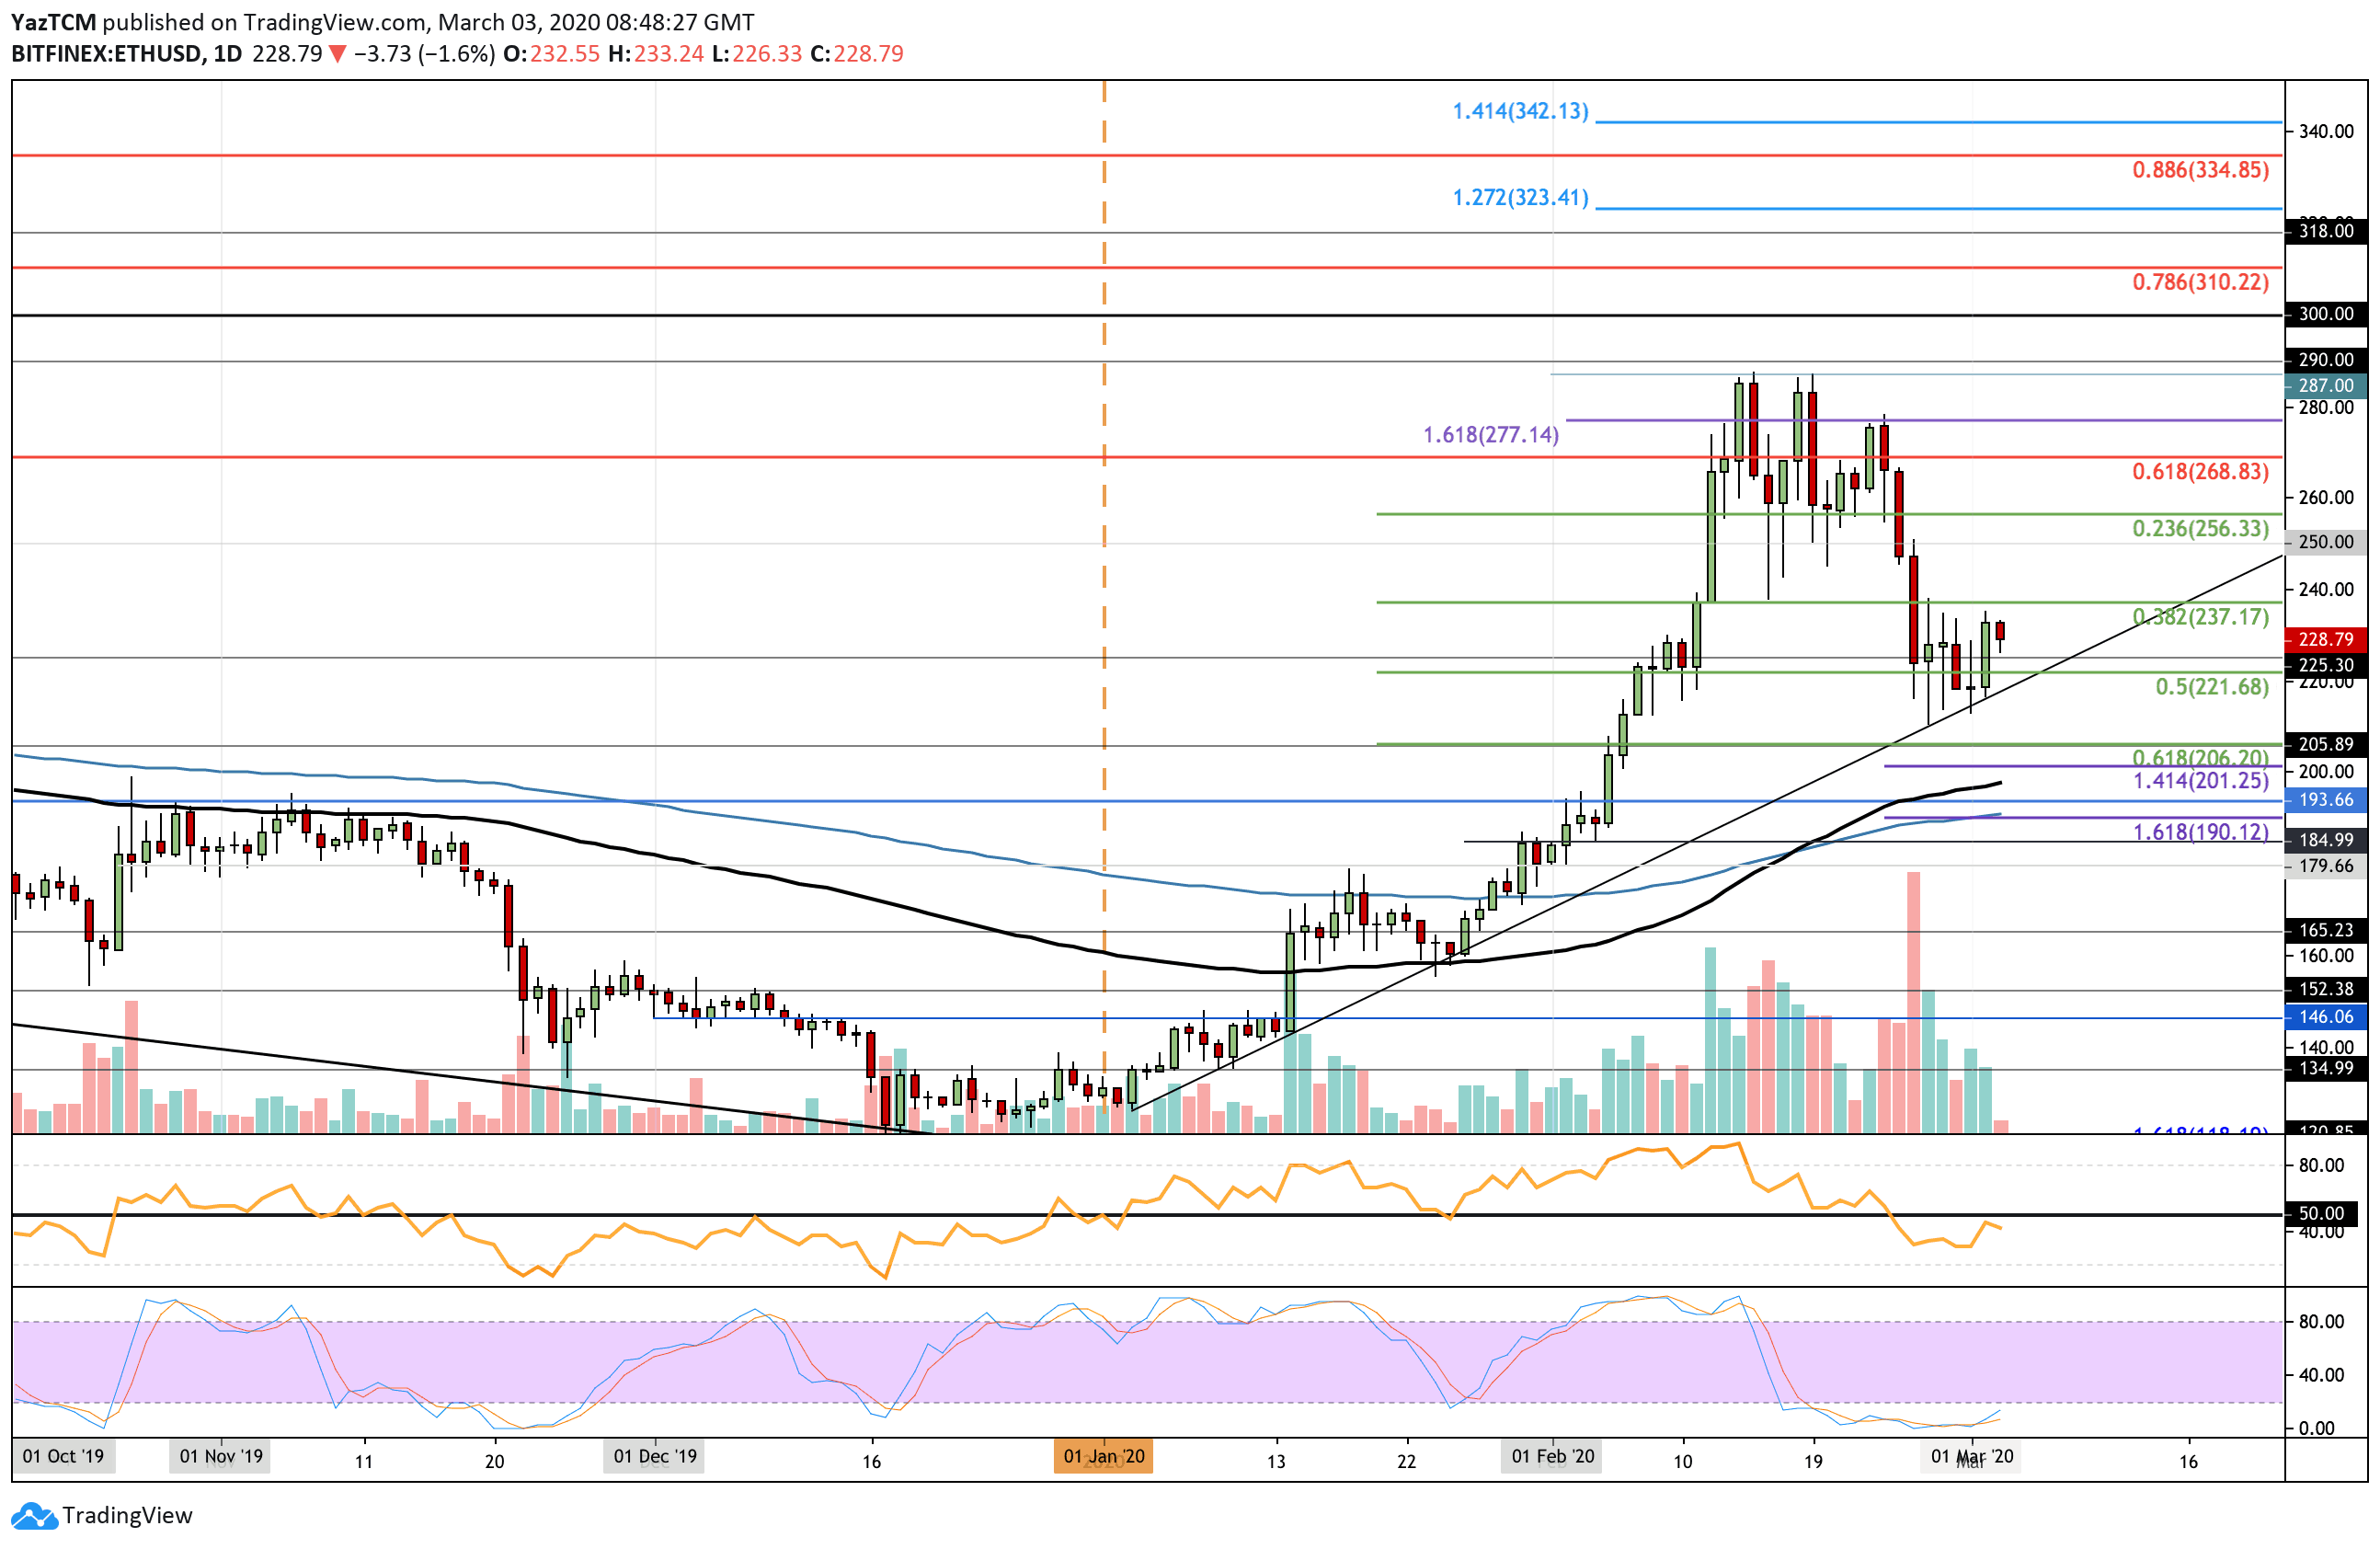
ETH/USD: Bulls Continue Battle To Defend $220.
Since our last analysis, Ethereum dipped lower from the support at $220, provided by a .5 Fib Retracement, but managed to find additional support at a 2-month-old rising trend line. After reaching this trend line, ETH bounced by 3% to reach the resistance at $230.
The rebound from the trend line prevented ETH from entering into bearish territory. It still needs to break above $240 before a short-term bullish trend can be confirmed. If it was to drop and close beneath the rising trend line, the market would be in the process of turning bearish.
The volume has dropped considerably, which shows that the previous selling pressure has started to show signs of fading.
Ethereum Short Term Price Prediction
The first level of resistance lies at $230. Above this, resistance is expected at $240, $250, and $255. This is followed by $270, $280, and $285 (2020 high).
Alternatively, if the sellers push lower, the first level of support is located at $225. This is followed by support at $220, $215, and $205.
The RSI is re-approaching the 50 level. However, it looks like it is turning downward again as the bears refuse to give up control over the market momentum. For a recovery to be seen within the market, the RSI must rise above 50.
The Stochastic RSI recently produced a bullish crossover signal, which is a promising sign for the bulls.
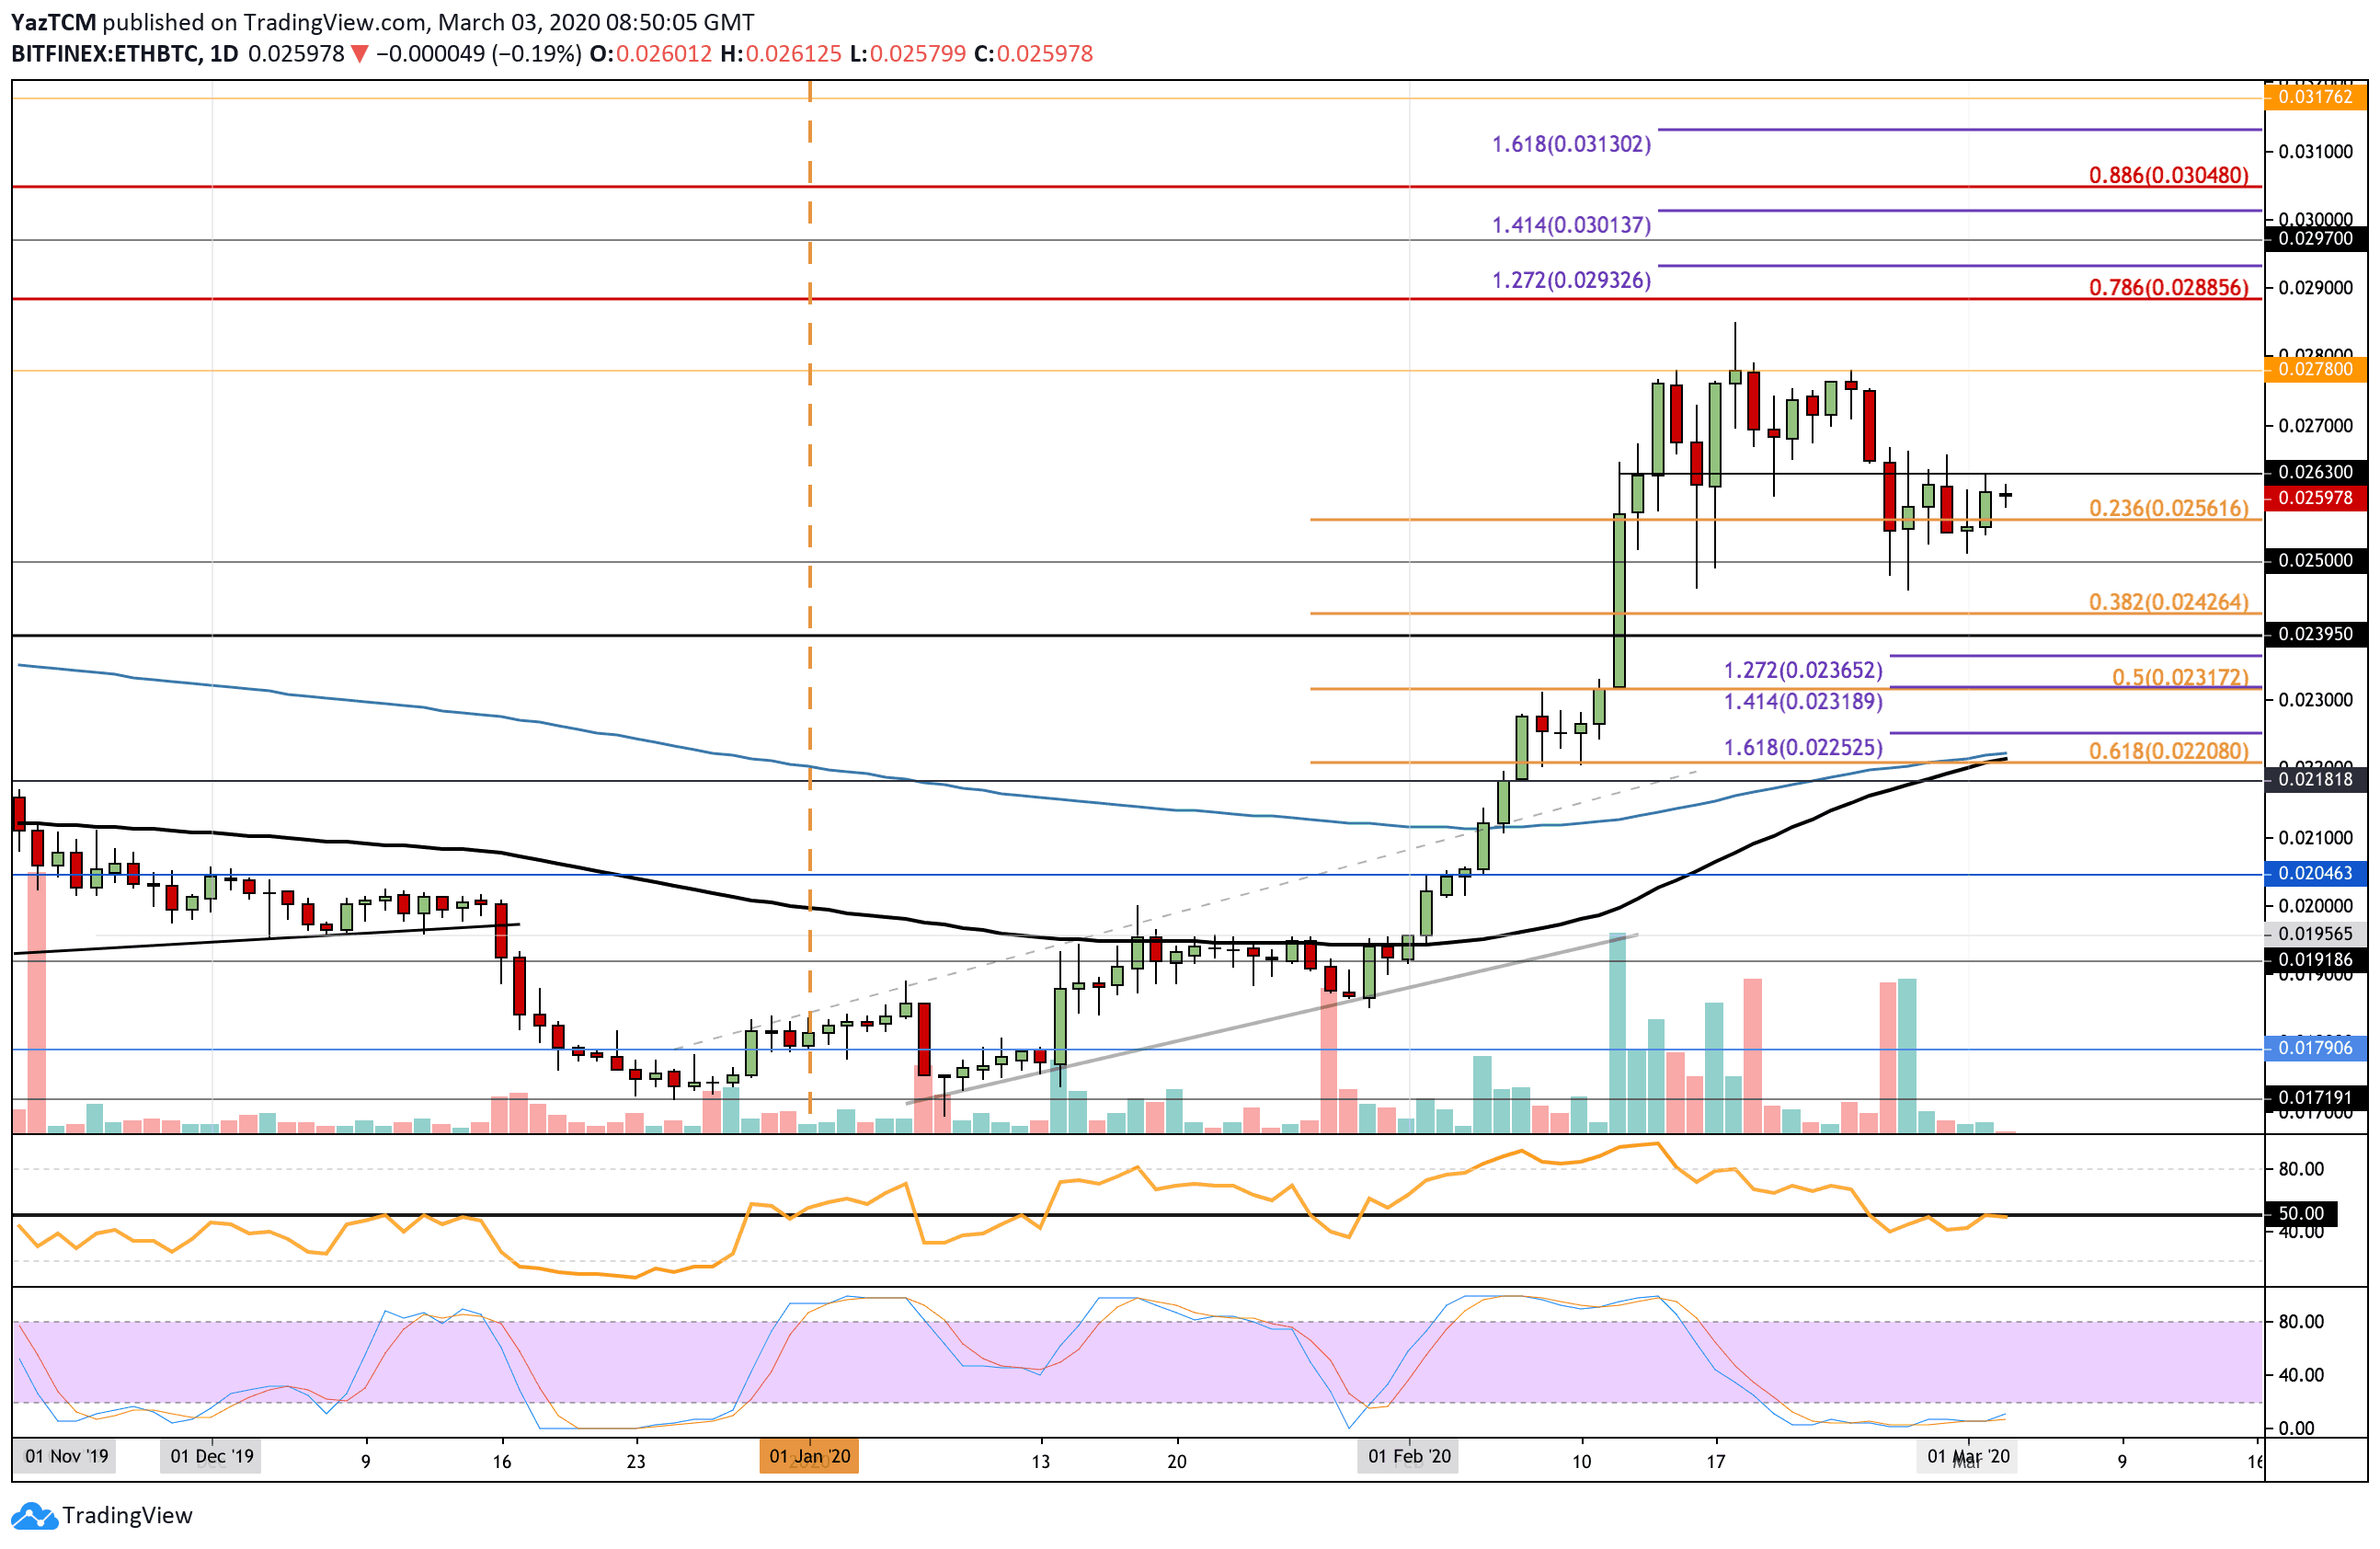
ETH/BTC: ETH Remains Strong Above 0.025 BTC Support
Against Bitcoin, ETH remained strong above the 0.025 BTC support and rarely dropped beneath 0.0255 BTC. The cryptocurrency is now struggling at the 0.026 BTC resistance level and must pass 0.0263 BTC to turn bullish again in the short term.
The last 6-days have shown ETH trading within a range between 0.0263 BTC and 0.0255 BTC, and the coin must break this range to dictate the next direction of movement.
Ethereum Short Term Price Prediction
The first level of strong resistance lies at 0.0263 BTC. This is followed by resistance at 0.027 BTC and 0.0278 BTC. If they can climb above 0.028 BTC, additional resistance is located at 0.0288 BTC (bearish .786 Fibonacci Retracement level).
On the other hand, if the sellers push lower, the first two levels of support lie at 0.0255 BTC and 0.025 BTC. This is followed by additional support at 0.0242 BTC, 0.0239 BTC, and 0.0231 BTC.
The RSI is trading directly along with the 50 level, which indicates the indecision currently present within the market. It must break above 50 to see ETH/BTC rising higher. The Stochastic RSI is also in the process of trying to create a bullish crossover which should help the market to rise toward 0.027 BTC.