Ethereum saw a 1.6% price increase over the last 24-hours as it currently trades around 3.The cryptocurrency had fallen beneath an acute ascending triangle but managed to find support at the lower boundary of a new triangle this weekend.Against Bitcoin, Ethereum suffers as it drops back beneath 0.021 BTC. Remaining above 0.201 BTC will be crucial moving forward.Key Support & Resistance LevelsETH/USD:Support: 0, 3, 0.Resistance: 5, 0, 0.ETH/BTC:Support: 0.0201 BTC, 0.0196 BTC, 0.0192 BTC.Resistance: 0.021 BTC, 0.0215 BTC, 0.022 BTC.ETH/USD: Ethereum Forms A Long Term TriangleEthereum had broken from a short term triangle this weekend but managed to rebound from support at a slightly longer termed triangle as it extends the consolidation phase.The cryptocurrency dropped
Topics:
Yaz Sheikh considers the following as important: ETH Analysis, Ethereum (ETH) Price
This could be interesting, too:
Mandy Williams writes Ethereum Derivatives Metrics Signal Modest Downside Tail Risk Ahead: Nansen
CryptoVizArt writes Will Weak Momentum Drive ETH to .5K? (Ethereum Price Analysis)
Mandy Williams writes Ethereum Key Metrics Point to Persistent Bullish Outlook for ETH: CryptoQuant
CryptoVizArt writes Ethereum Price Analysis: Following a 15% Weekly Crash, What’s Next for ETH?
- Ethereum saw a 1.6% price increase over the last 24-hours as it currently trades around $133.
- The cryptocurrency had fallen beneath an acute ascending triangle but managed to find support at the lower boundary of a new triangle this weekend.
- Against Bitcoin, Ethereum suffers as it drops back beneath 0.021 BTC. Remaining above 0.201 BTC will be crucial moving forward.
Key Support & Resistance Levels
ETH/USD:
Support: $130, $123, $120.
Resistance: $135, $140, $150.
ETH/BTC:
Support: 0.0201 BTC, 0.0196 BTC, 0.0192 BTC.
Resistance: 0.021 BTC, 0.0215 BTC, 0.022 BTC.
ETH/USD: Ethereum Forms A Long Term Triangle
Ethereum had broken from a short term triangle this weekend but managed to rebound from support at a slightly longer termed triangle as it extends the consolidation phase.
The cryptocurrency dropped as low as $125 but rebounded from the trend line to climb back above $130 yesterday. It now faces strong resistance at the upper boundary and still must break this to head higher.
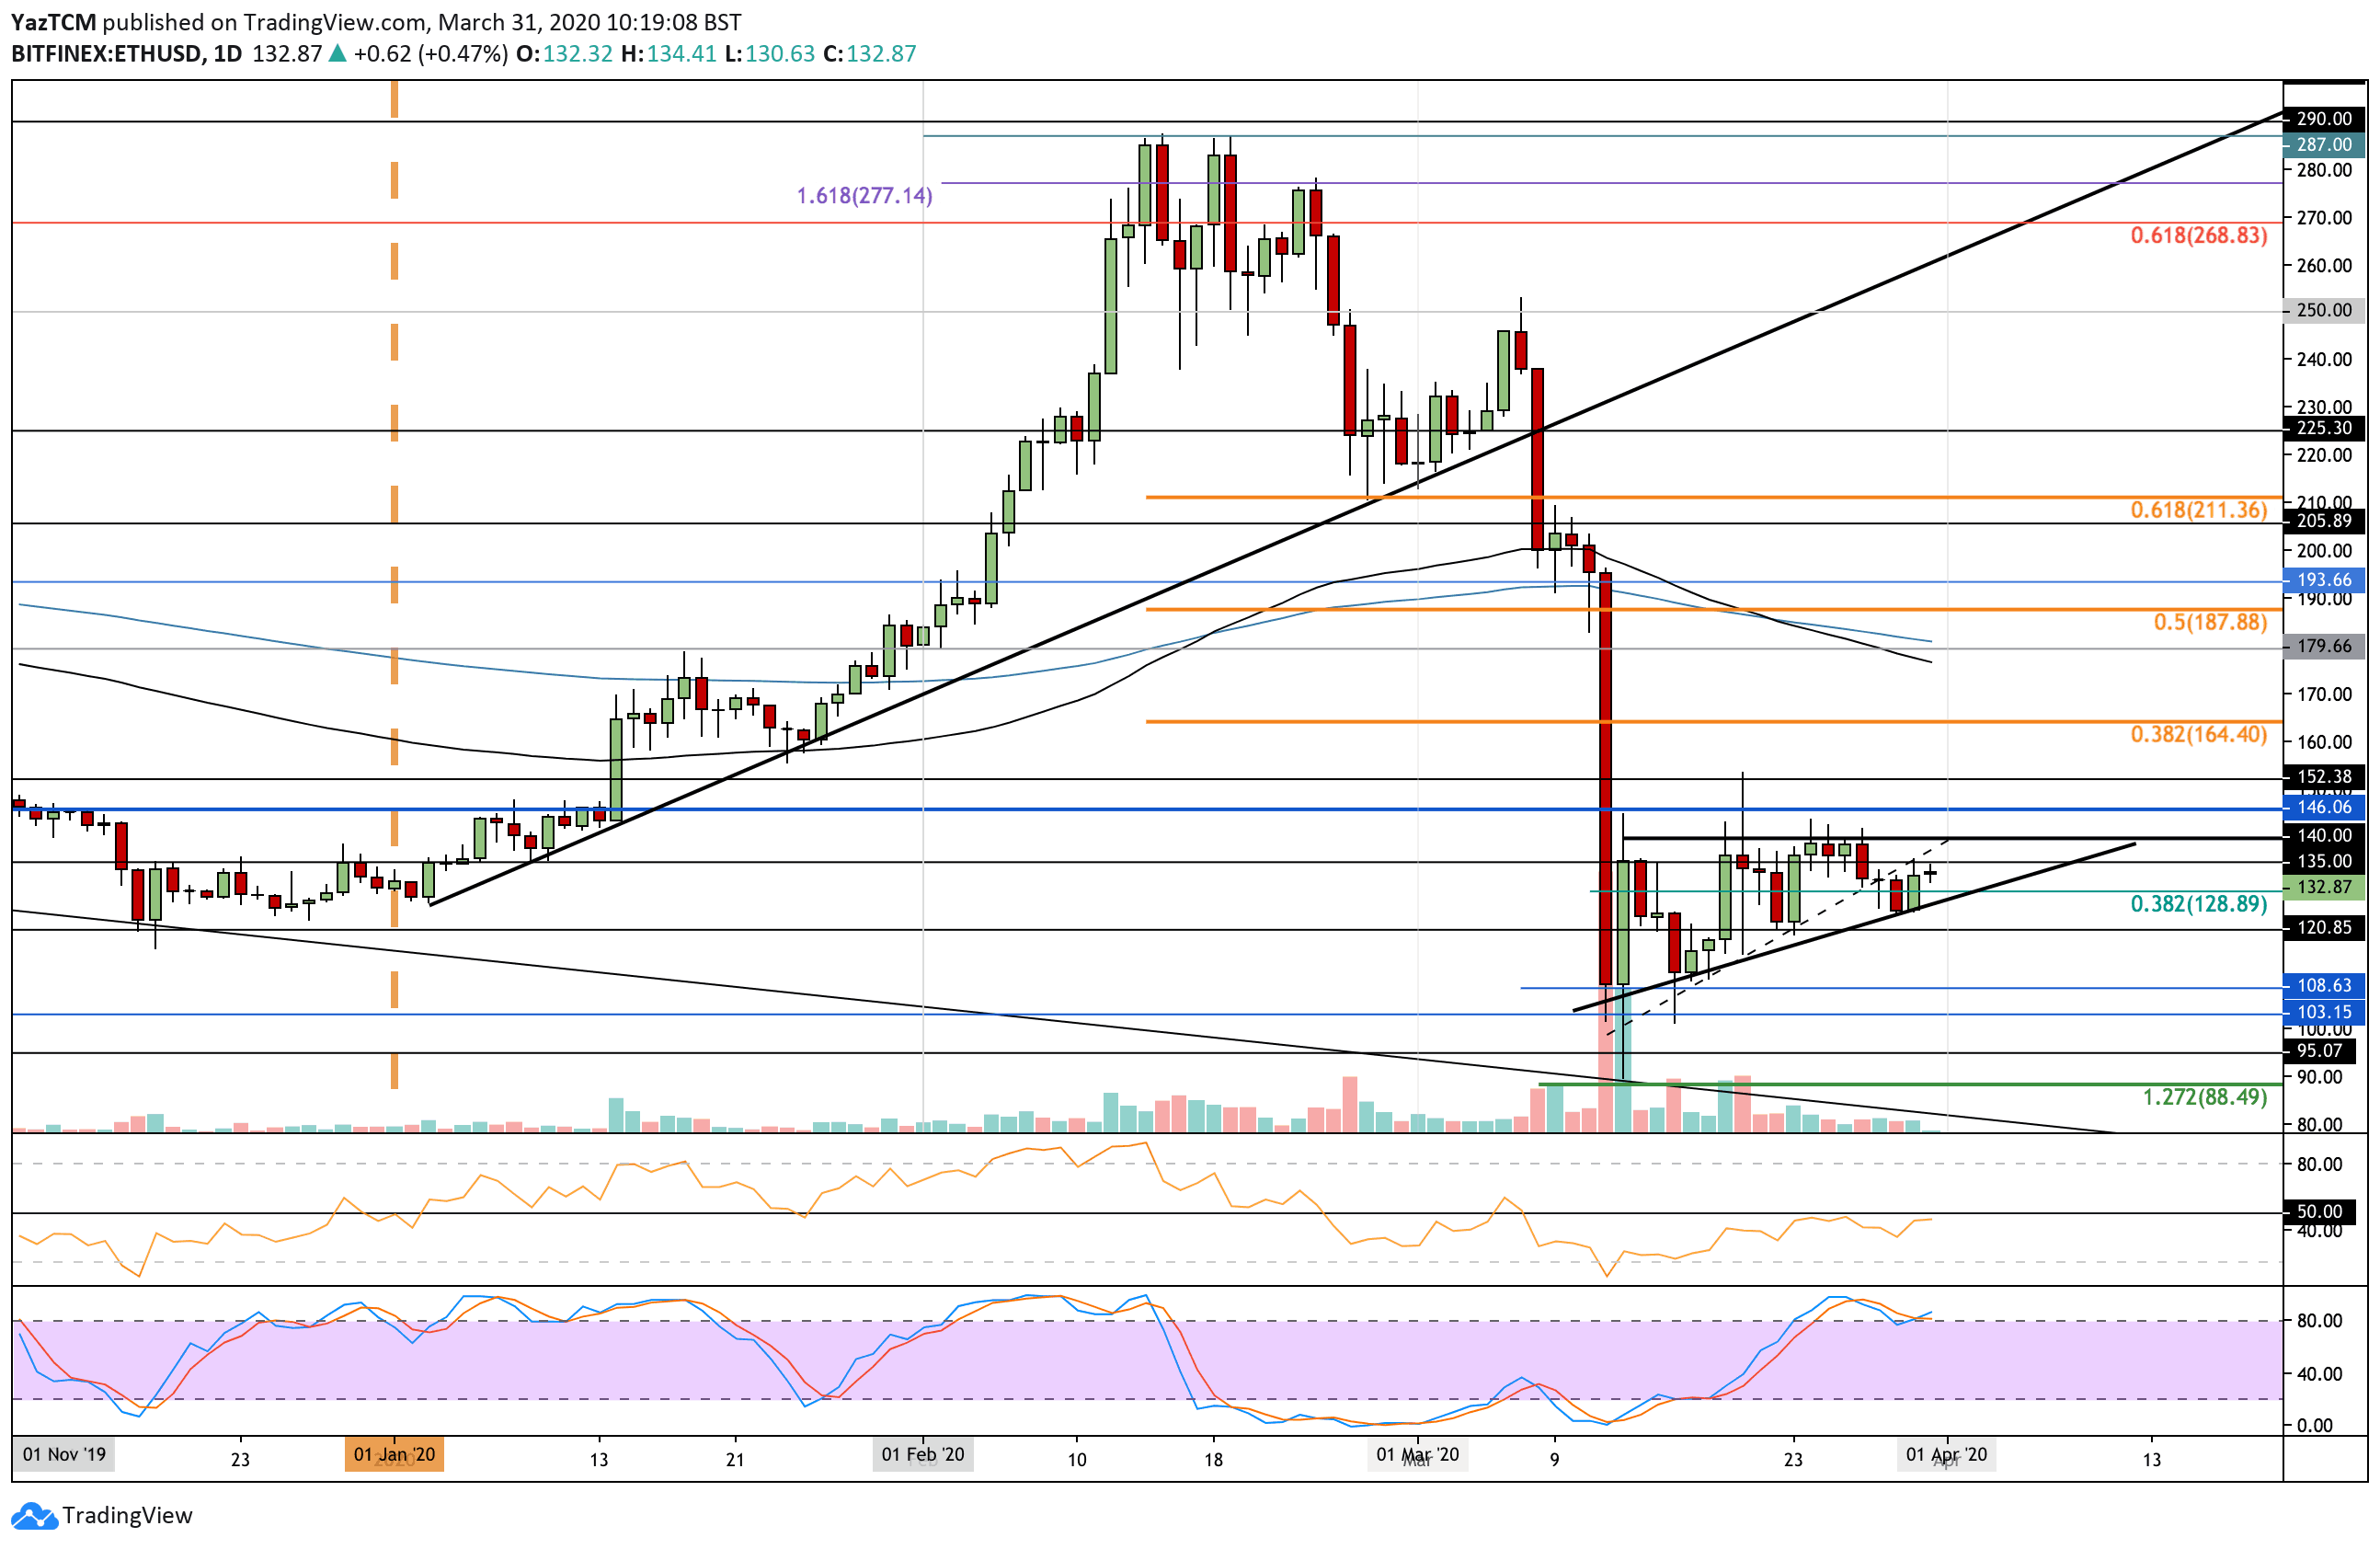
ETH-USD Short Term Price Prediction
Toward the upside, the first level of resistance lies at $135. This is immediately followed by resistance at the upper boundary at $140. Above this, resistance lies at $146, $155, and $165 (bearish .382 Fib Retracement).
From below, the first level of support lies at $130. Beneath this, the lower boundary of the triangle is expected to provide strong support. Beneath the triangle, support lies at $125, $120, $110, and $105.
The RSI climbed back toward the 50 level but is still hovering beneath it to show the bulls still have not taken control of the market momentum. A break above would undoubtedly help ETH start to rise above this consolidation pattern.
ETH/BTC: Ethereum Continues To Struggle Against Bitcoin
Against Bitcoin, Ethereum was unable to maintain itself above the 0.021 BTC level, which caused it to drop toward 0.0204 BTC.
The sellers look to be pushing lower, and it will be necessary for the bulls to defend 0.0201 BTC to prevent the market from heading toward 0.0185 BTC.
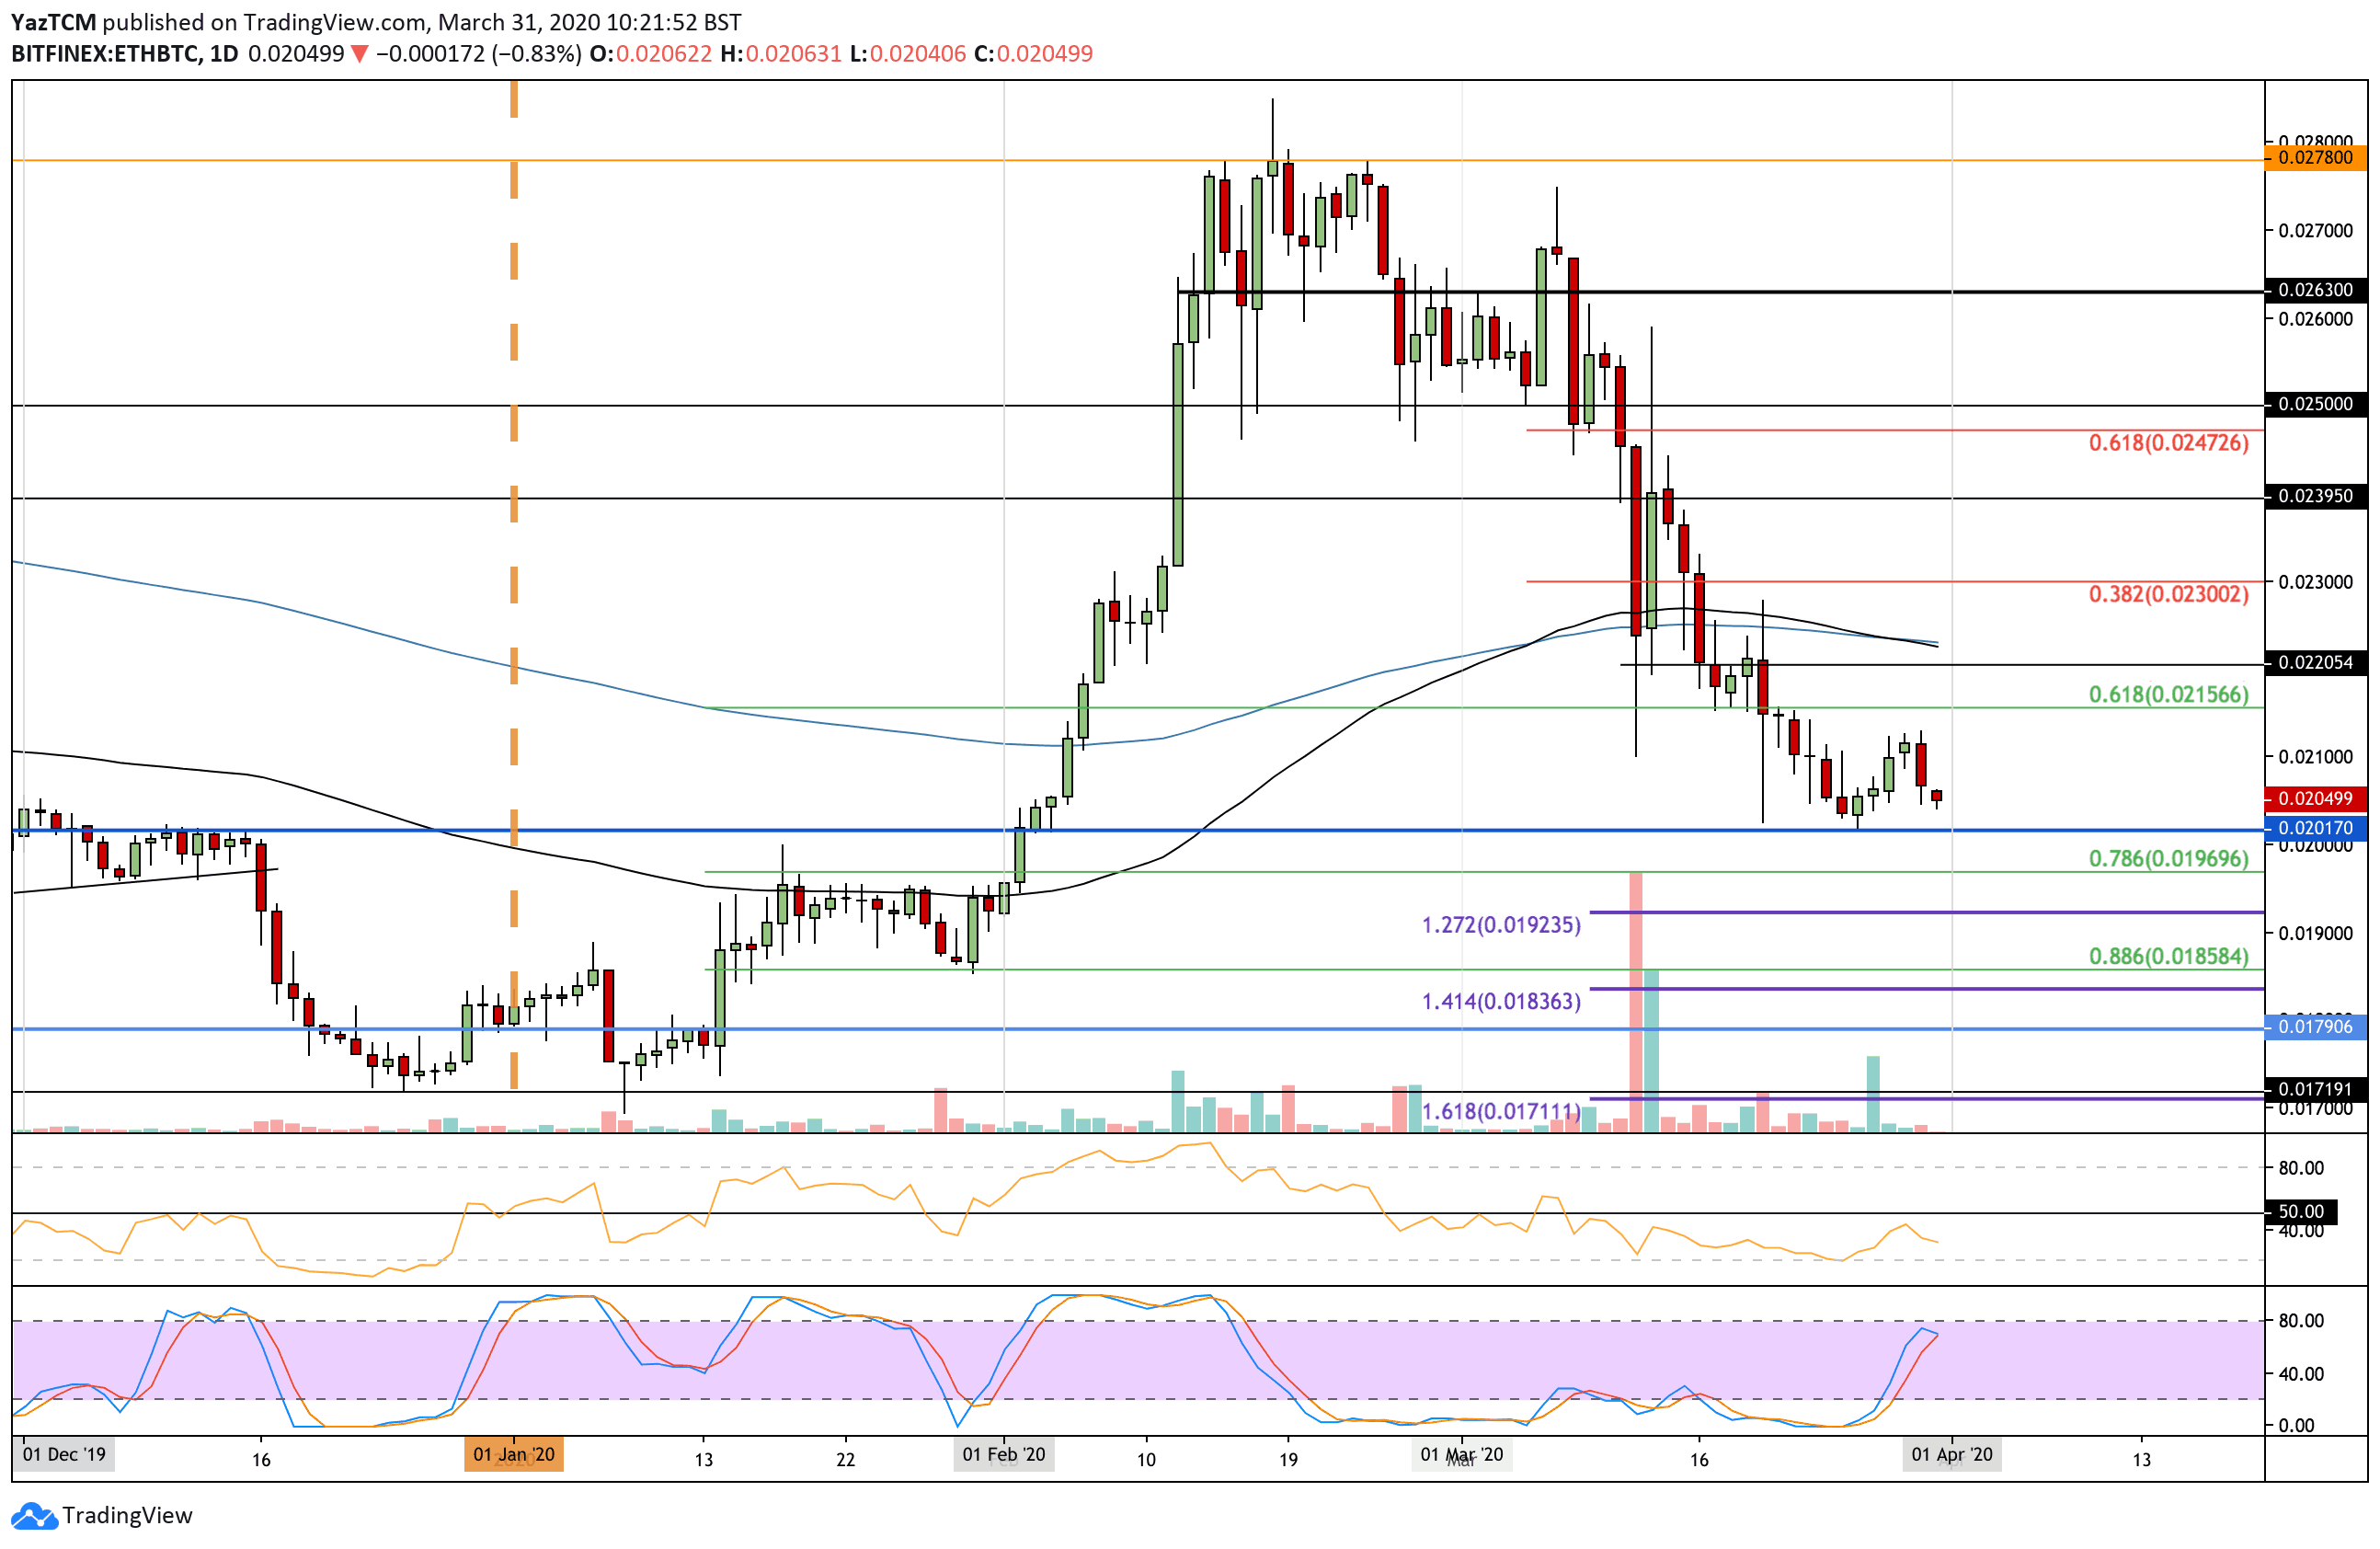
ETH-BTC Short Term Price Prediction
From below, the first two levels of support are 0.0201 BTC and 0.020 BTC. Beneath this, support lies at 0.0196 BTC (.786 Fib Retracement), 0.0192 BTC (downside 1.272 Fib Extension), and 0.0185 BTC (.886 Fib Retracement).
From above, resistance is located at 0.021 BTC, 0.0215 BTC, and 0.022 BTC.
The RSI is headed lower to show increased selling momentum within the market. The Stochastic RSI is also about to produce a bearish crossover signal that will help the bearish case downward.