After recovering from .45, XTZ bulls are now pushing back at crucial resistance of .80While consolidating, Tezos is waiting for a huge price movement across its trading pairsAgainst Bitcoin, XTZ keep trading around 25000 SAT support as it looks for a strong rebound levelXTZ/USD: Tezos Struggles In A Tight RangeKey Resistance Levels: .80, , .5Key Support Levels: .45, .25, %excerpt%.845XTZ/USD. Source: TradingViewSince our previous price analysis, the price of Tezos has been trading in a tight price range (.25 – .8), now holding as solid support and resistance for the past two weeks.Interestingly, Tezos has managed to establish minor support around .45 for the past ten days to indicate that buyers are showing in the market. However, the bulls are still facing stiff resistance
Topics:
Michael Fasogbon considers the following as important: Price Analysis, Tezos (XTZ) Price
This could be interesting, too:
CryptoVizArt writes ETH’s Path to K Involves Maintaining This Critical Support (Ethereum Price Analysis)
Duo Nine writes Crypto Price Analysis June-29: ETH, XRP, ADA, DOGE, and DOT
Duo Nine writes Crypto Price Analysis June-15: ETH, XRP, ADA, DOGE, and DOT
Duo Nine writes Why is the Shiba Inu (SHIB) Price Down Today?
- After recovering from $1.45, XTZ bulls are now pushing back at crucial resistance of $1.80
- While consolidating, Tezos is waiting for a huge price movement across its trading pairs
- Against Bitcoin, XTZ keep trading around 25000 SAT support as it looks for a strong rebound level
XTZ/USD: Tezos Struggles In A Tight Range
Key Resistance Levels: $1.80, $2, $2.5
Key Support Levels: $1.45, $1.25, $0.845
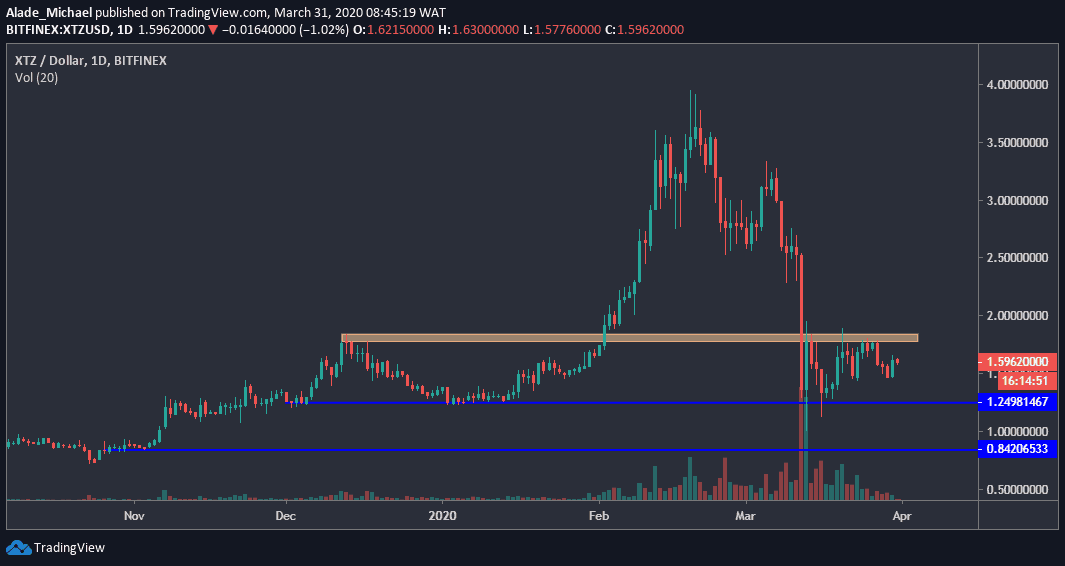
Since our previous price analysis, the price of Tezos has been trading in a tight price range ($1.25 – $1.8), now holding as solid support and resistance for the past two weeks.
Interestingly, Tezos has managed to establish minor support around $1.45 for the past ten days to indicate that buyers are showing in the market. However, the bulls are still facing stiff resistance around $1.8, which is marked orange on the daily chart.
At the time of writing, XTZ, the 10th best-performing coin, is up by 0.2% and trading at $1.59 against the US Dollar. However, Tezos would need to move out of this tight price zone before we can determine the next actual direction of the market
Tezos Price Analysis
Following yesterday’s bounce from $1.45, Tezos is rising again towards a critical resistance level of $1.8. If the buyers push and reclaim this resistance, the next level to conquer will be $2.
Once they clear this resistance, the price of XTZ could reach $2.5 quickly.
Meanwhile, Tezos is currently supported by $1.45. If the price drops and slips below this minor support, the first blue line of $1.25 would serve as support for the market, followed by $0.845, which is the second blue line.
A breach beneath these lines could lead to mid-term bearish price actions.
XTZ/BTC: Tezos Keeps Trading At 25000 SAT Level
Key Support Levels: 30000 SAT, 35000 SAT, 40000 SAT
Key Resistance Levels: 20000 SAT, 15000 SAT, 10000 SAT

Against Bitcoin, Tezos is down by 2.01% over the last 24-hours of trading. The market is still in a downward trend, although the bearish action appeared to be exhausted.
Tezos has continued to trade around 25000 SAT (the orange support area on the daily chart) for a while now, waiting for a rebound.
There’s no sign of buying pressure at the moment. But Tezos could regain momentum as soon as the bulls show a strong commitment to the market.
Tezos Price Analysis
Looking at the above chart, there’s no volatility in the XTZ/USD pair since the mid-March crash.
If volatility expands to the upsides, the immediate resistance for the bulls is 30000 SAT, followed by 35000 SAT and 40000 SAT resistance levels in the short-term. An increase above these resistances would signal a continuation of the bullish trend.
On the other hand, Tezos could concurrently plunge to 20000 SAT, 15000 SAT, and 10000 SAT support levels if volatility explodes below the red rising trend line, which is drawn from October 2019 low.