Ethereum dropped by as little as1.6% today as the cryptocurrency retraces from the 3.50 resistance level.Against Bitcoin, ETH broke the 100-days EMA to climb above the significant 0.02 BTC price level.Ethereum is still up by an impressive 40% over the course of the last 30 days.Key Support & Resistance LevelsETH/USDSupport: 3, 9.54, 2.50.Resistance: 3.50, 0, 2.ETH/BTC:Support: 0.02 BTC, 0.0194 BTC, 0.0185 BTC.Resistance: 0.0204 BTC, 0.021 BTC, 0.0218 BTC .ETH/USD – Ethereum Struggles At The November 2019 ResistanceSince our last analysis, ETH climbed above the resistance at 5 and increased even higher to meet the 3.50 level. The cryptocurrency failed to break above the latter and, instead, rolled over back toward the 5 price level.This level of resistance had
Topics:
Yaz Sheikh considers the following as important: ETH Analysis, Ethereum (ETH) Price
This could be interesting, too:
Mandy Williams writes Ethereum Derivatives Metrics Signal Modest Downside Tail Risk Ahead: Nansen
CryptoVizArt writes Will Weak Momentum Drive ETH to .5K? (Ethereum Price Analysis)
Mandy Williams writes Ethereum Key Metrics Point to Persistent Bullish Outlook for ETH: CryptoQuant
CryptoVizArt writes Ethereum Price Analysis: Following a 15% Weekly Crash, What’s Next for ETH?
- Ethereum dropped by as little as1.6% today as the cryptocurrency retraces from the $193.50 resistance level.
- Against Bitcoin, ETH broke the 100-days EMA to climb above the significant 0.02 BTC price level.
- Ethereum is still up by an impressive 40% over the course of the last 30 days.
Key Support & Resistance Levels
ETH/USD
Support: $173, $169.54, $162.50.
Resistance: $193.50, $200, $212.
ETH/BTC:
Support: 0.02 BTC, 0.0194 BTC, 0.0185 BTC.
Resistance: 0.0204 BTC, 0.021 BTC, 0.0218 BTC .
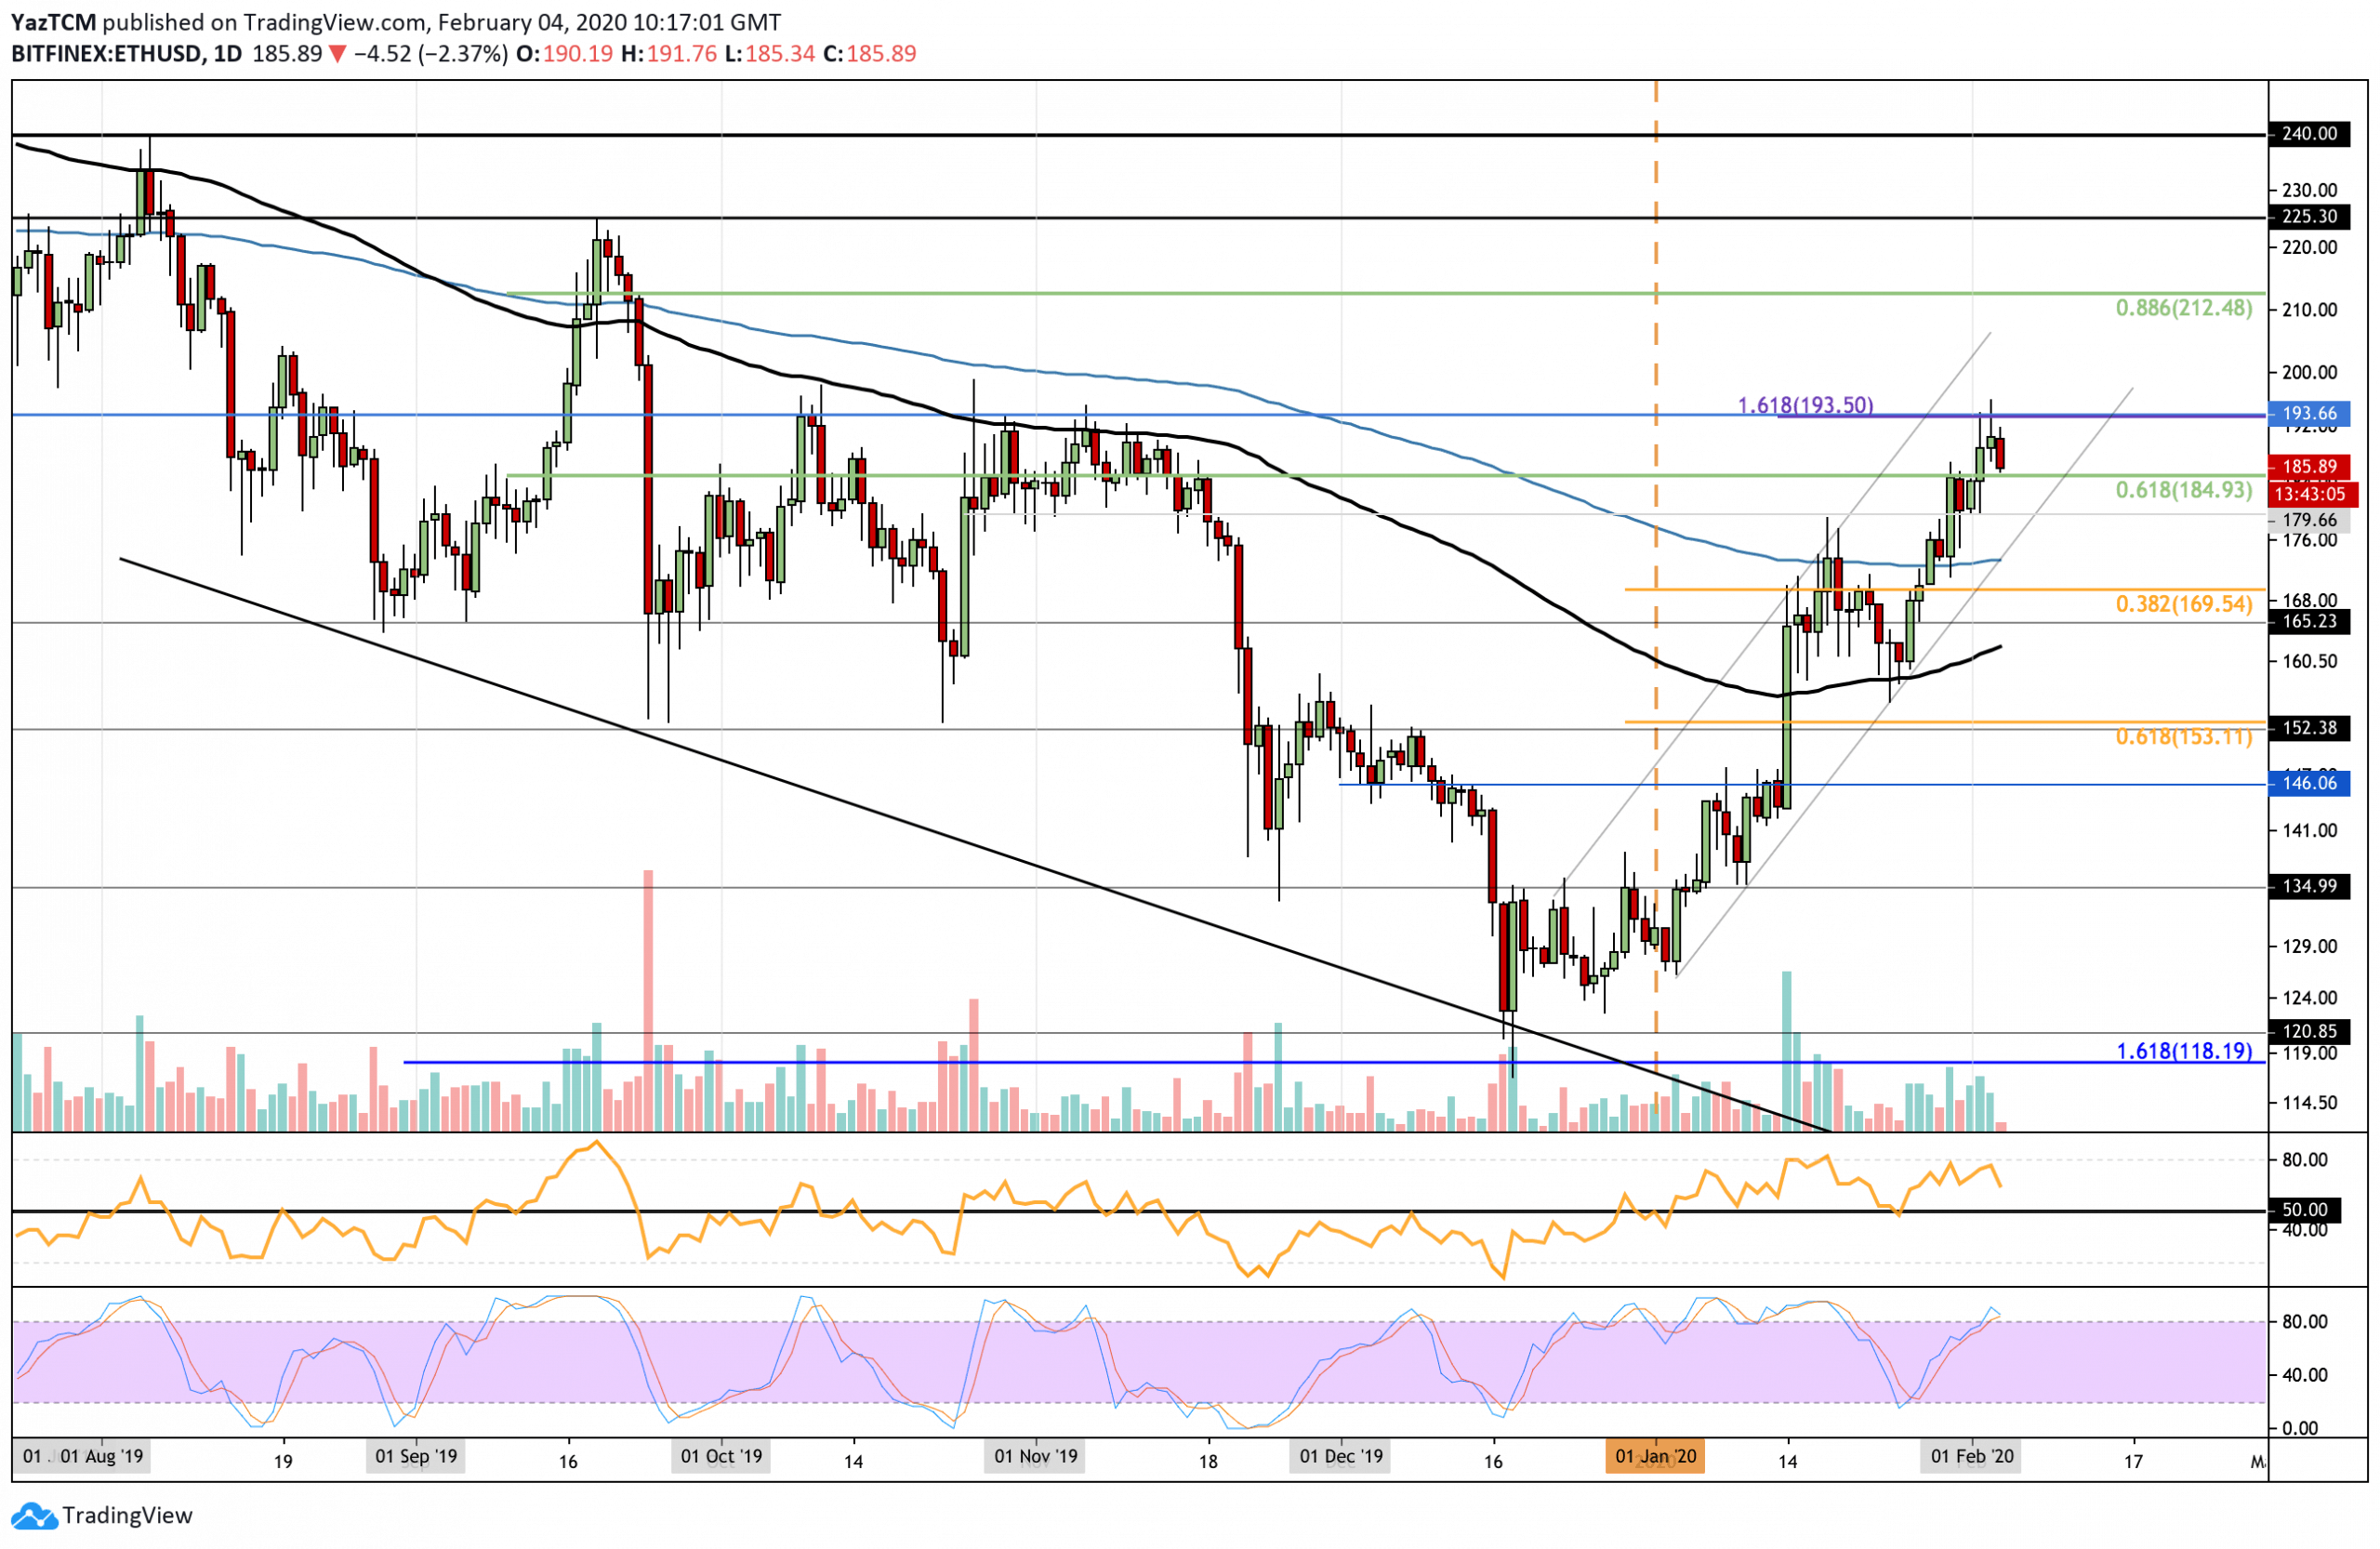
ETH/USD – Ethereum Struggles At The November 2019 Resistance
Since our last analysis, ETH climbed above the resistance at $185 and increased even higher to meet the $193.50 level. The cryptocurrency failed to break above the latter and, instead, rolled over back toward the $185 price level.
This level of resistance had provided some “problems” for the market during both October and November 2019 and, therefore, is expected to provide significant resistance moving forward. The cryptocurrency continues to trade within the ascending price channel and support is expected at the lower boundary.
Despite the recent price decline, ETH remains bullish – so long as it stays above the 200-days EMA. If it was to drop beneath the $158 level, the coin would be considered as bearish.
Ethereum-USD Short Term Price Prediction
If the selling pressure causes ETH to drop beneath $185, support can be found at $173 (200-days EMA). If they continue to push Ethereum lower, further support lies at $169.54 – $170 (.382 Fib Retracement), $162.50 (100-days EMA), and $153.
On the other side, If the bulls rebound at $185, the next major resistance remains at $193.50. Above this, further resistance lies at $200 and $212 (bearish .886 Fib Retracement).
The RSI is above the 50 levels, however, it has started to point downward to show that the bullish pressure is fading. Furthermore, some divergence has also appeared between the RSI and price action which indicates a reversal may be imminent. Additionally, the Stochastic RSI is primed for a bearish crossover signal which might send the market for a correction.
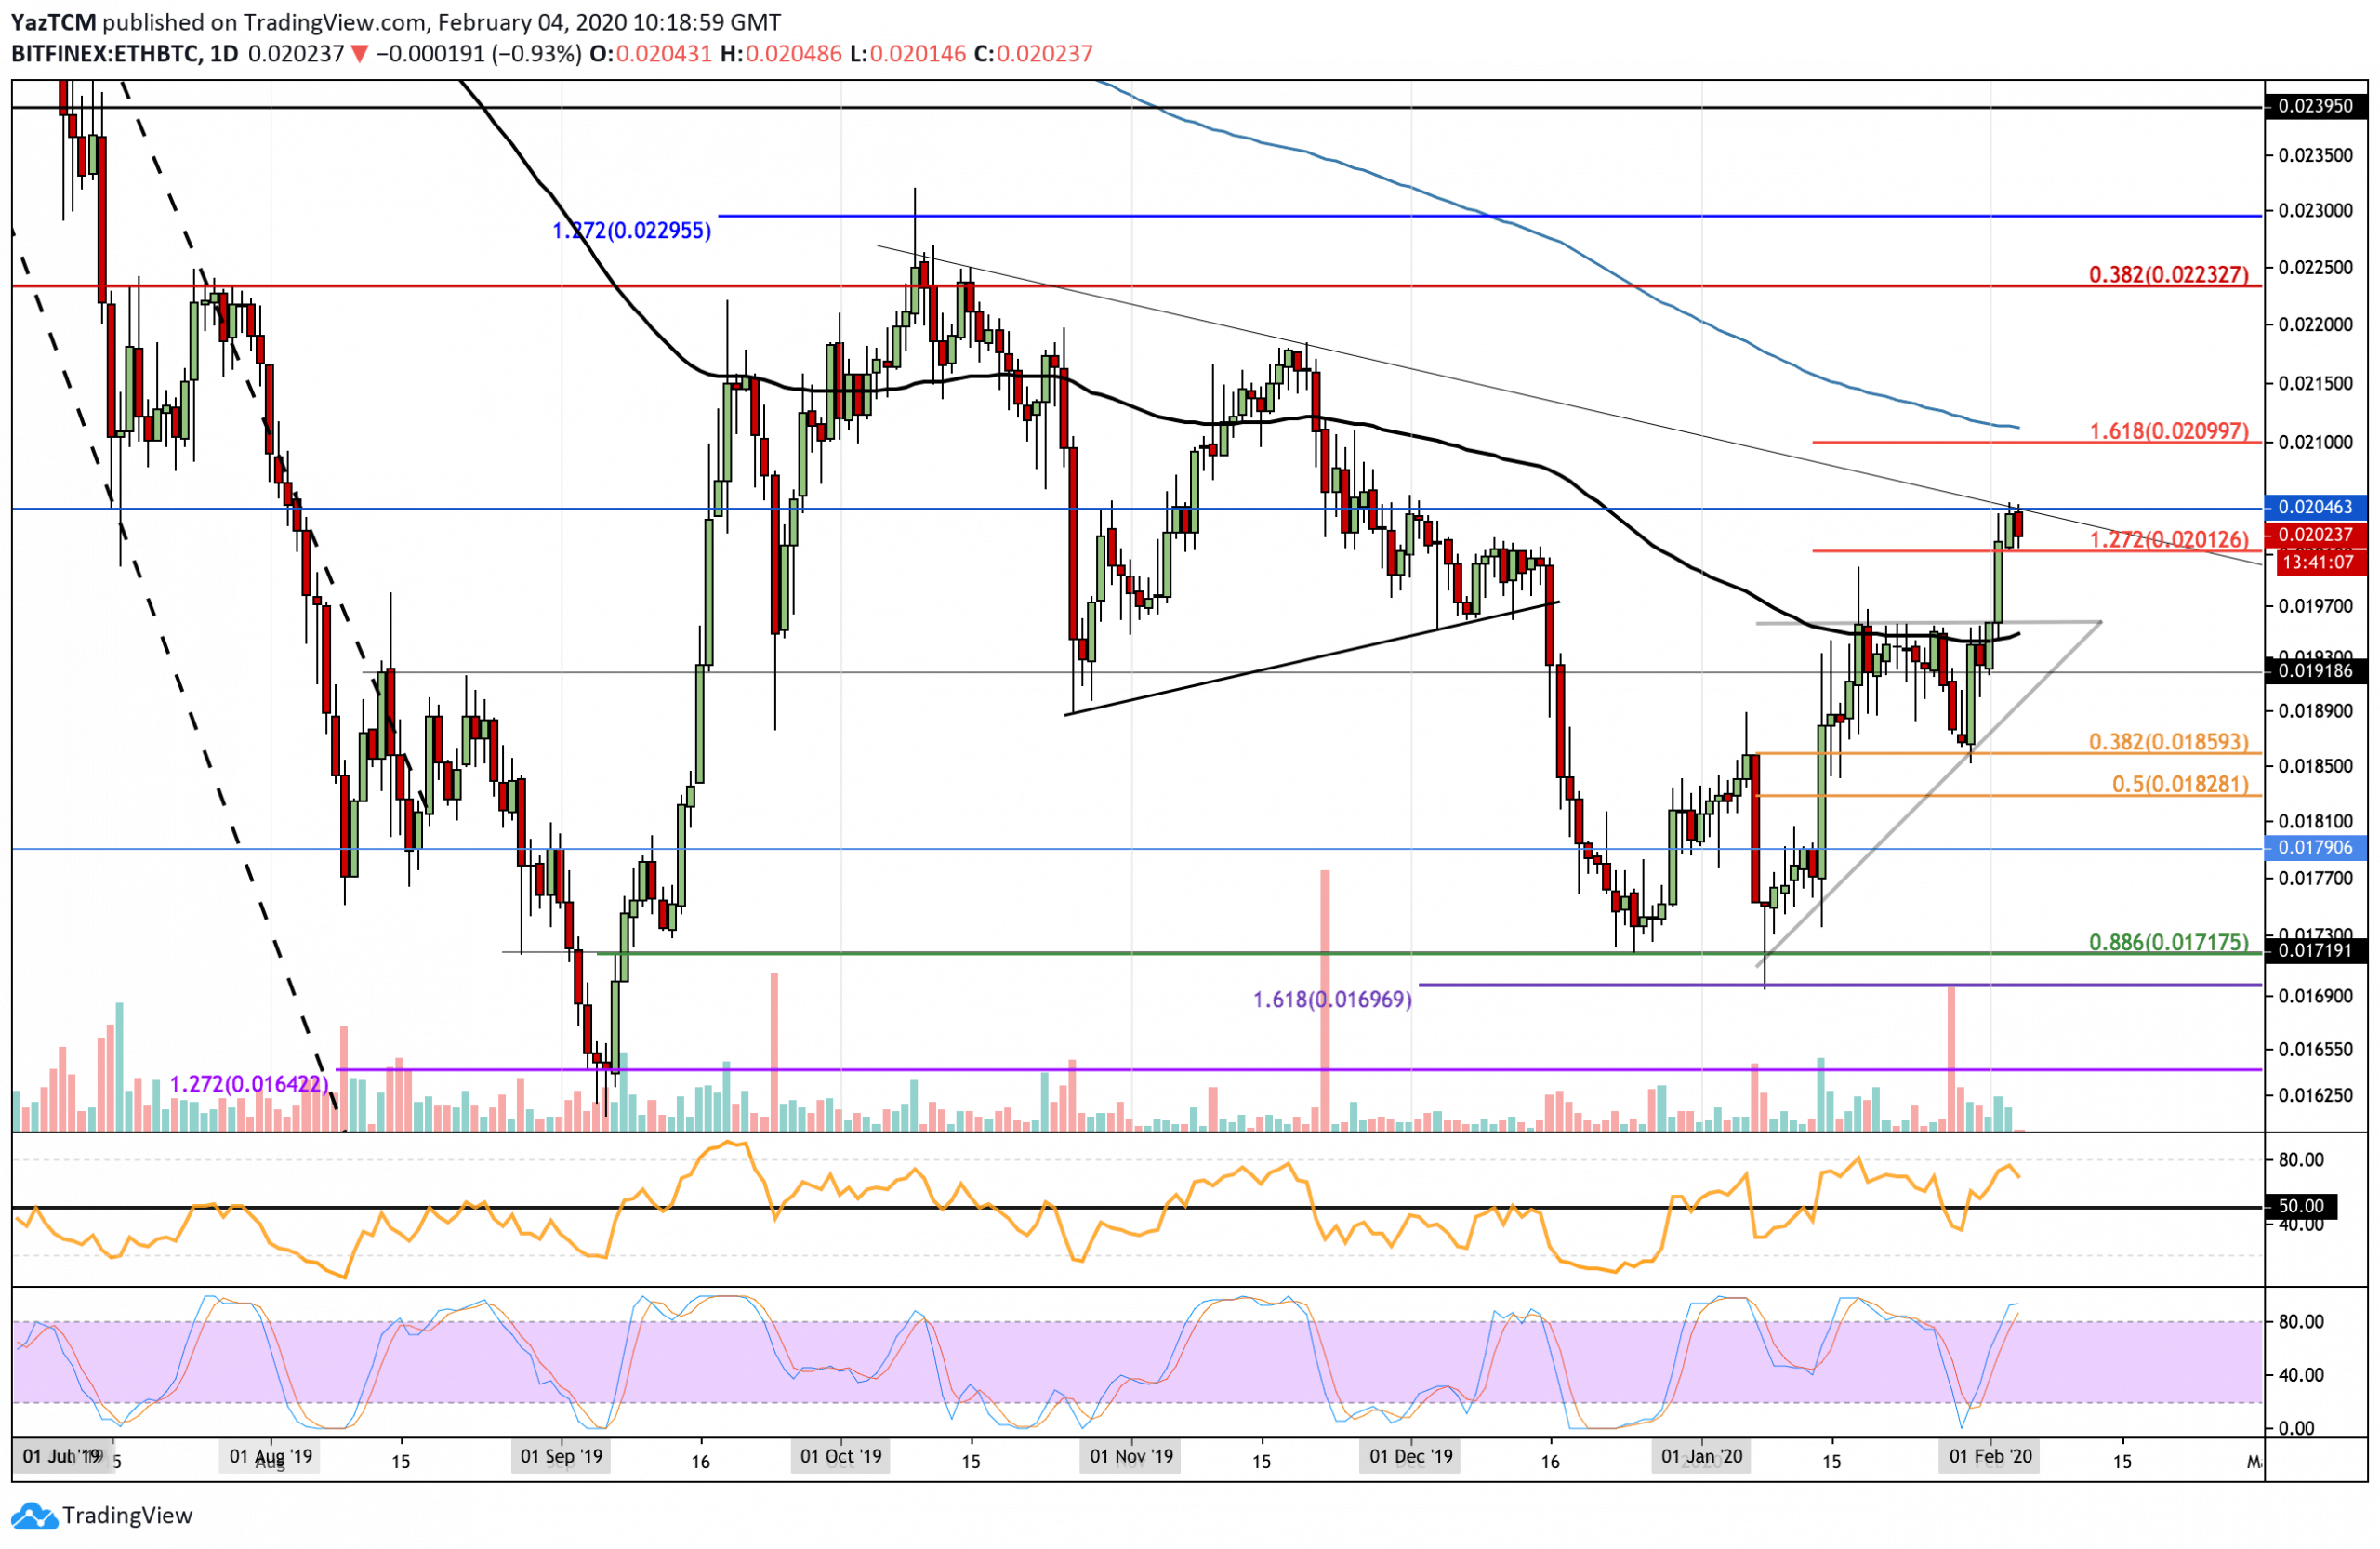
ETH/BTC – ETH Facing The 0.0204 BTC Resistance
Against Bitcoin, Ethereum rose above the resistance provided by the 100-days EMA and continued further higher to reach 0.0204 BTC before stalling.
This has led to ETH/BTC returning to the December 2019 highs as it looks to pass this resistance. Additionally, the cryptocurrency experienced added resistance from a 4-month-old descending trend line and was unable to close above this combined resistance level.
After creating a fresh high above the January high, Ethereum/BTC can now be considered as bullish in the short term. However, if it was to drop back beneath 0.02 BTC it would be considered as neutral with a further drop beneath 0.0185 BTC turning it bearish.
Ethereum-BTC Short Term Price Prediction
Looking at the short-term, if the bearish pressure drives ETH beneath 0.02 BTC, support is expected around 0.0195 BTC (100-days EMA). Beneath this, support lies at 0.0185 BTC and 0.0181 BTC.
Alternatively, if the bulls hold the 0.02 BTC level and rebound, the first level of resistance lies at 0.0204 BTC. Above this, resistance lies at 0.021 BTC, 0.0218 BTC, 0.022 BTC, and 0.0223 BTC.
Similarly, the RSI is now pointing down to indicate a fading bullish momentum. This combined with the Stochastic RSI being ready for a bearish crossover signal leads to the assumption that Ethereum might be heading lower pretty soon.