ETH/USD – Ethereum Stalled By September High-Day Closing Price Key Support Levels: 5, 9, 0.Key Resistance Levels: 2.50, 5, 0. Etheruem reached as high as 5 last Friday, where it hit the resistance at the September high-day close. From there, it headed lower over the weekend, which was largely due to Bitcoin dropping back beneath the ,000 level and some divergence playing out that we highlighted in the last analysis. As a result, Ethereum fell as low as 9 (August 2018 high) yesterday. The coin went on to close above the 5 support. It has since rebounded slightly to trade at 6 today. ETH/USD Daily Chart. Source: TradingViewETH-USD Short Term Price Prediction Looking ahead, if the buyers can push higher again, the first level of resistance
Topics:
Yaz Sheikh considers the following as important: ETH Analysis, ETHBTC, Ethereum (ETH) Price, ethusd
This could be interesting, too:
Mandy Williams writes Ethereum Derivatives Metrics Signal Modest Downside Tail Risk Ahead: Nansen
Jordan Lyanchev writes Weekly Bitcoin, Ethereum ETF Recap: Light at the End of the Tunnel for BTC
CryptoVizArt writes Will Weak Momentum Drive ETH to .5K? (Ethereum Price Analysis)
Jordan Lyanchev writes Bybit Hack Fallout: Arthur Hayes, Samson Mow Push for Ethereum Rollback
ETH/USD – Ethereum Stalled By September High-Day Closing Price
Key Support Levels: $445, $439, $430.
Key Resistance Levels: $462.50, $475, $490.
Etheruem reached as high as $475 last Friday, where it hit the resistance at the September high-day close. From there, it headed lower over the weekend, which was largely due to Bitcoin dropping back beneath the $16,000 level and some divergence playing out that we highlighted in the last analysis.
As a result, Ethereum fell as low as $439 (August 2018 high) yesterday. The coin went on to close above the $445 support. It has since rebounded slightly to trade at $456 today.
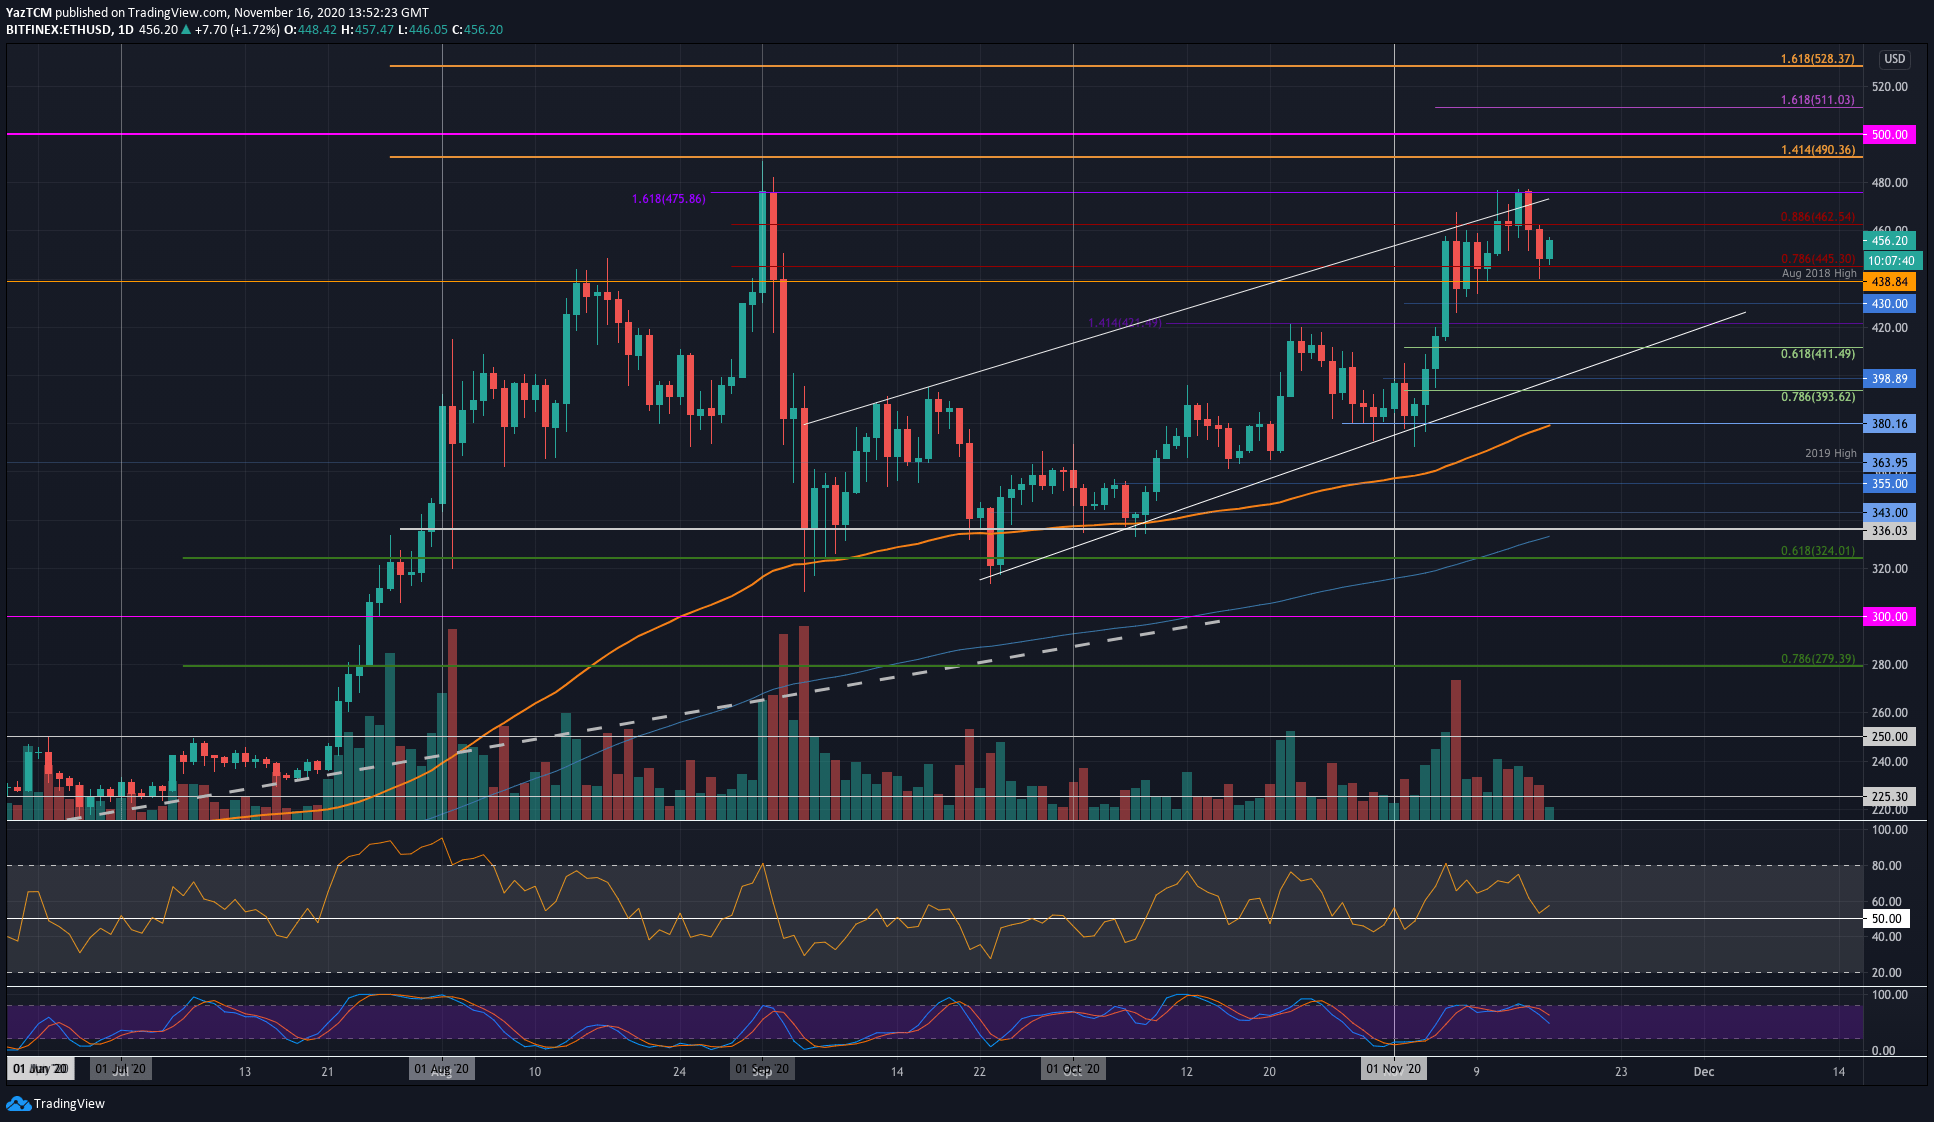
ETH-USD Short Term Price Prediction
Looking ahead, if the buyers can push higher again, the first level of resistance lies at $462 (bearish .886 Fib Retracement). Following this, the major resistance is expected at $475 (September high-day close) and then $500.
On the other side, the first level of support lies at $445. Beneath this, support lies at $438, $430, and $420.
The RSI bounced from the mid-line to indicate that the buyers are still unwilling to give up their control of the market momentum just yet. However, the Stochastic RSI did produce a bearish crossover signal, which is a bad sign for the bulls.
ETH/BTC – Bears Push ETH Down To 0.0278 BTC
Key Support Levels: 0.0278 BTC, 0.0273 BTC, 0.0272 BTC.
Key Resistance Levels: 0.0284 BTC, 0.029 BTC, 0.0295 BTC.
Against Bitcoin, Ethereum has headed lower since it met the resistance at the 200-days EMA last week. It had pushed higher on Friday to reach 0.0293 BTC but eventually dropped lower on Saturday.
Yesterday, Ethereum fell beneath the support at 0.0284 BTC (Feb 2020 Highs) as it dropped lower into the 0.0278 BTC level where it is currently trading today.
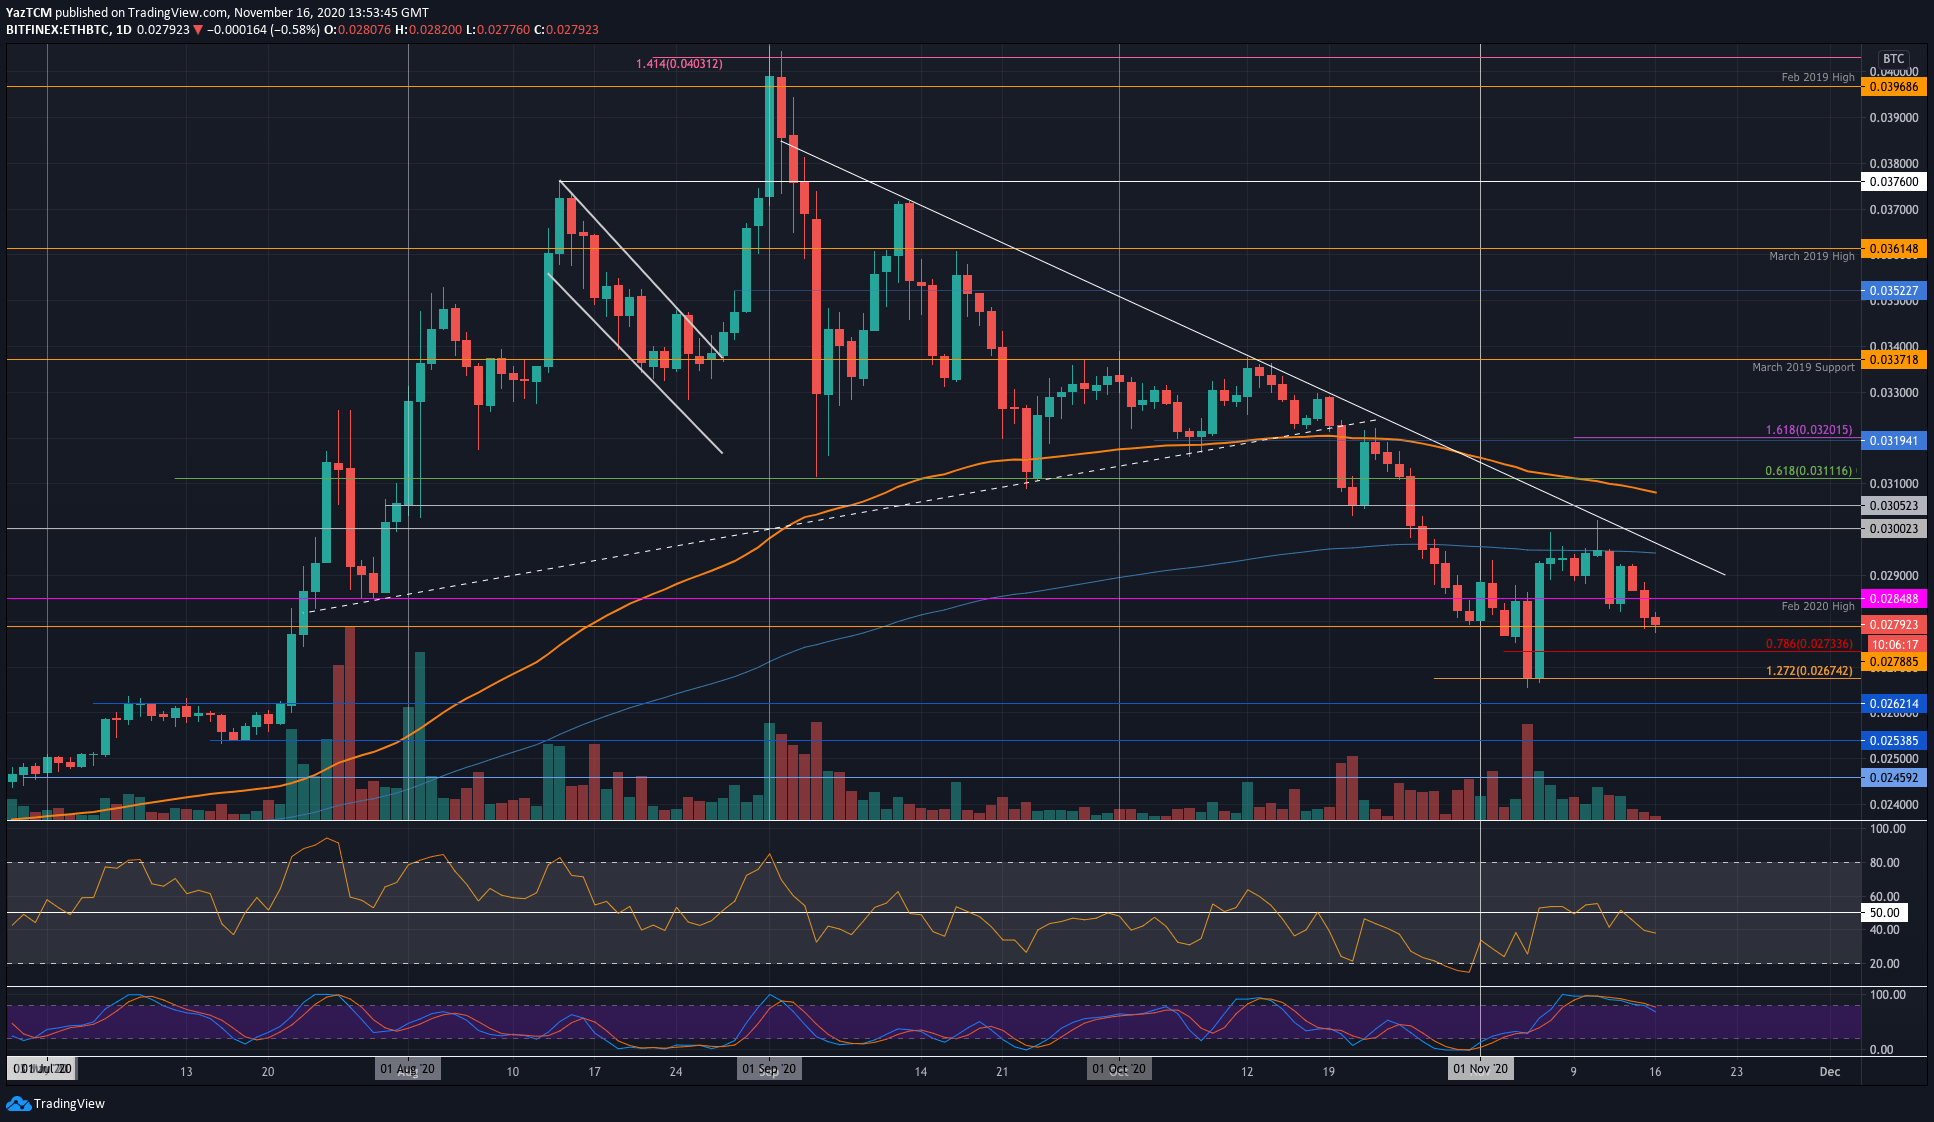
ETH-BTC Short Term Price Prediction
Looking ahead, if the sellers push beneath the 0.0278 BTC level, support is expected at 0.0273 BTC (.786 Fib) and 0.0272 BTC. Following this, additional support lies at 0.0267 BTC (November lows), 0.0262 BTC, and 0.026 BTC.
On the other side, the first level of resistance lies at 0.0284 BTC (Feb 2020 Highs). Above this, resistance lies at 0.029 BTC (falling trend line), 0.0295 BTC (200-days EMA), and 0.03 BTC.
The RSI is beneath the mid-line to indicate bearish momentum is dominating the market.