Ethereum saw a 2.2% price decline today as it dropped from 0 level to hit 0 today.Earlier in the week, ETH rebounded from the strong 5 support, which allowed it to start to climb toward 0 this week.Against Bitcoin, Ethereum created a fresh 3-month high after breaking above 0.026 BTC to reach 0.0263 BTC.Key Support & Resistance LevelsETH/USD:Support: 5, 5, 0.Resistance: 0, 5, 4.ETH/BTC:Support: 0.026 BTC, 0.0245 BTC, 0.0239 BTC.Resistance: 0.0263 BTC, 0.0266 BTC, 0.027 BTC.ETH/USD: Can ETH Bulls Break 0?ETH started July off by trading at the support at 5. The bulls defended this support, which allowed them to push higher during the week. The coin managed to push above resistance at 5 (bearish .786 Fib Retracement) to reach 7 – not quite hitting 0
Topics:
Yaz Sheikh considers the following as important: ETH Analysis, ETHBTC, Ethereum (ETH) Price, ethusd
This could be interesting, too:
CryptoVizArt writes Will Weak Momentum Drive ETH to .5K? (Ethereum Price Analysis)
Jordan Lyanchev writes Bybit Hack Fallout: Arthur Hayes, Samson Mow Push for Ethereum Rollback
Mandy Williams writes Ethereum Key Metrics Point to Persistent Bullish Outlook for ETH: CryptoQuant
CryptoVizArt writes Ethereum Price Analysis: Following a 15% Weekly Crash, What’s Next for ETH?
- Ethereum saw a 2.2% price decline today as it dropped from $250 level to hit $240 today.
- Earlier in the week, ETH rebounded from the strong $225 support, which allowed it to start to climb toward $250 this week.
- Against Bitcoin, Ethereum created a fresh 3-month high after breaking above 0.026 BTC to reach 0.0263 BTC.
Key Support & Resistance Levels
ETH/USD:
Support: $225, $215, $210.
Resistance: $250, $265, $274.
ETH/BTC:
Support: 0.026 BTC, 0.0245 BTC, 0.0239 BTC.
Resistance: 0.0263 BTC, 0.0266 BTC, 0.027 BTC.
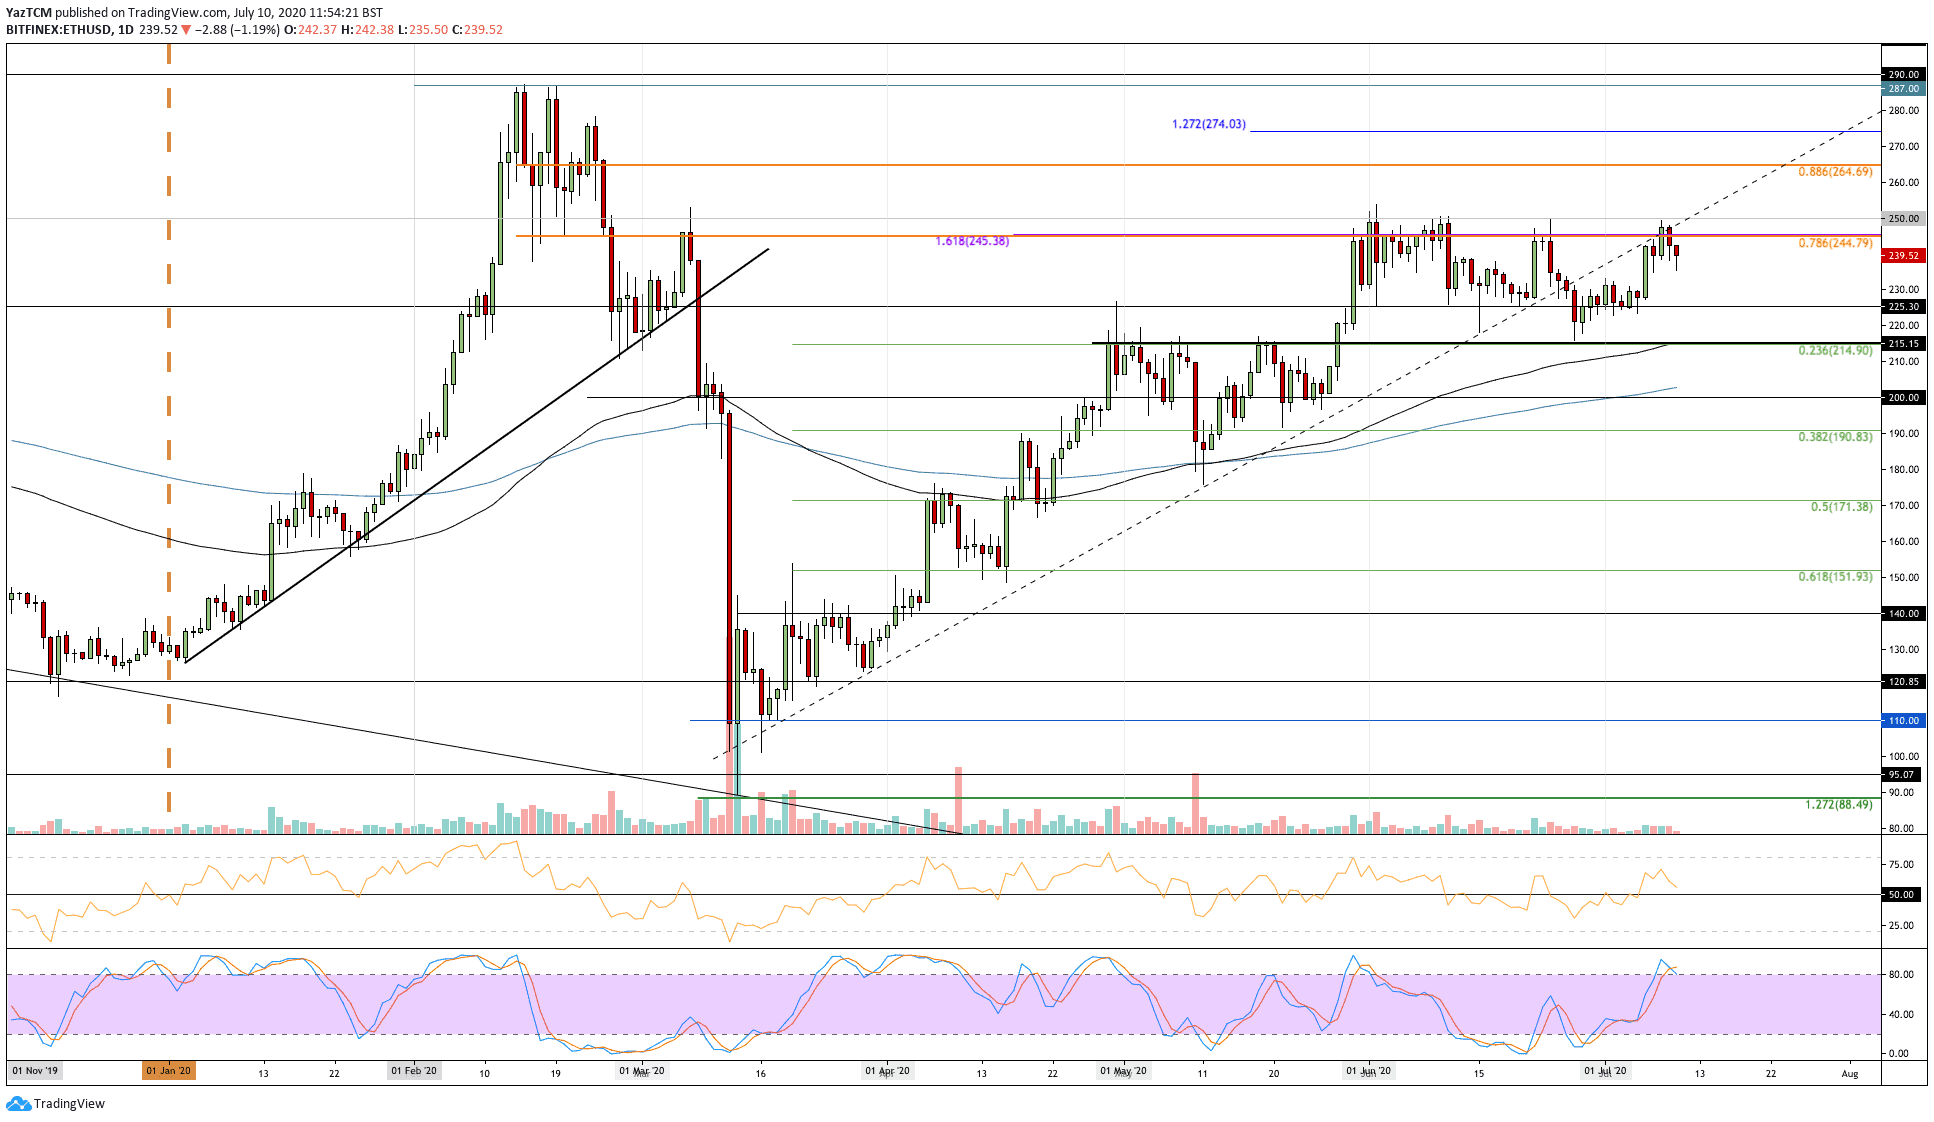
ETH/USD: Can ETH Bulls Break $250?
ETH started July off by trading at the support at $225. The bulls defended this support, which allowed them to push higher during the week. The coin managed to push above resistance at $245 (bearish .786 Fib Retracement) to reach $247 – not quite hitting $250 just yet.
Today, the sellers pushed ETH to $240. A break above $250 would create a fresh 5-month high for ETH and would kick start a bullish run higher toward the 2020 high price of $287.
ETH-USD Short Term Price Prediction
Looking ahead, once $250 has been tackled, higher resistance is then located at $265 (bearish .886 Fib Retracement), $274 (1.272 Fib Extension), and $287 (2020 price high).
On the other side, if the sellers push lower, the first level of strong support lies at $225. Beneath this, added support is found at $215 (.236 Fib Retracement & 100-day EMA), $200 (200-day EMA), and $190 (.382 Fib Retracement).
The RSI is above the 50 line to indicate that the bulls are in charge of the market momentum. It is also not overbought, which suggests that the bulls still have room to push higher.
ETH/BTC: ETH Creates Fresh 3-Month High Against BTC.
Against Bitcoin, ETH had broken the strong resistance at 0.0253 BTC earlier in the week. This resistance had stalled ETH from climbing higher during both May and June 2020.
After pushing above 0.0253 BTC, ETH ran into resistance at 0.026 BTC (bearish .786 Fib Retracement). The coin managed to break above this resistance yesterday to reach the 0.0263 BTC level. It has since dropped to 0.026 BTC.

ETH-BTC Short Term Price Prediction
Looking ahead, if the bulls push higher above 0.0263 BTC, an initial resistance is found at 0.0266 (bearish .886 Fib Retracement). Above this, added resistance lies at 0.027 BTC, 0.0273 BTC, and 0.0278 BTC.
On the other hand, if the sellers push lower, the first level of support lies at 0.026 BTC. Beneath this, added support is found at 0.0245 BTC and 0.0239 BTC (100-days EMA).
The RSI is above the 50 line but is approaching overbought conditions, which suggest that the buyers may be a little exhausted. This is further confirmed by the Stochastic RSI, which is primed for a bearish crossover signal that would send ETH lower against Bitcoin.