Ethereum saw a small 0.5% price increase today as it continues to battle the 0 resistance level.The cryptocurrency has been bouncing in a very tight range between 5 and 0 for the past 4-days.Ethereum dropped beneath the crucial 0.021 BTC support this week to drop as low as 0.0201 BTC.Key Support & Resistance LevelsETH/USD:Support: 5, 0, 0.Resistance: 0, 0, 5.ETH/BTC:Support: 0.0201 BTC, 0.02 BTC, 0.0196 BTC.Resistance: 0.021 BTC, 0.0215 BTC, 0.022 BTC.ETH/USD: Trading Within Ascending Triangle PatternSince the March market capitulation, Ethereum has been trading within a period of consolidation as it trades inside an ascending triangle pattern. The cryptocurrency is currently trading at the upper boundary of the triangle as it struggles to overcome the resistance
Topics:
Yaz Sheikh considers the following as important: ETH Analysis, Ethereum (ETH) Price
This could be interesting, too:
Mandy Williams writes Ethereum Derivatives Metrics Signal Modest Downside Tail Risk Ahead: Nansen
CryptoVizArt writes Will Weak Momentum Drive ETH to .5K? (Ethereum Price Analysis)
Mandy Williams writes Ethereum Key Metrics Point to Persistent Bullish Outlook for ETH: CryptoQuant
CryptoVizArt writes Ethereum Price Analysis: Following a 15% Weekly Crash, What’s Next for ETH?
- Ethereum saw a small 0.5% price increase today as it continues to battle the $140 resistance level.
- The cryptocurrency has been bouncing in a very tight range between $135 and $140 for the past 4-days.
- Ethereum dropped beneath the crucial 0.021 BTC support this week to drop as low as 0.0201 BTC.
Key Support & Resistance Levels
ETH/USD:
Support: $135, $120, $110.
Resistance: $140, $150, $165.
ETH/BTC:
Support: 0.0201 BTC, 0.02 BTC, 0.0196 BTC.
Resistance: 0.021 BTC, 0.0215 BTC, 0.022 BTC.
ETH/USD: Trading Within Ascending Triangle Pattern
Since the March market capitulation, Ethereum has been trading within a period of consolidation as it trades inside an ascending triangle pattern. The cryptocurrency is currently trading at the upper boundary of the triangle as it struggles to overcome the resistance at $140.
Triangles typically break in the direction of the previous trend, and, in this case, it would be bearish. If ETH cannot break $140 as we head closer to the apex, then it is most likely going to break toward the downside and head back toward $110.
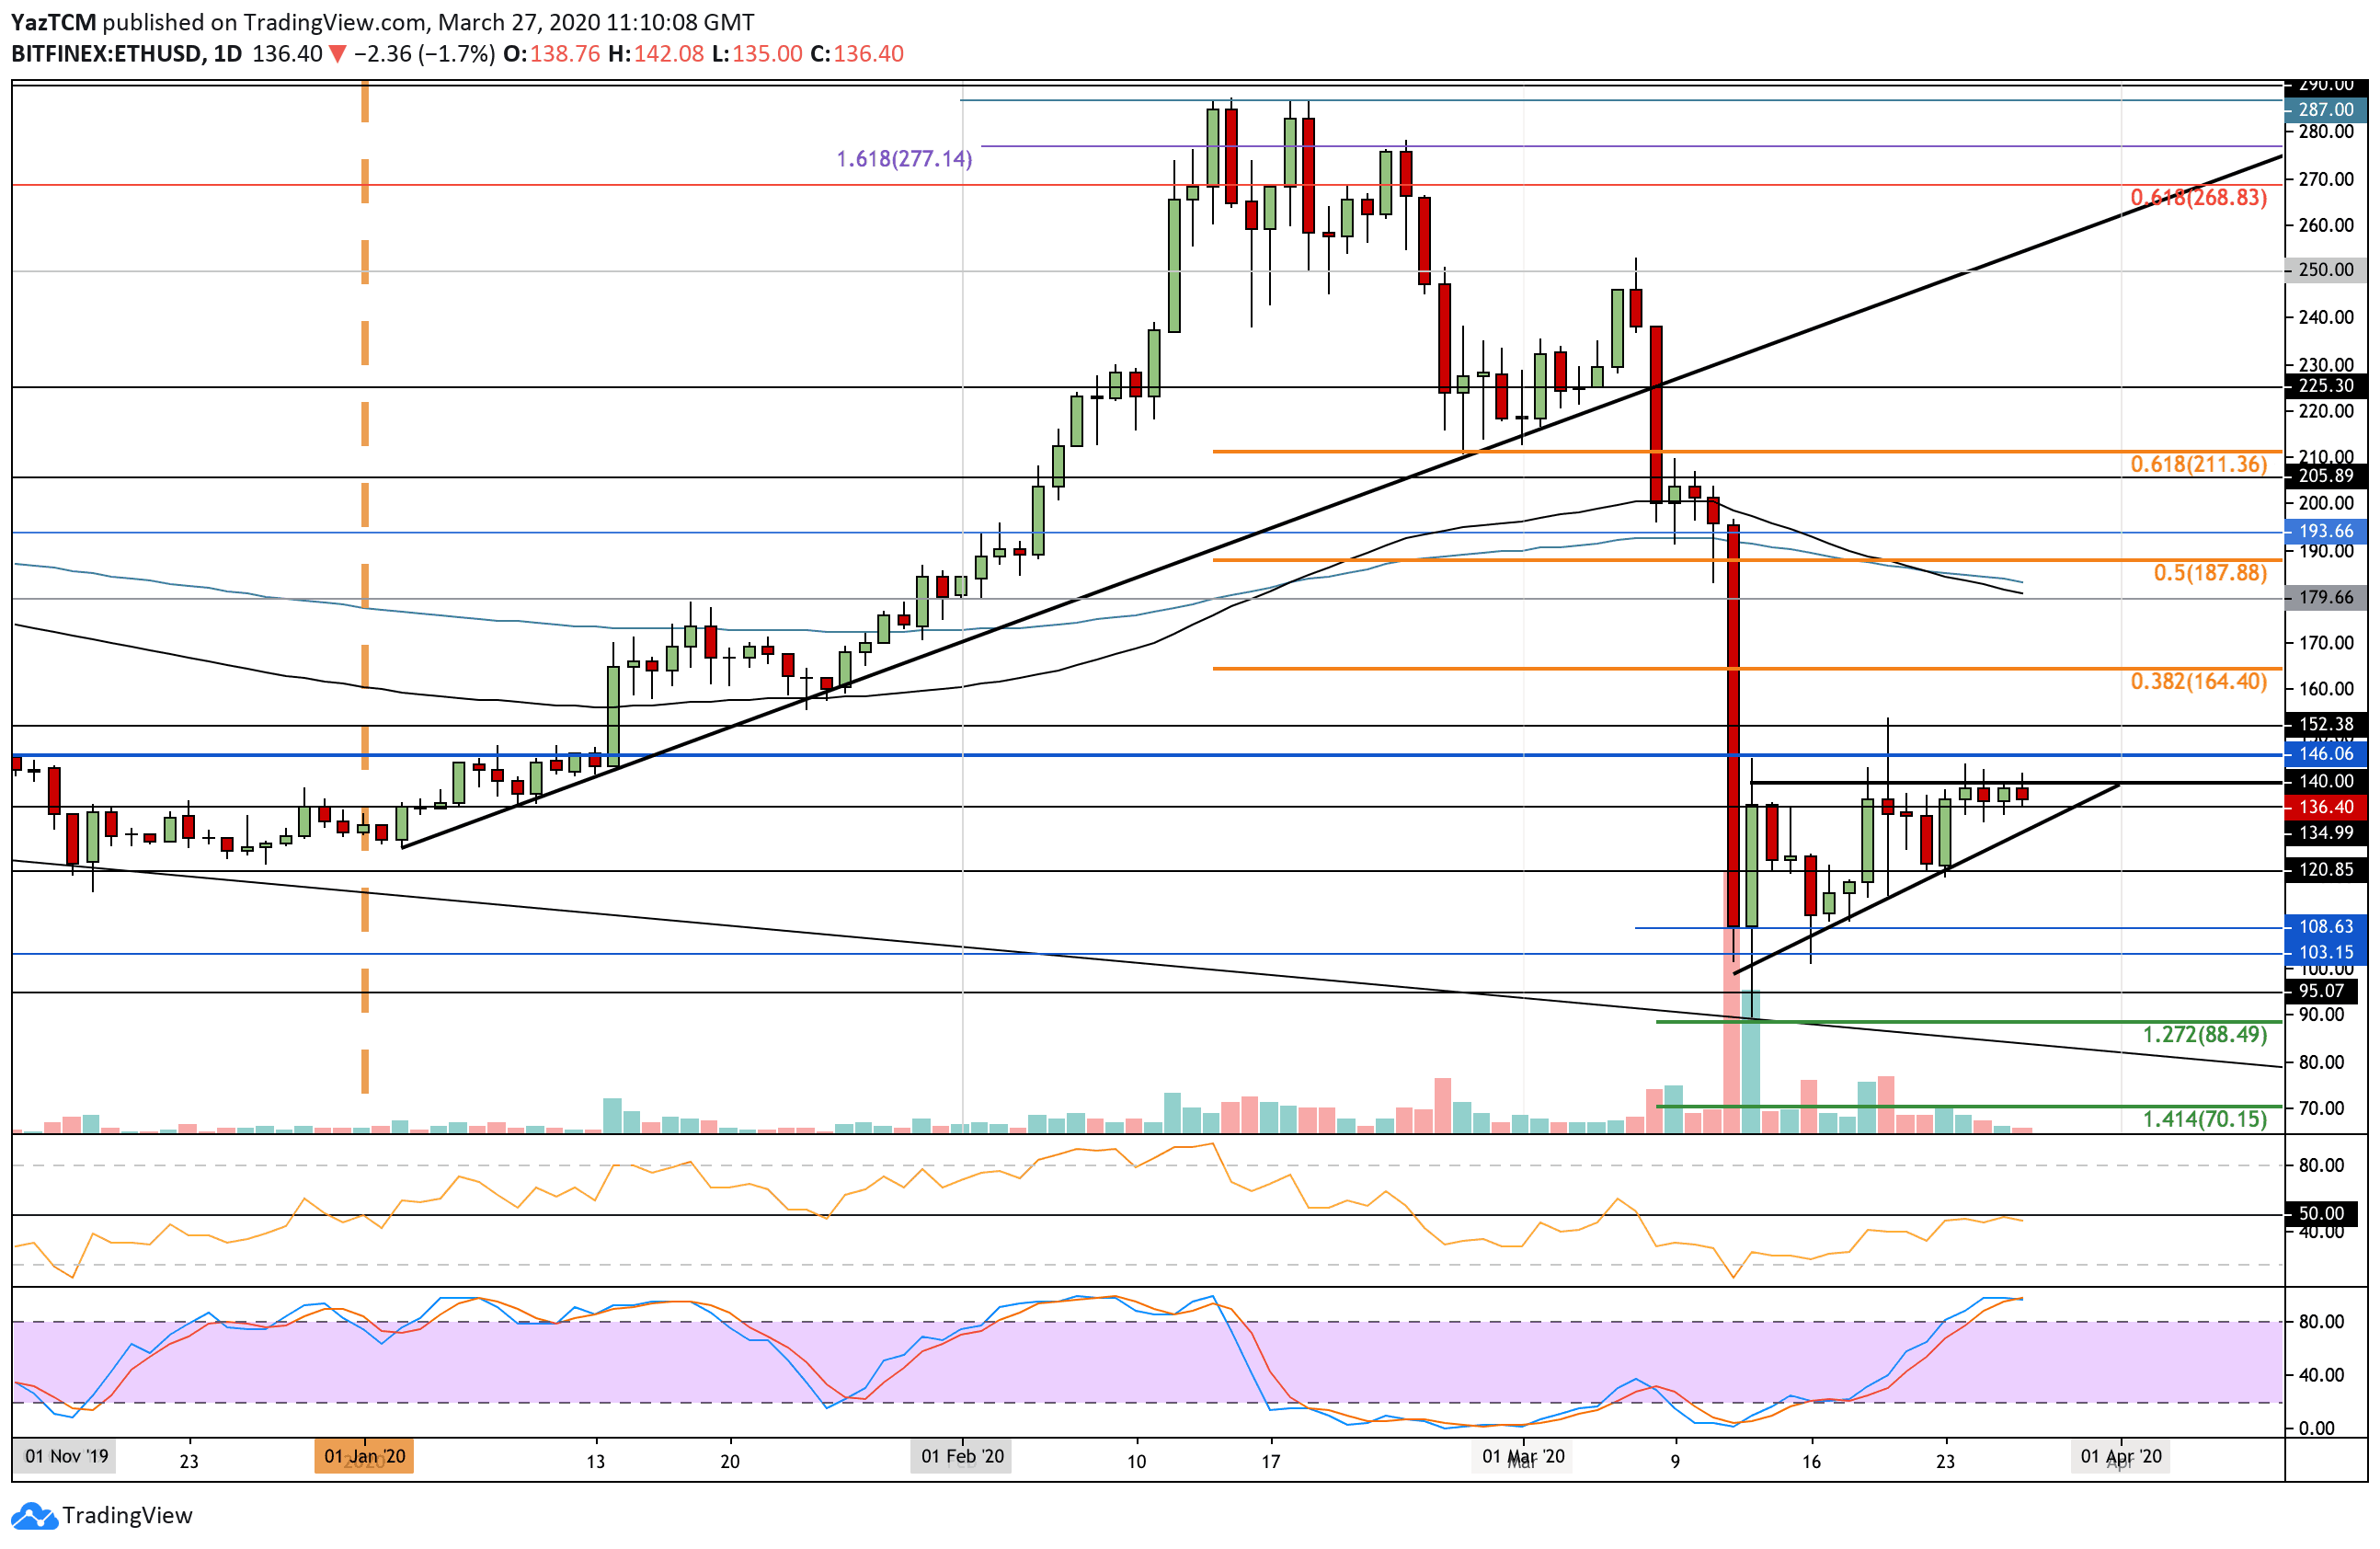
ETH/USD Short Term Price Prediction
If the buyers can break $140, the first levels of resistance lie at $145 and $150. Above this, resistance lies at $165 (bearish .382 Fib Retracement) and $180 (100-days EMA).
Toward the downside, the first level of support lies at $135. Beneath this, support lies at the rising trend line, $120, $110, and $105. If the sellers break $100, support can be found at $95 and $88.50.
The RSI has turned away from the 50 level, which shows the bulls are failing to take control over the market momentum. Additionally, the Stochastic RSI is primed for a bearish crossover signal that would send the market lower.
These two indicators lean to the fact that Ethereum is likely to break beneath this short term triangle.
ETH/BTC: Will ETH Break Beneath 0.02 BTC?
Against Bitcoin, Ethereum clocked a fresh low for March at 0.0201 BTC after breaking beneath the crucial 0.021 BTC support earlier in the week.
The bulls have bounced higher from here. However, the momentum is clearly on the side of the sellers as they gear up for another push toward 0.02 BTC.
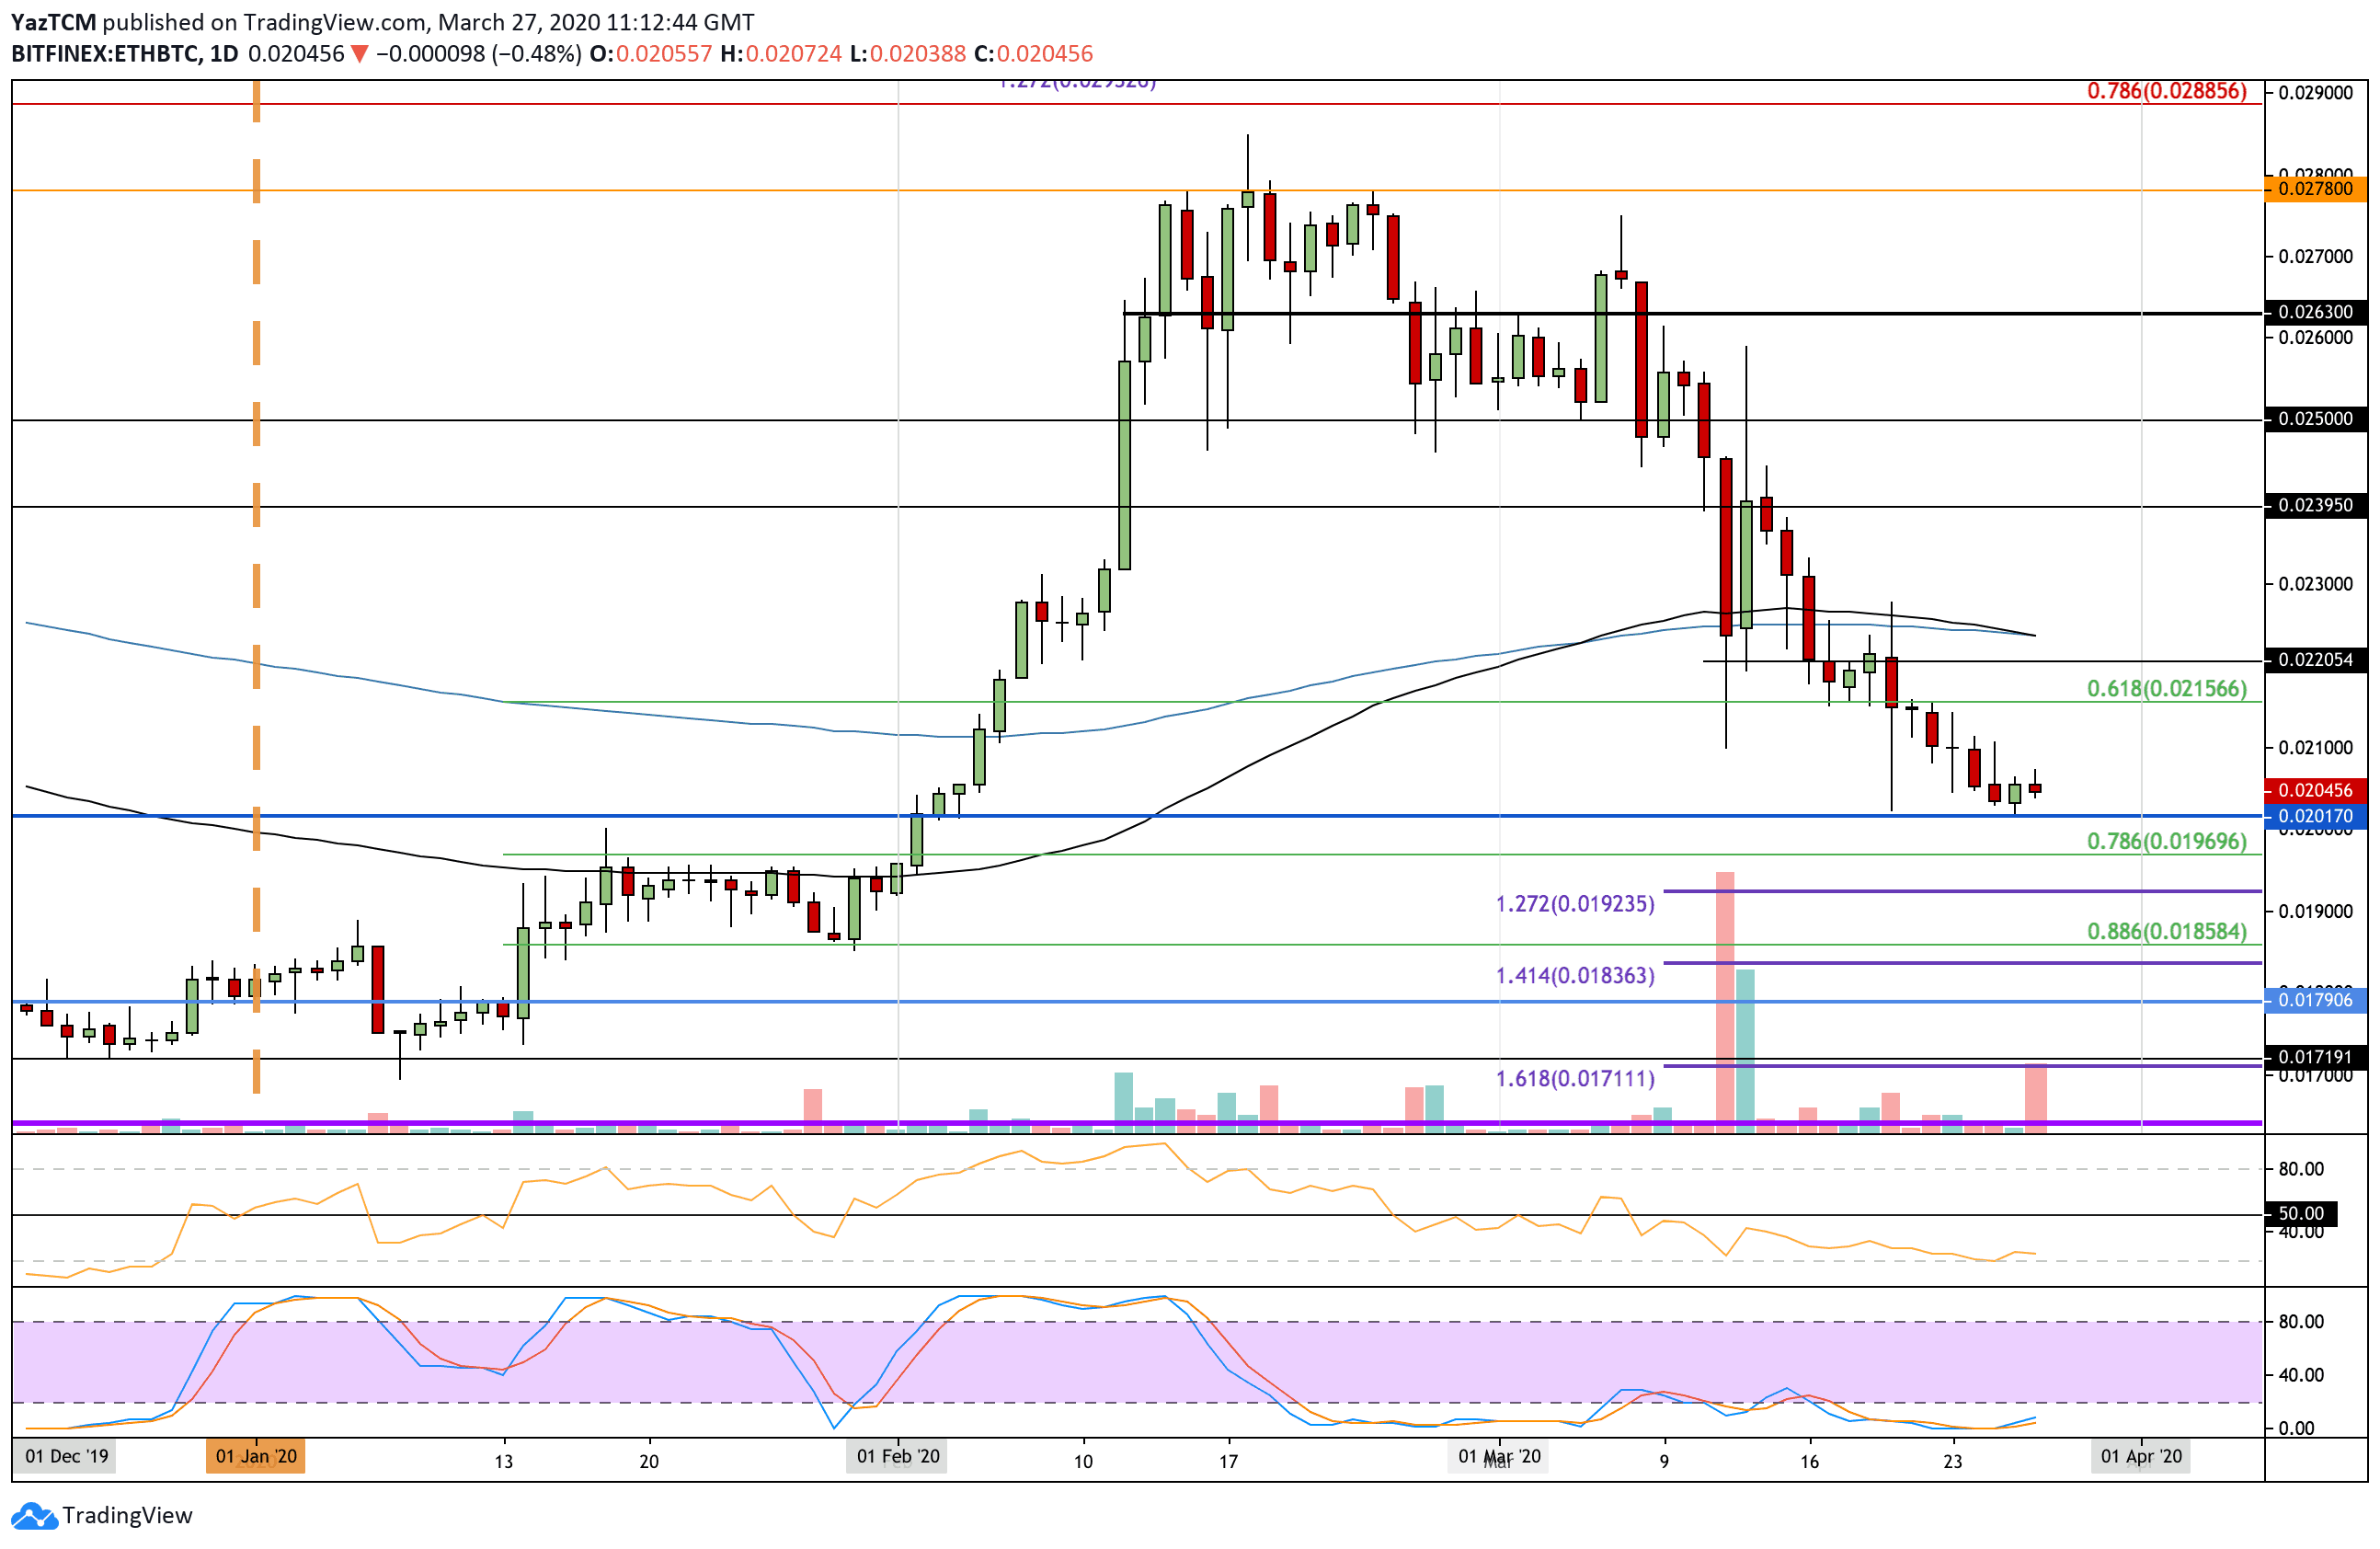
ETH/BTC Short Term Price Prediction
Once 0.0201 BTC is broken, support is expected at 0.02 BTC. Beneath this, support lies at 0.0196 (.786 Fib Retracement), 0.0192 (downside 1.272 Fib Extension), and 0.019 BTC. If 0.019 BTC breaks, added support lies at 0.0185 BTC (.886 Fib Retracement) and 0.0183 BTC (downside 1.414 Fib Extension).
On the other side, the first level of resistance lies at 0.021 BTC. Above this, resistance lies at 0.0215 BTC and 0.022 BTC.
The RSI is near oversold conditions to show complete bearish domination within the market momentum. An increase in the RSI will be a sign that the selling pressure is fading. Additionally, the Stochastic RSI is in extremely oversold conditions, and a bullish crossover signal will be the first positive driving force.