Ethereum increased by 2.5% over the past 24 hours, and it reclaimed the 0 level again.The cryptocurrency previously rebounded from a rising trend line, which allowed it to get over the 0 level this week.Against Bitcoin, ETH managed to rebound from the 0.021 BTC support to reach 0.0213 BTC.Key Support & Resistance LevelsETH/USD:Support: 0, 7, 0.Resistance: 1, 0, 5.ETH/BTC:Support: 0.021 BTC, 0.0208 BTC, 0.02 BTC.Resistance: 0.022 BTC, 0.0225 BTC, 0.023 BTC.ETH/USD: Ethereum Reclaims 0 But Strong Resistance AheadThe 2.5% price rise today has allowed ETH to break back above 0 after dropping beneath it two days ago. Earlier in the week, Ethereum dropped to as low as 5, where it rebounded from the .5 Fib Retracement support. This level was further bolstered by
Topics:
Yaz Sheikh considers the following as important: ETH Analysis, ETHBTC, Ethereum (ETH) Price, ethusd
This could be interesting, too:
CryptoVizArt writes Will Weak Momentum Drive ETH to .5K? (Ethereum Price Analysis)
Jordan Lyanchev writes Bybit Hack Fallout: Arthur Hayes, Samson Mow Push for Ethereum Rollback
Mandy Williams writes Ethereum Key Metrics Point to Persistent Bullish Outlook for ETH: CryptoQuant
CryptoVizArt writes Ethereum Price Analysis: Following a 15% Weekly Crash, What’s Next for ETH?
- Ethereum increased by 2.5% over the past 24 hours, and it reclaimed the $200 level again.
- The cryptocurrency previously rebounded from a rising trend line, which allowed it to get over the $200 level this week.
- Against Bitcoin, ETH managed to rebound from the 0.021 BTC support to reach 0.0213 BTC.
Key Support & Resistance Levels
ETH/USD:
Support: $200, $187, $180.
Resistance: $211, $220, $225.
ETH/BTC:
Support: 0.021 BTC, 0.0208 BTC, 0.02 BTC.
Resistance: 0.022 BTC, 0.0225 BTC, 0.023 BTC.
ETH/USD: Ethereum Reclaims $200 But Strong Resistance Ahead
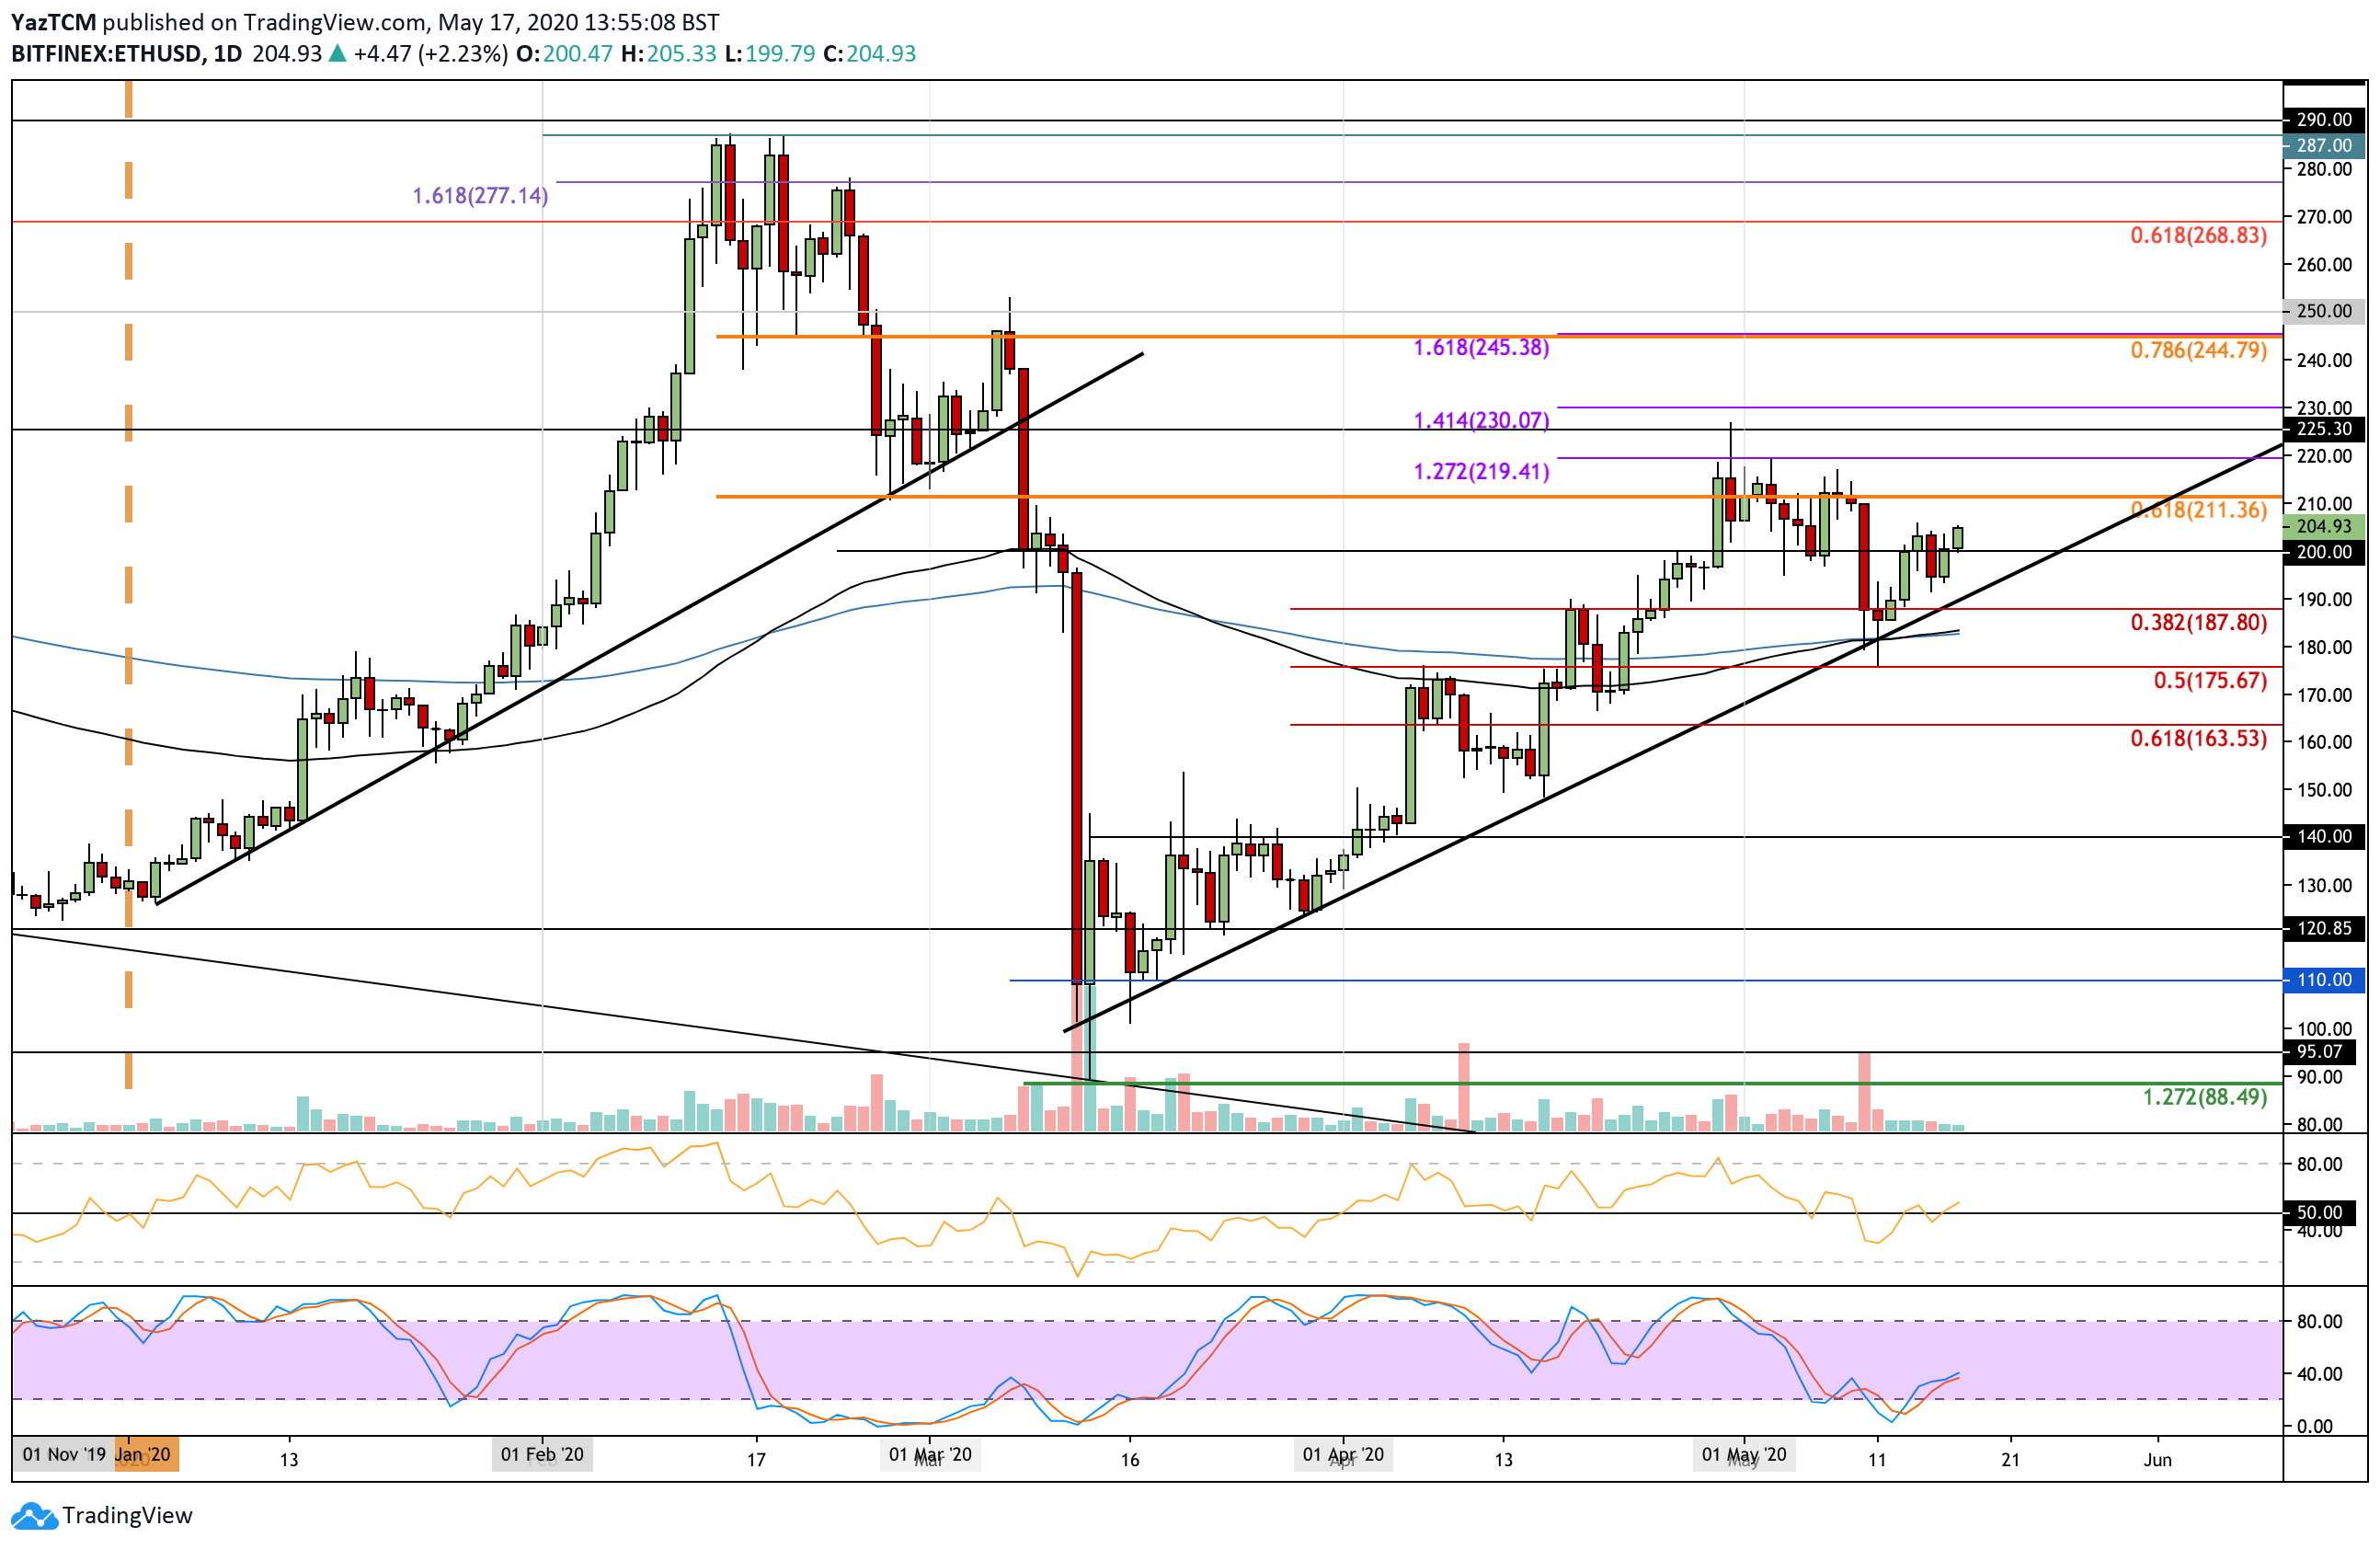
The 2.5% price rise today has allowed ETH to break back above $200 after dropping beneath it two days ago. Earlier in the week, Ethereum dropped to as low as $175, where it rebounded from the .5 Fib Retracement support. This level was further bolstered by the rising trend line that was in play.
Ethereum must now push higher from $205 for the bulls to remain in control of the market. Over the past 4-days, the buyers have struggled to go further beyond $205 as indecision looms within the market.

ETH/USD Short Term Price Prediction
Once the buyers push higher from $200, the first level of strong resistance lies at $211 (bearish .618 Fib Retracement). Above this, resistance is located at $220 (1.272 Fib Extension), $225, and $230 (1.414 Fib Extension).
On the other side, the first level of support beneath $200 lies at the rising trend line. Beneath it, additional support is located at $187 (.382 Fib Retracement), $180 (100-days and 200-days EMAs), and $175 (.5 Fib Retracement).
The RSI managed to climb back to the 50 line to show that the buyers are battling to regain control of the market momentum. It now must push higher above 50 to see ETH rising back toward the May highs.
Furthermore, the Stochastic RSI recently produced a bullish crossover signal in oversold territory that should help the bullish case.
ETH/BTC: ETH Struggles at 0.0213 BTC Resistance
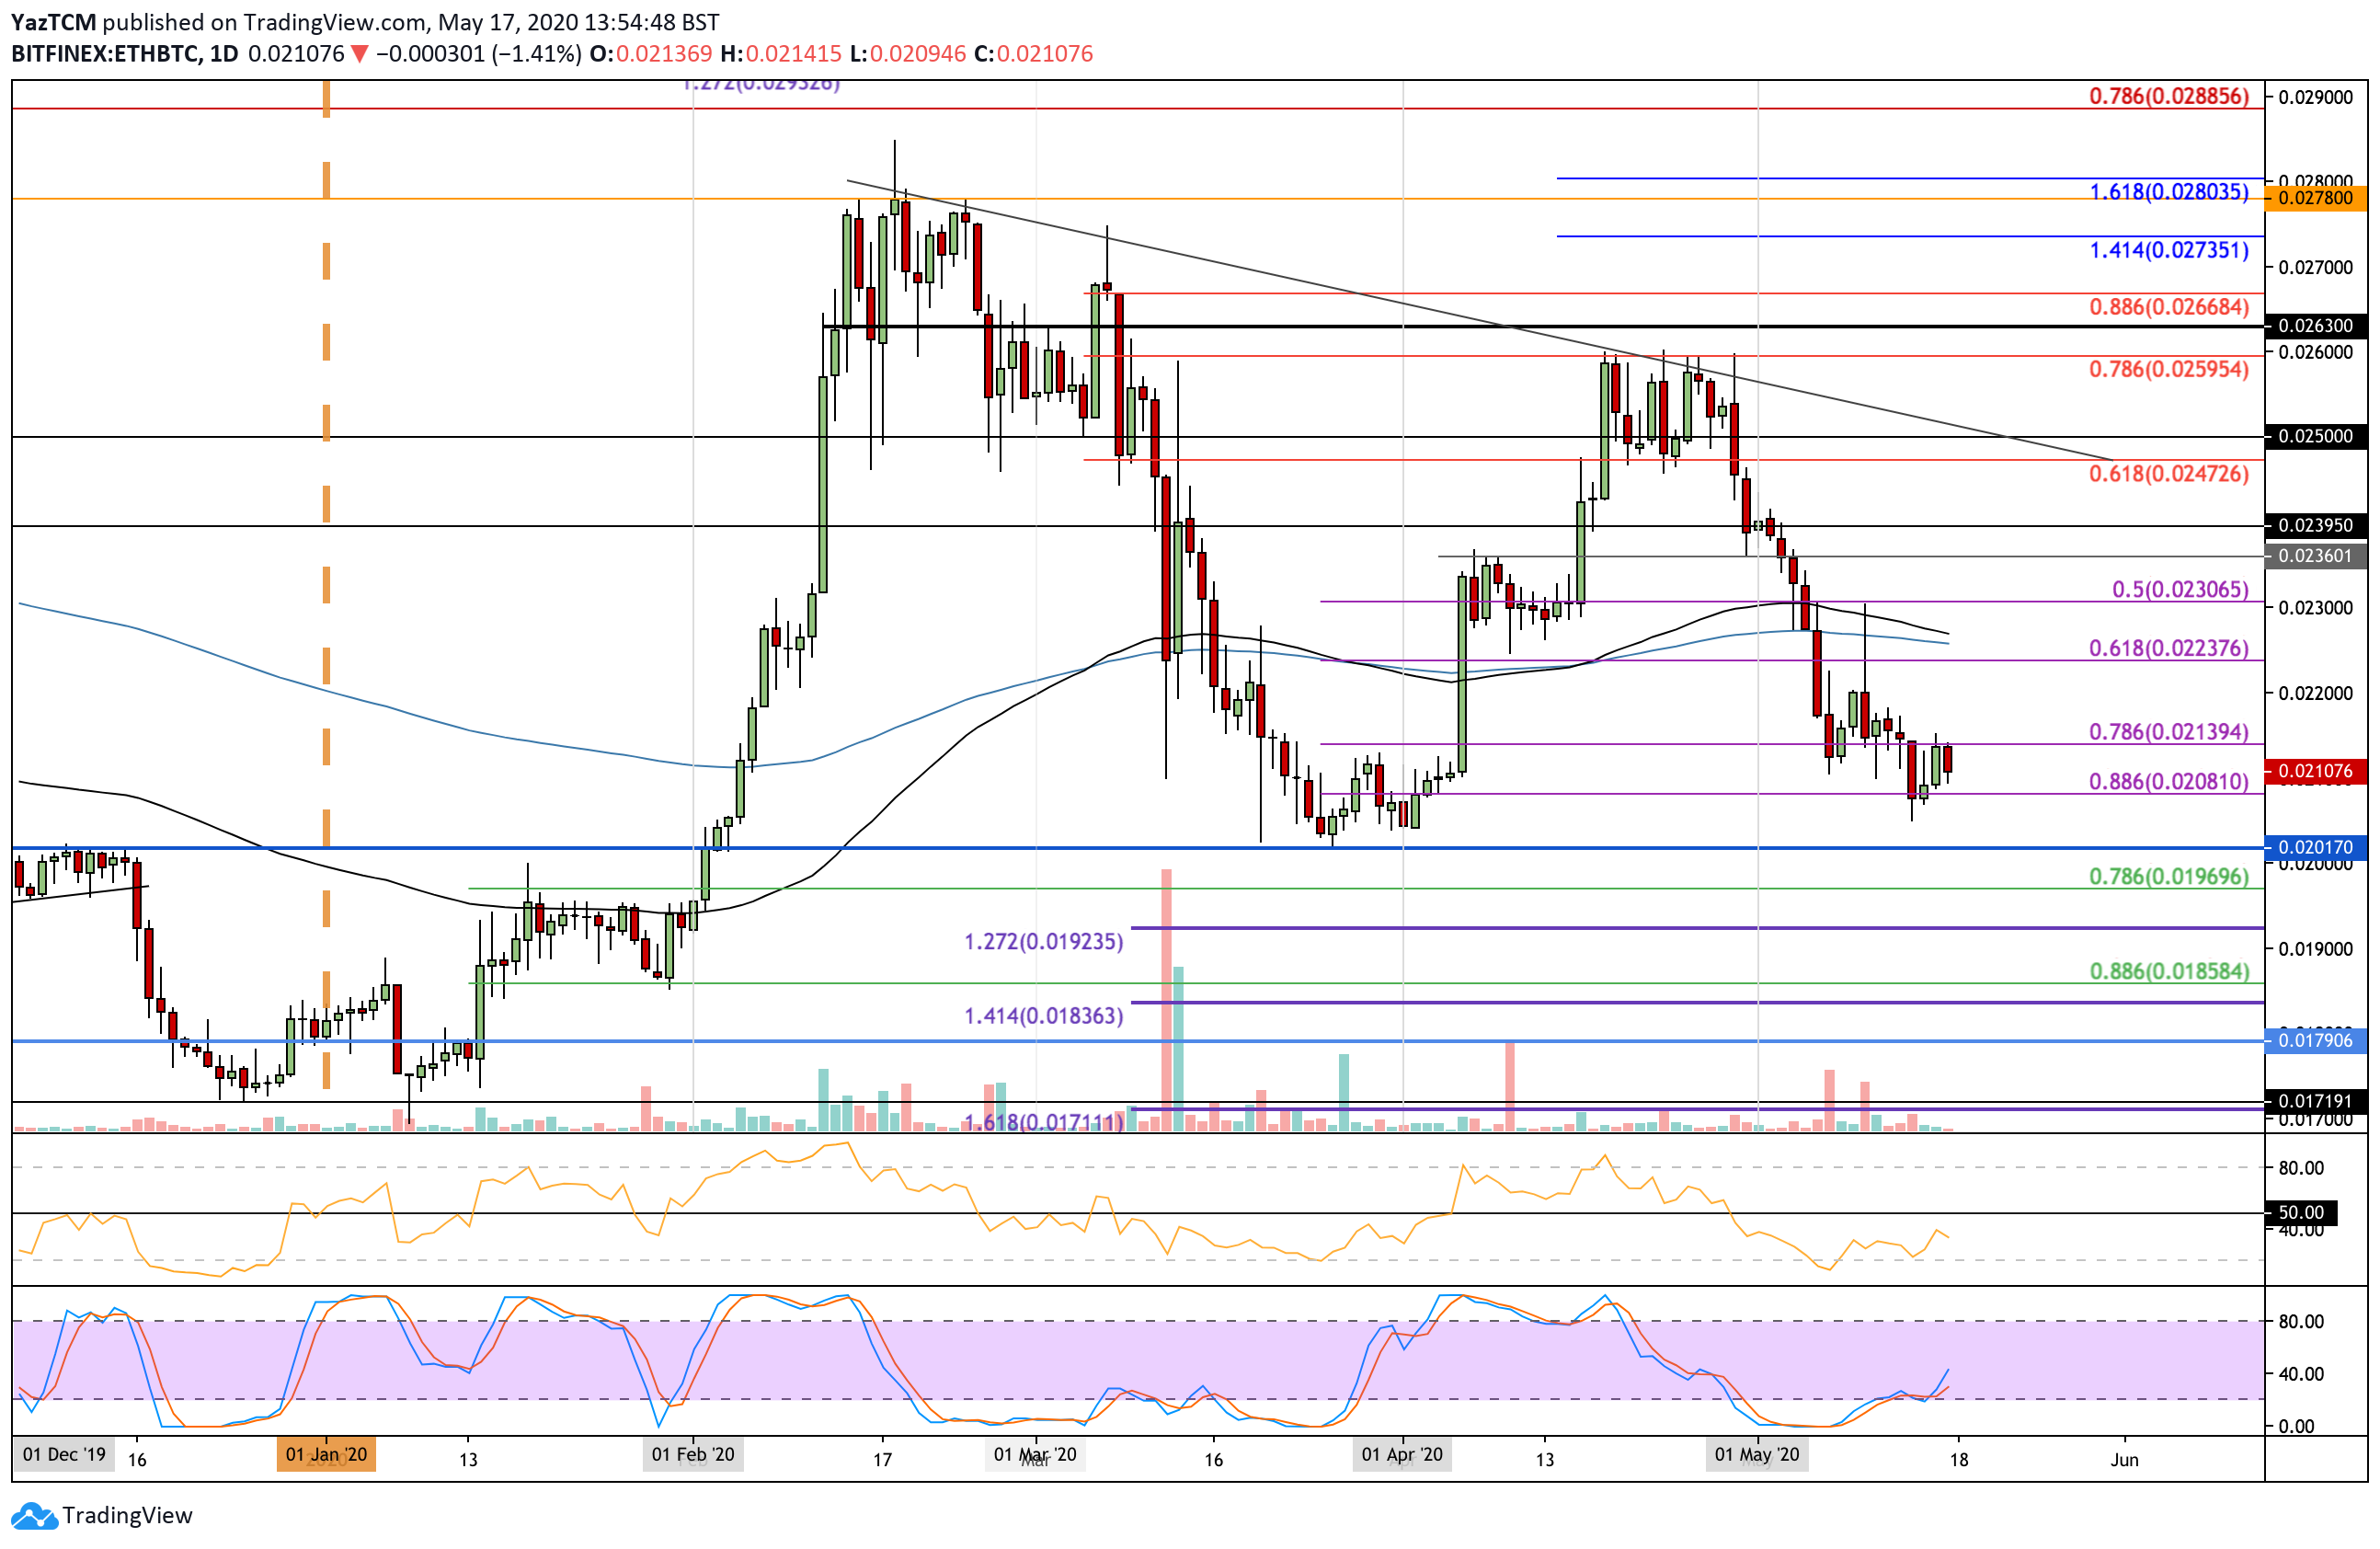
After a depressing bearish run throughout May in which ETH dropped from 0.024 BTC to as low as 0.0205 BTC, the cryptocurrency showed some positive action yesterday as it rebounded from the support at 0.021 BTC to push higher and reach 0.0213 BTC. However, it seems that the bears are still in charge after causing ETH to drop by 1% today as it returns to the 0.021 BTC level.
It still has a long way to recover toward the April highs at 0.026 BTC, but if the coin can climb back above 0.023 BTC, then the bearish presence within the market should evaporate.

ETH/BTC Short Term Price Prediction
If the buyers push higher, the first two levels of resistance lie at 0.0213 BTC and 0.022 BTC. Above this, resistance is located at 0.0225 (200-days EMA) and 0.023 BTC. This is followed by additional resistance at 0.0236 BTC and 0.024 BTC.
On the other side, the first level of support lies at 0.021 BTC. Beneath this, support can be found at 0.0208 BTC, 0.0201 BTC, and 0.02 BTC.
The RSI is still beneath the 50 line, which shows the sellers still control the market momentum. However, it is rising, which is a sign that the previous bearish momentum is fading. It must break above 50 before the buyers can gain control of the market momentum.
