XTZ is facing resistance at .7, and it could resume its uptrend if this price level breaks up.The price is currently sitting at the 27000 SAT support area after forming a lower high around 28000 SAT against Bitcoin.Tezos could start decreasing if the price drops below the current holding support.XTZ/USD: Tezos Facing Crucial Resistance Line Key Resistance Levels: .7, .89, .07Key Support Levels: .375, .06, .88XTZ/USD. Source: TradingViewSince our previous analysis, Tezos has continued to stay above the .3 level. However, the bullish action has been quite moderate so far. The price is changing hands at around .66 against the US Dollar after increasing by almost 5% over the past hours.The 10th largest cryptocurrency is currently facing the .7 resistance level, and, at the
Topics:
Michael Fasogbon considers the following as important: Price Analysis, Tezos (XTZ) Price, XTZBTC, XTZUSD
This could be interesting, too:
CryptoVizArt writes ETH’s Path to K Involves Maintaining This Critical Support (Ethereum Price Analysis)
Duo Nine writes Crypto Price Analysis June-29: ETH, XRP, ADA, DOGE, and DOT
Duo Nine writes Crypto Price Analysis June-15: ETH, XRP, ADA, DOGE, and DOT
Duo Nine writes Why is the Shiba Inu (SHIB) Price Down Today?
- XTZ is facing resistance at $2.7, and it could resume its uptrend if this price level breaks up.
- The price is currently sitting at the 27000 SAT support area after forming a lower high around 28000 SAT against Bitcoin.
- Tezos could start decreasing if the price drops below the current holding support.
XTZ/USD: Tezos Facing Crucial Resistance Line
Key Resistance Levels: $2.7, $2.89, $3.07
Key Support Levels: $2.375, $2.06, $1.88
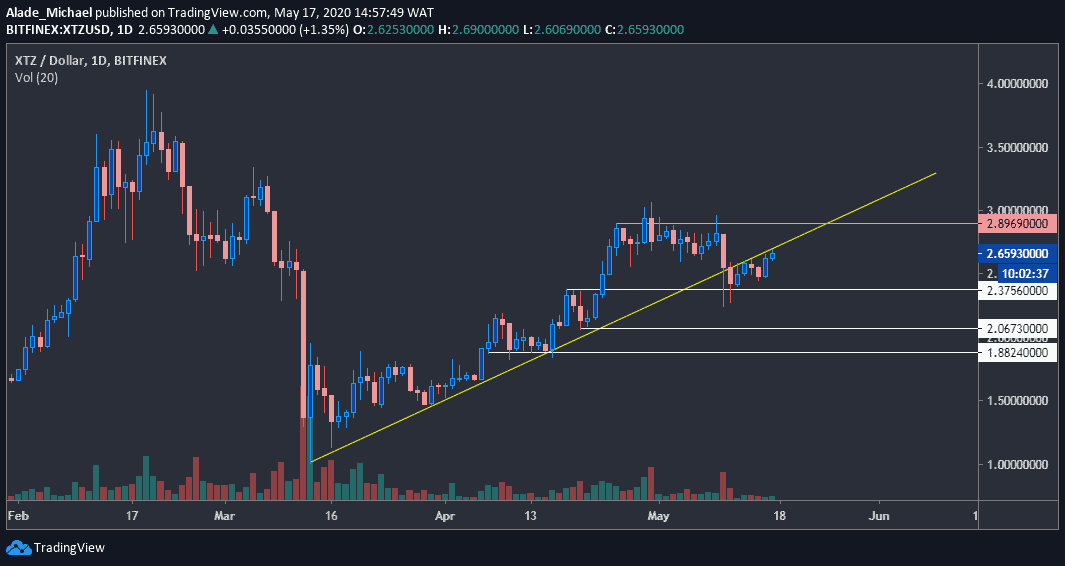
Since our previous analysis, Tezos has continued to stay above the $2.3 level. However, the bullish action has been quite moderate so far. The price is changing hands at around $2.66 against the US Dollar after increasing by almost 5% over the past hours.
The 10th largest cryptocurrency is currently facing the $2.7 resistance level, and, at the same time, testing the yellow diagonal support (now resistance) line was broken on May 11. A nice bullish action should be expected once the price climbs back above this yellow line.
The alternative move here is that Tezos is likely to see another downward correction to $2 if this yellow resistance line continues to suppress bullish pressure.
Tezos Price Analysis
Even if the bulls manage to conquer the immediate $2.7 resistance level, they would need to overcome the $2.89 and $3.07 resistance levels before Tezos starts to make a big move towards the current yearly high around $4.
Looking at the current 4-hours chart, buying volume is quite low. A weekly close above this trend line would signal a new increase for the coming week.
As said above, a failure to break the $2.7 resistance today might lead to a second correction for Tezos, and $2.375 support may be tested once more. The selling pressure may drive the price to $2.06, and $1.88 supports (marked white) if the initial support fails to hold.
XTZ/BTC: Tezos Testing 27000 SAT Support Level
Key Resistance Levels: 29100SAT, 30460 SAT, 32080 SAT
Key Support Levels: 26000 SAT, 25000 SAT, 24000 SAT
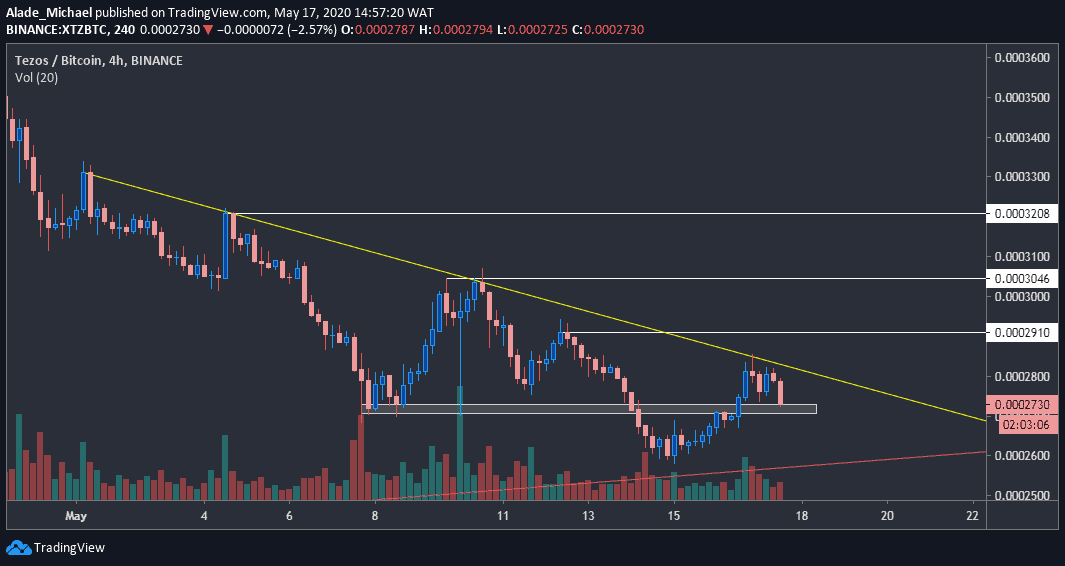
Tezos just created a new lower high around 28000 SAT level against Bitcoin after breaking below 27777 SAT support level this week.
The price is likely to revisit the weekly rebound level of 26000 SAT if the above level is breached. A steep break below the weekly low could cause a devastating price drop for the XTZ/BTC pair.
But looking at the red trend line, which is serving as support for this pair since September 2019, a bullish reversal could come into play if it continues to hold. Considering the recent weekly bounce at around 26000 SAT level, Tezos may switch to an uptrend once it breaks up the yellow regression line forming since May 1.
Tezos Price Analysis
Tezos is now testing support at the 27000 SAT level. The price may roll back to 26000 SAT, as mentioned above. If this line breaks, together with the 8-month trend line, a heavy sell action could be expected to 25000 SAT, 24000 SAT, and even lower.
If Tezos can reclaim the previous lower high at 28000 SAT, which is slightly above the yellow regression line, a steady buying pressure could be expected toward 29100 SAT resistance, followed by 30460 SAT and 32080 SAT.