Ethereum dropped by a steep 13% over the past 24 hours as it falls beneath 0.The cryptocurrency failed to overcome strong resistance at 5, which caused it to roll over and fall.Against Bitcoin, ETH is struggling as it posted a fresh low for March at around 0.0203 BTC.Key Support & Resistance LevelsETH/USD:Support: 0, 0, 5.Resistance:5, 0, 5.ETH/BTC:Support: 0.021 BTC, 0.0204 BTC, 0.02 BTC.Resistance: 0.0215 BTC, 0.022 BTC, 0.0225 BTC.ETH/USD: ETH Drops Back Into Previous Trading RangeEthereum looked like it was recovering yesterday as it climbed as high as 0 throughout the day. However, it failed to overcome this resistance and fell.More specifically, the coin was unable to close above resistance at 5, provided by a bearish .236 Fib Retracement level, which
Topics:
Yaz Sheikh considers the following as important: ETH Analysis, Ethereum (ETH) Price
This could be interesting, too:
Mandy Williams writes Ethereum Derivatives Metrics Signal Modest Downside Tail Risk Ahead: Nansen
CryptoVizArt writes Will Weak Momentum Drive ETH to .5K? (Ethereum Price Analysis)
Mandy Williams writes Ethereum Key Metrics Point to Persistent Bullish Outlook for ETH: CryptoQuant
CryptoVizArt writes Ethereum Price Analysis: Following a 15% Weekly Crash, What’s Next for ETH?
- Ethereum dropped by a steep 13% over the past 24 hours as it falls beneath $130.
- The cryptocurrency failed to overcome strong resistance at $135, which caused it to roll over and fall.
- Against Bitcoin, ETH is struggling as it posted a fresh low for March at around 0.0203 BTC.
Key Support & Resistance Levels
ETH/USD:
Support: $120, $110, $105.
Resistance:$135, $150, $165.
ETH/BTC:
Support: 0.021 BTC, 0.0204 BTC, 0.02 BTC.
Resistance: 0.0215 BTC, 0.022 BTC, 0.0225 BTC.
ETH/USD: ETH Drops Back Into Previous Trading Range
Ethereum looked like it was recovering yesterday as it climbed as high as $150 throughout the day. However, it failed to overcome this resistance and fell.
More specifically, the coin was unable to close above resistance at $135, provided by a bearish .236 Fib Retracement level, which caused it to drop beneath $130.
This latest price drop puts Ethereum back into last week’s trading range as it bounces between $135 and $110.
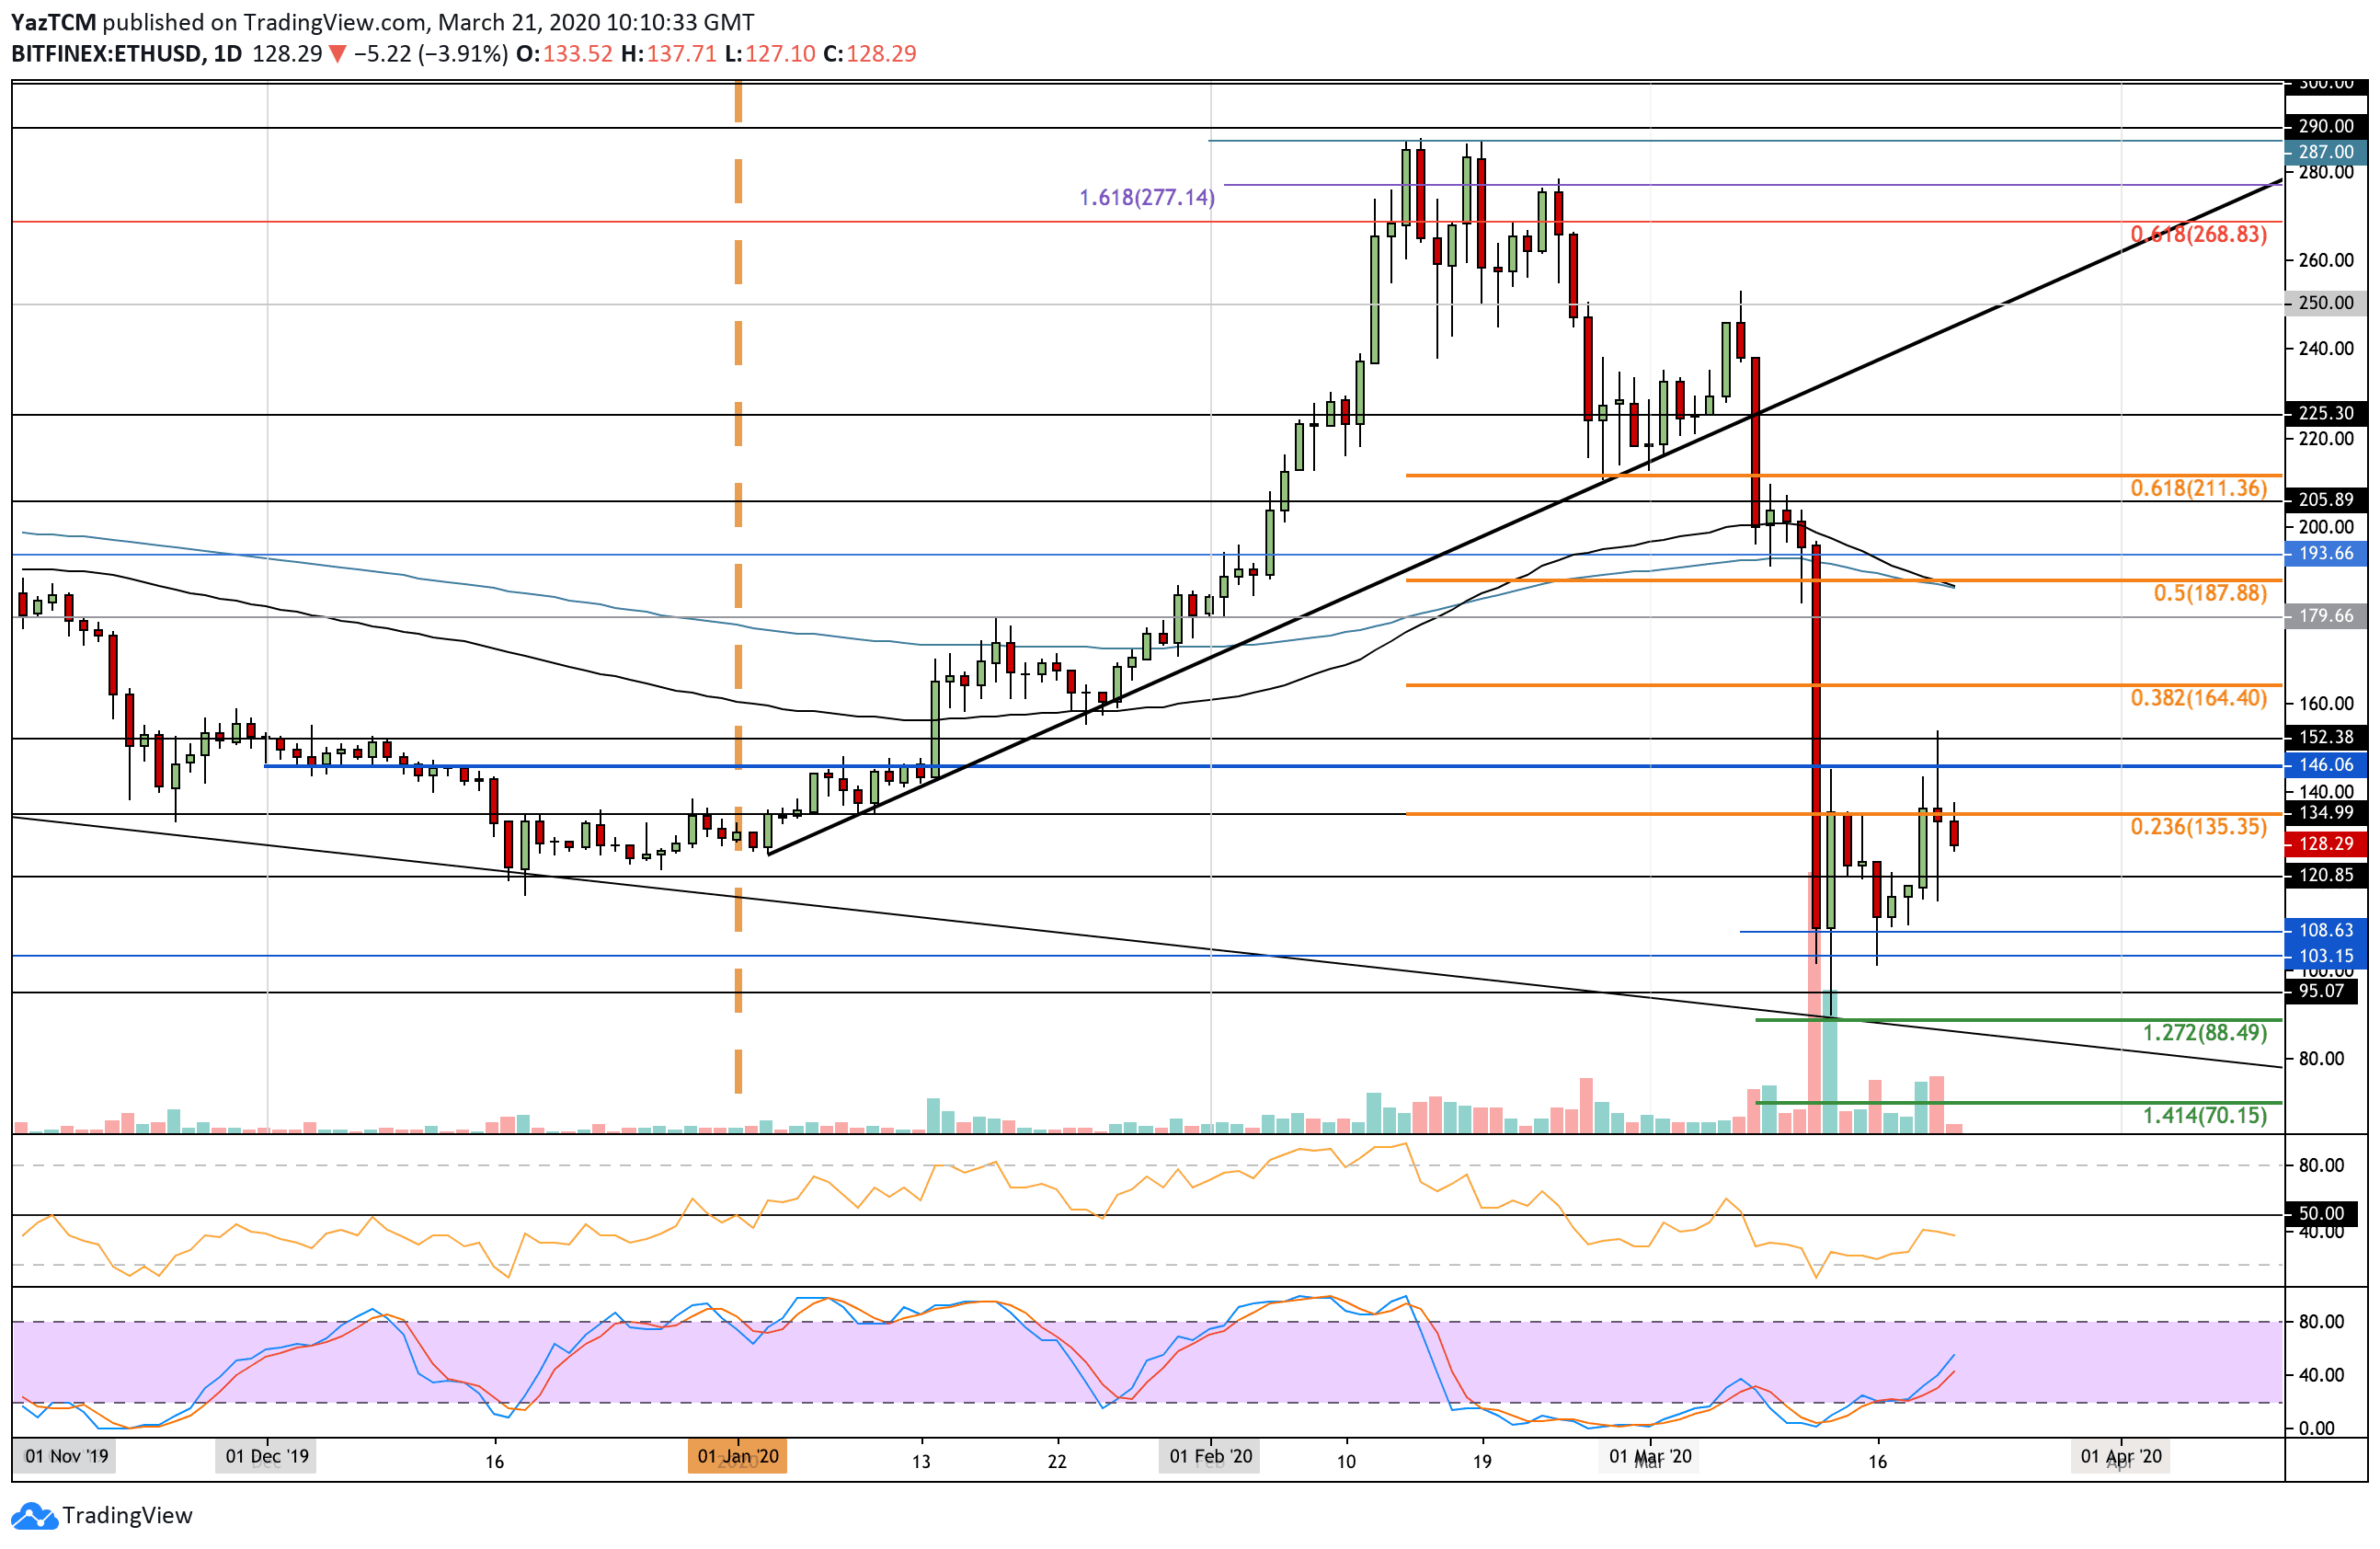
ETH/USD Short Term Price Prediction
From below, the first level of strong support lies at $120. Beneath this, support lies at $110, $105, and $100. If it breaks $100, additional support is found at $95 and $88.50.
On the other side, resistance lies at $135, $150, and $165.
The RSI was rising but failed to get anywhere near the 50 level to show that the sellers still dominate the market momentum. The Stochastic RSI did produce a bullish crossover signal that allowed ETH to break above the previous range. However, it failed to follow through.
ETH/BTC: ETH Posts Fresh March Low Against Bitcoin
Against Bitcoin, Ethereum is also struggling after breaking beneath the .618 Fib Retracement at 0.0215 BTC today. The bulls are battling to climb above, but if the market closes beneath this level, then ETH is likely to head lower to 0.02 BTC.
Yesterday’s trading session posted a fresh low for ETH against BTC at a price of 0.0203 BTC, which helps to confirm the bearish sentiment.
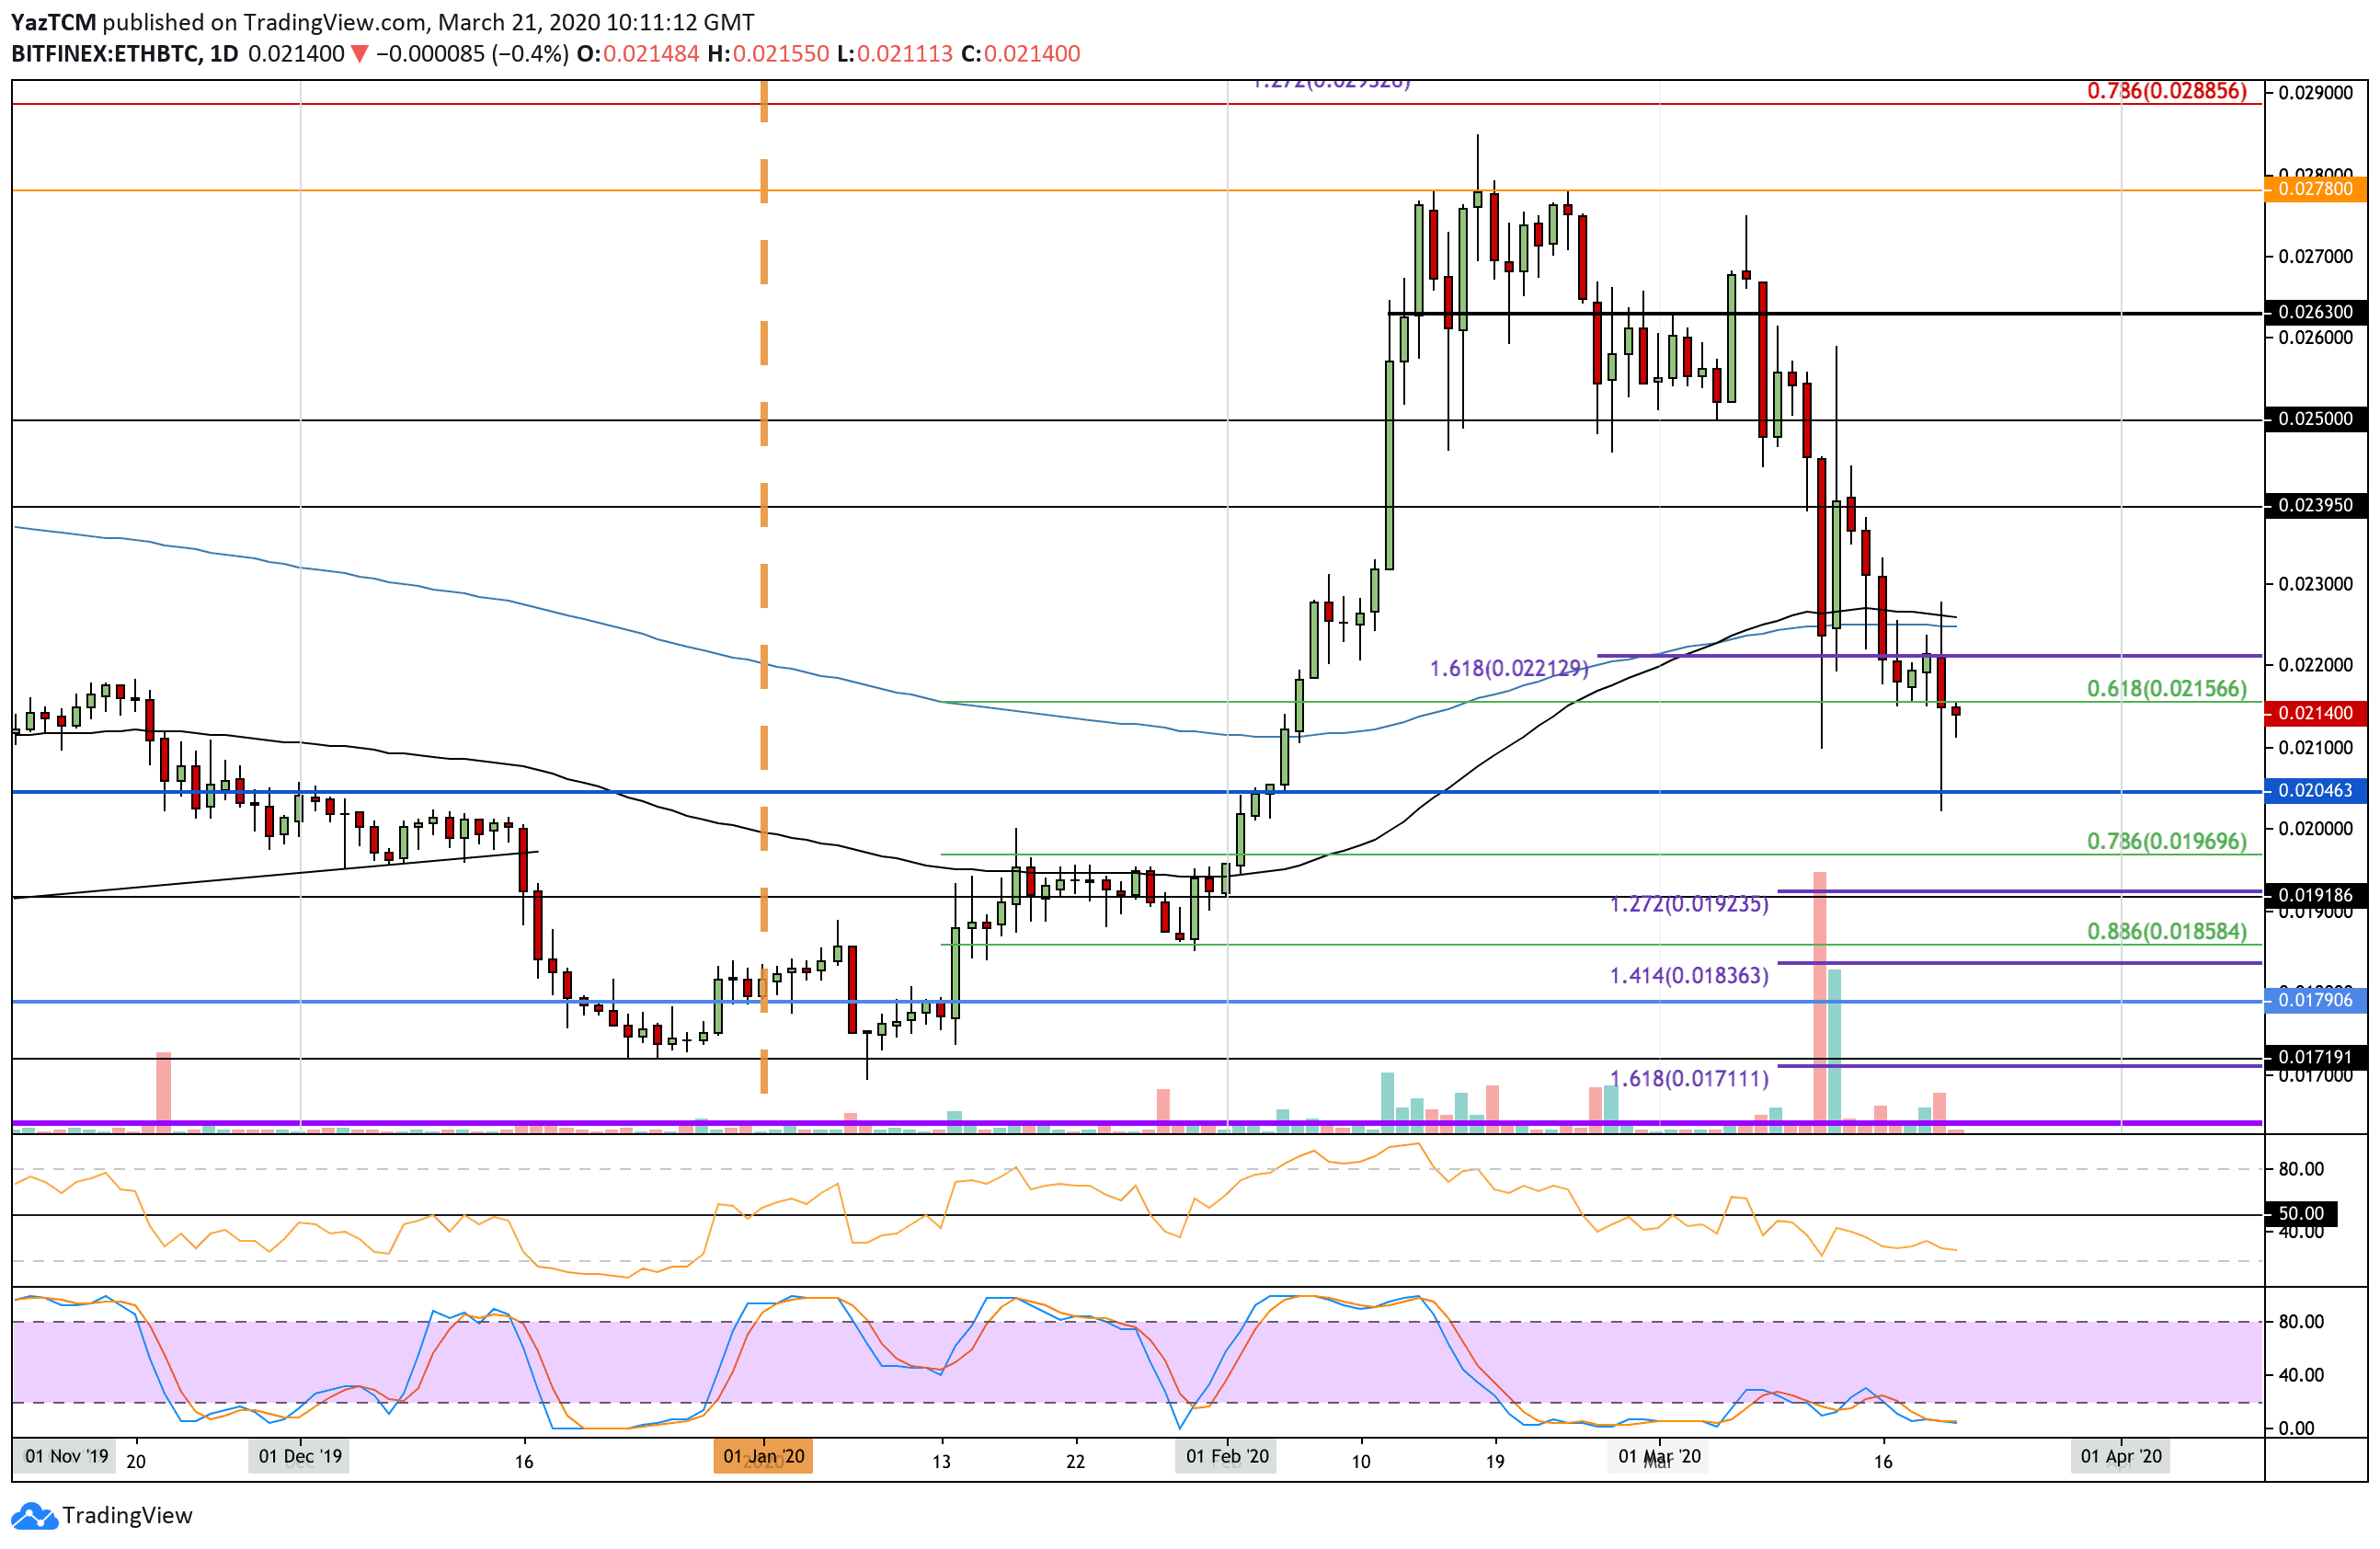
ETH-BTC Short Term Price Prediction
From below, the first level of support lies at 0.021 BTC. Beneath this, support lies at 0.0204 BTC and 0.02 BTC. Underneath 0.02 BTC, support lies at 0.0196 BTC (.786 Fib Retracement) and 0.0192 BTC.
From above, resistance lies at 0.0215 BTC and 0.022 BTC. Above this, strong resistance is expected at 0.0225 BTC, where lies the 100-days and 200-days EMA levels.
The RSI is heading lower as the sellers continue to remain in charge of the market momentum. At the same time, the Stochastic RSI is in extremely oversold conditions, and a bullish crossover signal would be the first sign that the selling is fading.