Etheruem has seen a sharp 8% price fall over the past week, bringing the price for the coin down to 0.The cryptocurrency was unable to break resistance at 5, causing it to roll over and drop.ETH also declined against BTC after failing to overcome resistance at 0.0278 BTC.Key Support & Resistance LevelsETH/USD:Support: 5, 0, 5.Resistance: 0, 5, 0.ETH/BTC:Support: 0.026 BTC, 0.0256 BTC, 0.025 BTC.Resistance: 0.0278 BTC, 0.0288 BTC, 0.030 BTC .ETH/USD: Ethereum Double-Tops At 2020 HighSince our last analysis, ETH was unable to overcome the strong 5 resistance, which caused it to roll over and drop into support at 5, provided by the short term .236 Fib Retracement.This second downturn from the 2020 high creates a double-top scenario in which we should expect the
Topics:
Yaz Sheikh considers the following as important: ETH Analysis, Ethereum (ETH) Price
This could be interesting, too:
Mandy Williams writes Ethereum Derivatives Metrics Signal Modest Downside Tail Risk Ahead: Nansen
CryptoVizArt writes Will Weak Momentum Drive ETH to .5K? (Ethereum Price Analysis)
Mandy Williams writes Ethereum Key Metrics Point to Persistent Bullish Outlook for ETH: CryptoQuant
CryptoVizArt writes Ethereum Price Analysis: Following a 15% Weekly Crash, What’s Next for ETH?
- Etheruem has seen a sharp 8% price fall over the past week, bringing the price for the coin down to $260.
- The cryptocurrency was unable to break resistance at $285, causing it to roll over and drop.
- ETH also declined against BTC after failing to overcome resistance at 0.0278 BTC.
Key Support & Resistance Levels
ETH/USD:
Support: $255, $250, $235.
Resistance: $270, $285, $290.
ETH/BTC:
Support: 0.026 BTC, 0.0256 BTC, 0.025 BTC.
Resistance: 0.0278 BTC, 0.0288 BTC, 0.030 BTC .
ETH/USD: Ethereum Double-Tops At 2020 High
Since our last analysis, ETH was unable to overcome the strong $285 resistance, which caused it to roll over and drop into support at $255, provided by the short term .236 Fib Retracement.
This second downturn from the 2020 high creates a double-top scenario in which we should expect the market to continue further lower beneath the $250 support.
Nevertheless, it’s essential to wait for the market to close beneath $250 before considering that the bull run may be invalidated. A close beneath $220 would certainly confirm this.
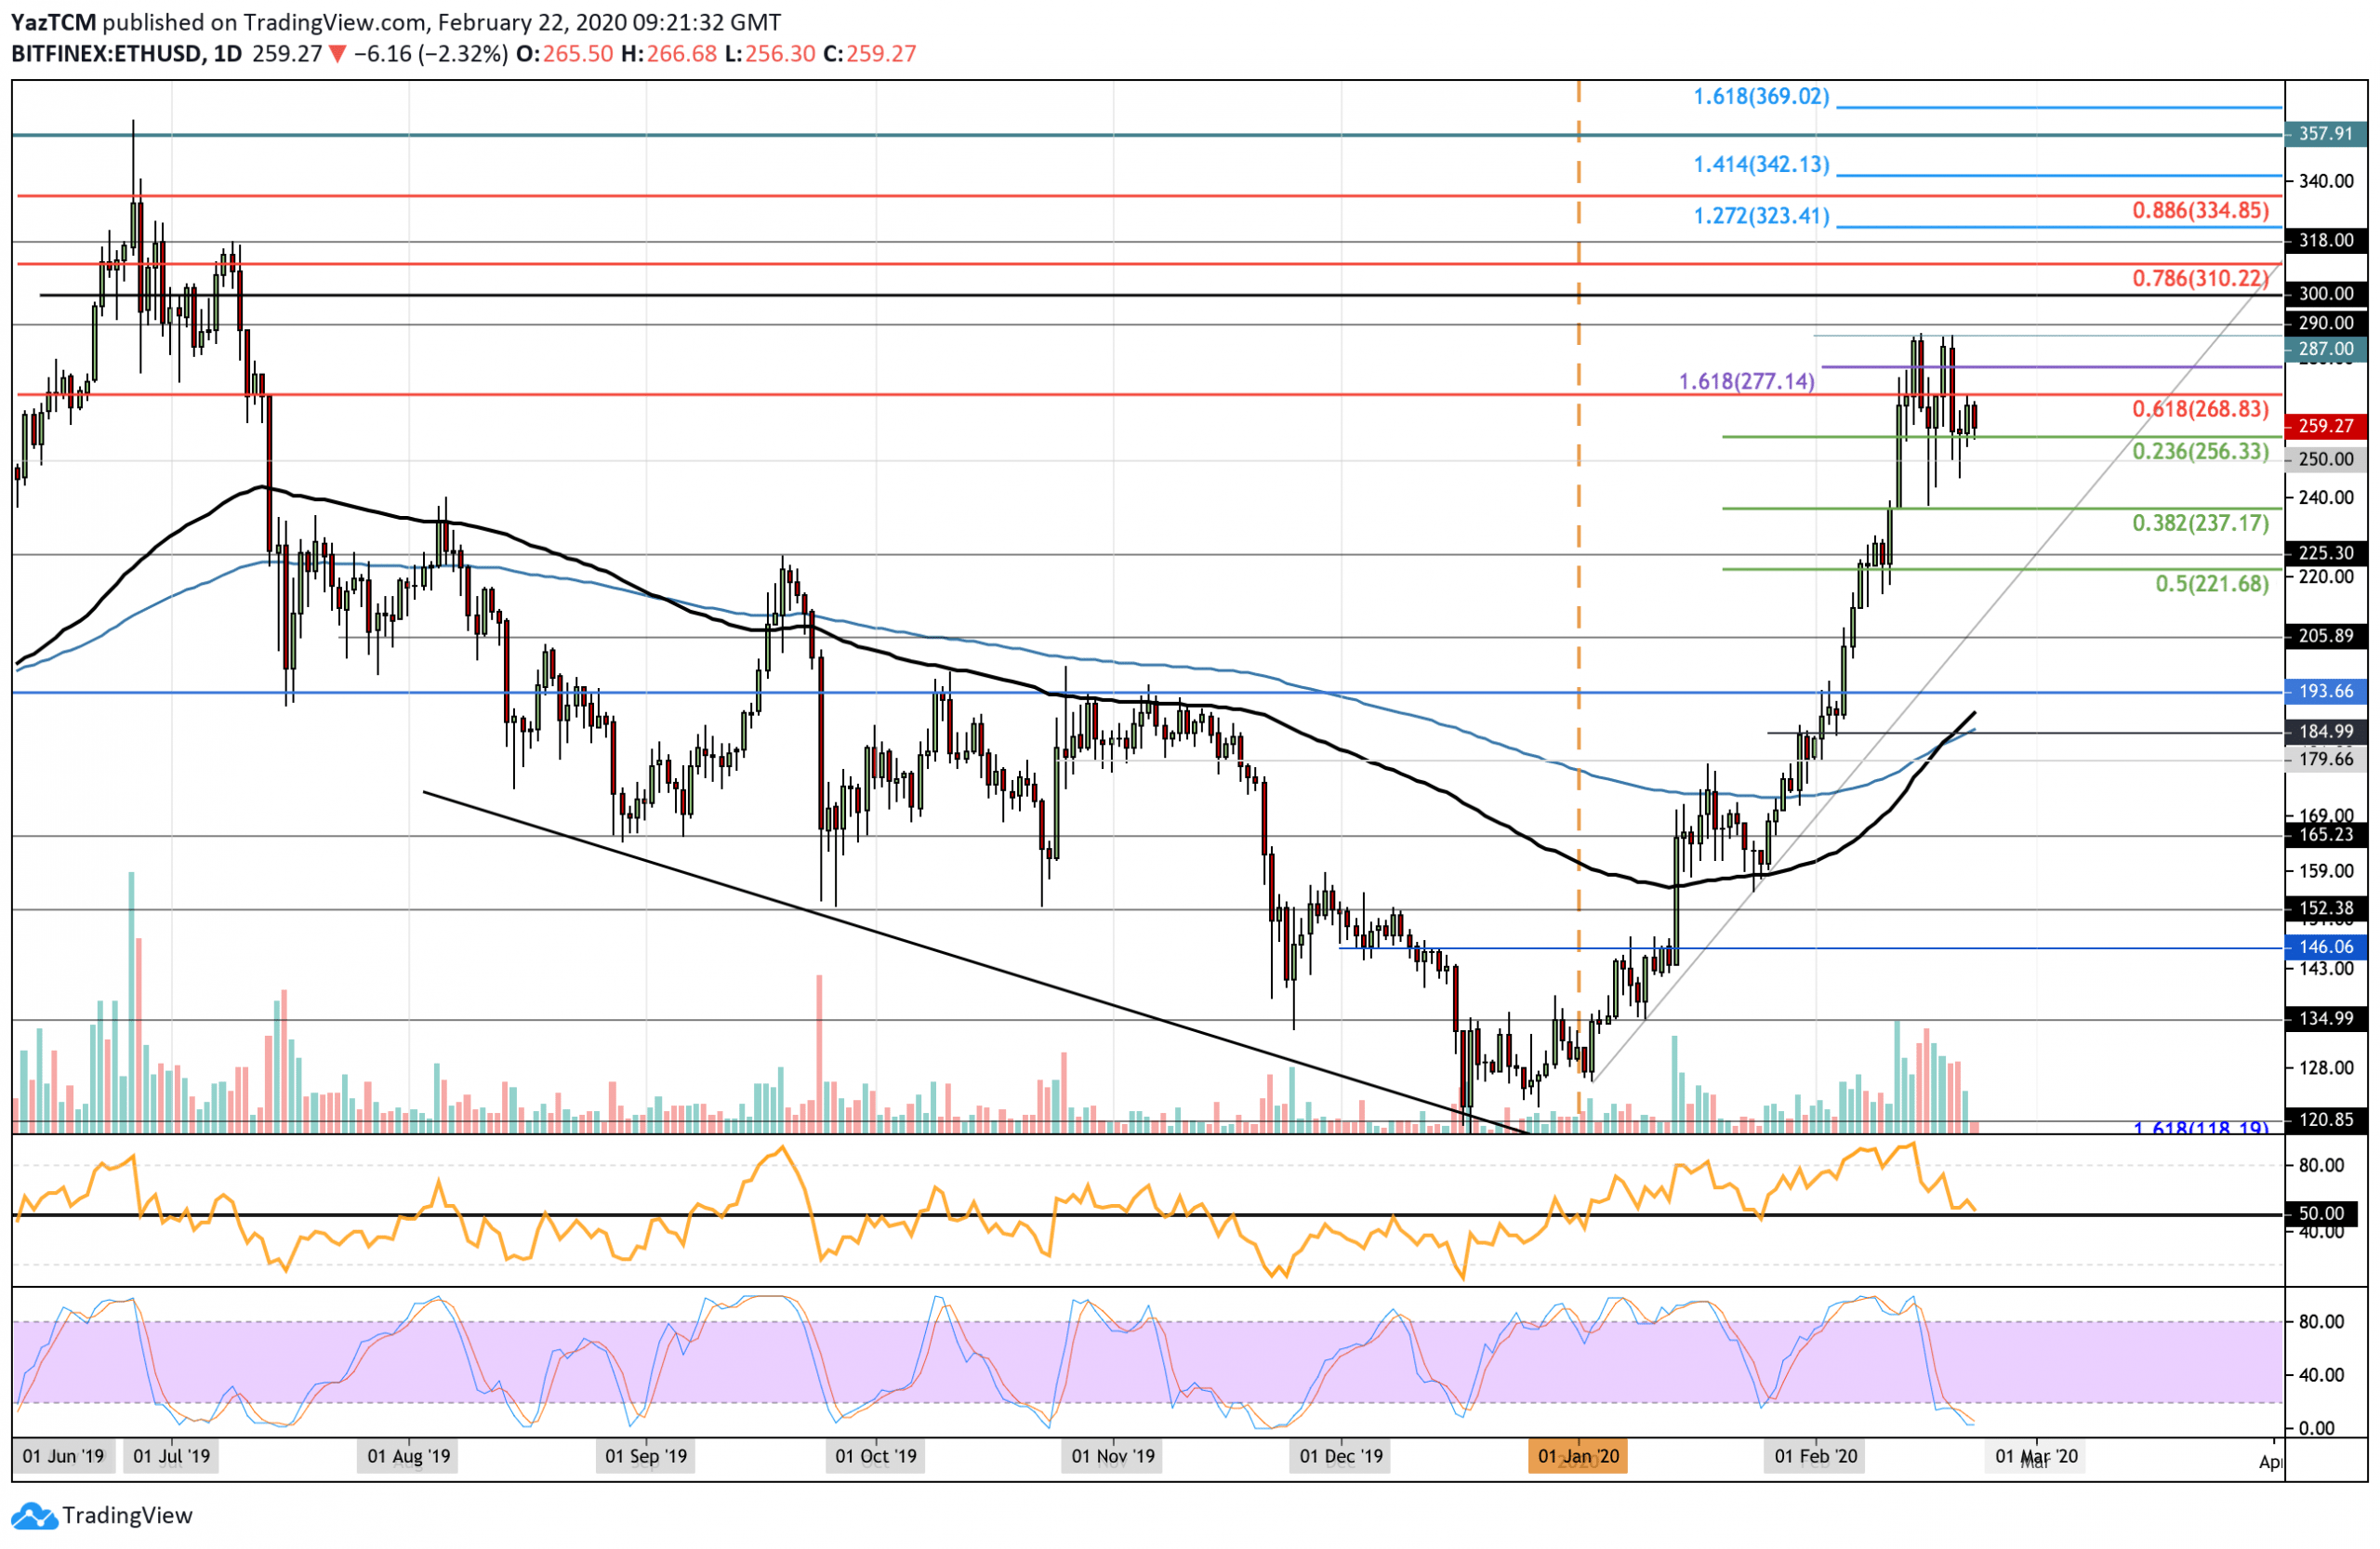
Ethereum Short Term Price Prediction
If the sellers break the current level of $255, the next support lies at $250. Beneath this, additional support is located at $235 (.382 Fib Retracement), $225, and $220 (.5 Fib Retracement).
On the other side, if the buyers rebound at $255, resistance lies at $270 (bearish .618 Fib Retracement). Above this, resistance is expected at $285, $290, and $300.
The RSI is approaching the 50 level but has not yet broken beneath, which shows the bears have not yet taken control of the market momentum. Luckily, the Stochastic RSI is in extremely oversold conditions and is primed for a bullish crossover signal, which will help the bullish favor.
ETH/BTC: ETH Fails To Break Above 0.0278 BTC
Against Bitcoin, ETH also failed to break above resistance at 0.0278 BTC and continued to roll over after reaching it.
It went on to find support at 0.026 BTC as it currently trades at 00268 BTC. ETH is looking stronger against Bitcoin. However, it does look like the bullish momentum is showing signs of fading.
It remains bullish and would need to break beneath 0.024 BTC before being in danger of turning neutral.
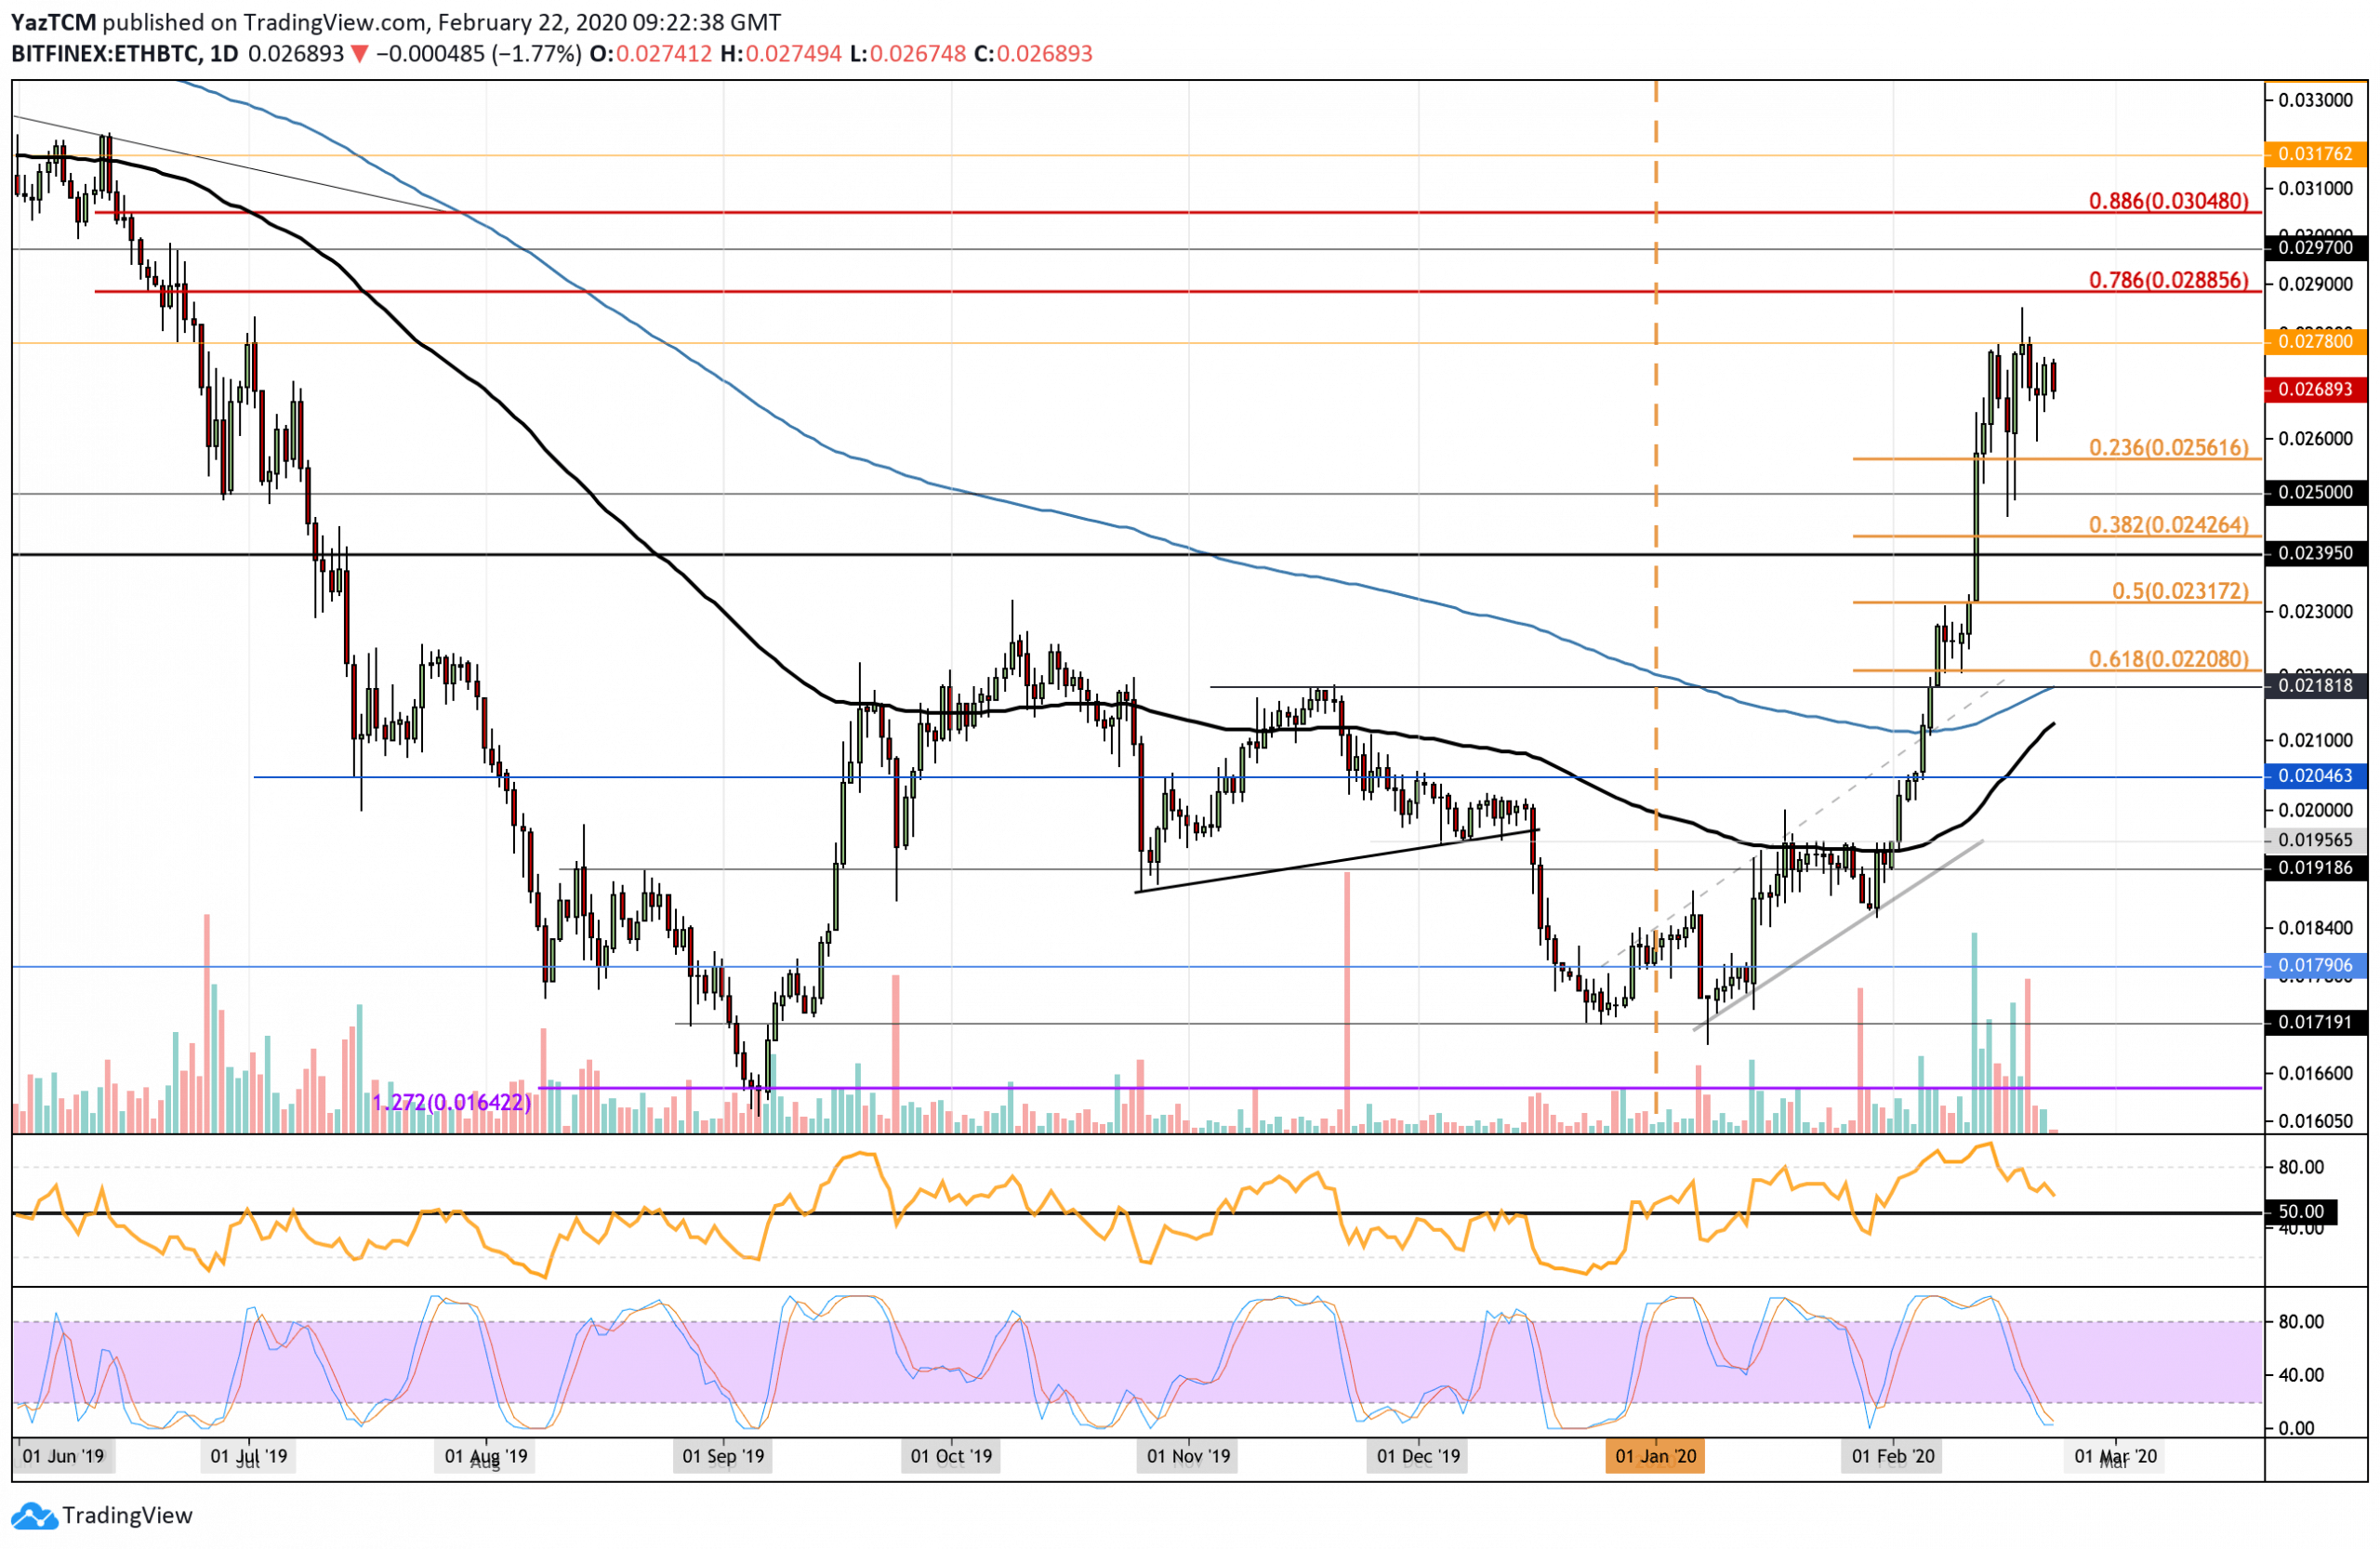
Ethereum Short Term Price Prediction
If the sellers push beneath 0.026 BTC, support lies at 0.0256 BTC (.236 Fib Retracement). This is followed by support at 0.025 BTC and 0.0242 BTC (.382 Fib Retracement).
Alternatively, if the buyers break 0.0278 BTC, resistance lies at 0.0288 BTC (bearish .786 Fib Retracement), 0.0298 BTC, and 0.0304 BTC (bearish .886 Fib Retracement).
The RSI is heading lower but not quite near the 50 level, which shows that the bullish momentum is fading at a slower rate than within ETH/USD. Additionally, the Stochastic RSI is ready for a bullish crossover signal that should send ETH/BTC higher.