Ethereum saw a slight price drop today as the coin falls from 0 into the 3 level.Luckily, Ethereum found support at the rising trend line as the buyers battle to remain above.Against Bitcoin, Ethereum is re-testing the strong resistance at 0.0253 BTC.Key Support & Resistance LevelsETH/USD:Support: 5, 5, 0.Resistance: 0, 5, 5.ETH/BTC:Support: 0.025 BTC, 0.0243 BTC, 0.0239 BTC.Resistance: 0.026 BTC, 0.0263 BTC, 0.0266 BTC.ETH/USD: Ethereum Returns To Trend Line SupportEthereum bounced higher from the rising trend line support at the start of the week. This allowed it to push toward the 0 level during the past few days. Unfortunately, ETH was unable to overcome the 0 resistance, which caused it to roll over and drop again.Ethereum fell into the support at the
Topics:
Yaz Sheikh considers the following as important: ETH Analysis, ETHBTC, Ethereum (ETH) Price, ethusd
This could be interesting, too:
Mandy Williams writes Ethereum Derivatives Metrics Signal Modest Downside Tail Risk Ahead: Nansen
Jordan Lyanchev writes Weekly Bitcoin, Ethereum ETF Recap: Light at the End of the Tunnel for BTC
CryptoVizArt writes Will Weak Momentum Drive ETH to .5K? (Ethereum Price Analysis)
Jordan Lyanchev writes Bybit Hack Fallout: Arthur Hayes, Samson Mow Push for Ethereum Rollback
- Ethereum saw a slight price drop today as the coin falls from $250 into the $233 level.
- Luckily, Ethereum found support at the rising trend line as the buyers battle to remain above.
- Against Bitcoin, Ethereum is re-testing the strong resistance at 0.0253 BTC.
Key Support & Resistance Levels
ETH/USD:
Support: $225, $215, $210.
Resistance: $250, $265, $275.
ETH/BTC:
Support: 0.025 BTC, 0.0243 BTC, 0.0239 BTC.
Resistance: 0.026 BTC, 0.0263 BTC, 0.0266 BTC.
ETH/USD: Ethereum Returns To Trend Line Support
Ethereum bounced higher from the rising trend line support at the start of the week. This allowed it to push toward the $250 level during the past few days. Unfortunately, ETH was unable to overcome the $250 resistance, which caused it to roll over and drop again.
Ethereum fell into the support at the rising trend line as the buyers battle to defend the support and keep the bull run alive.
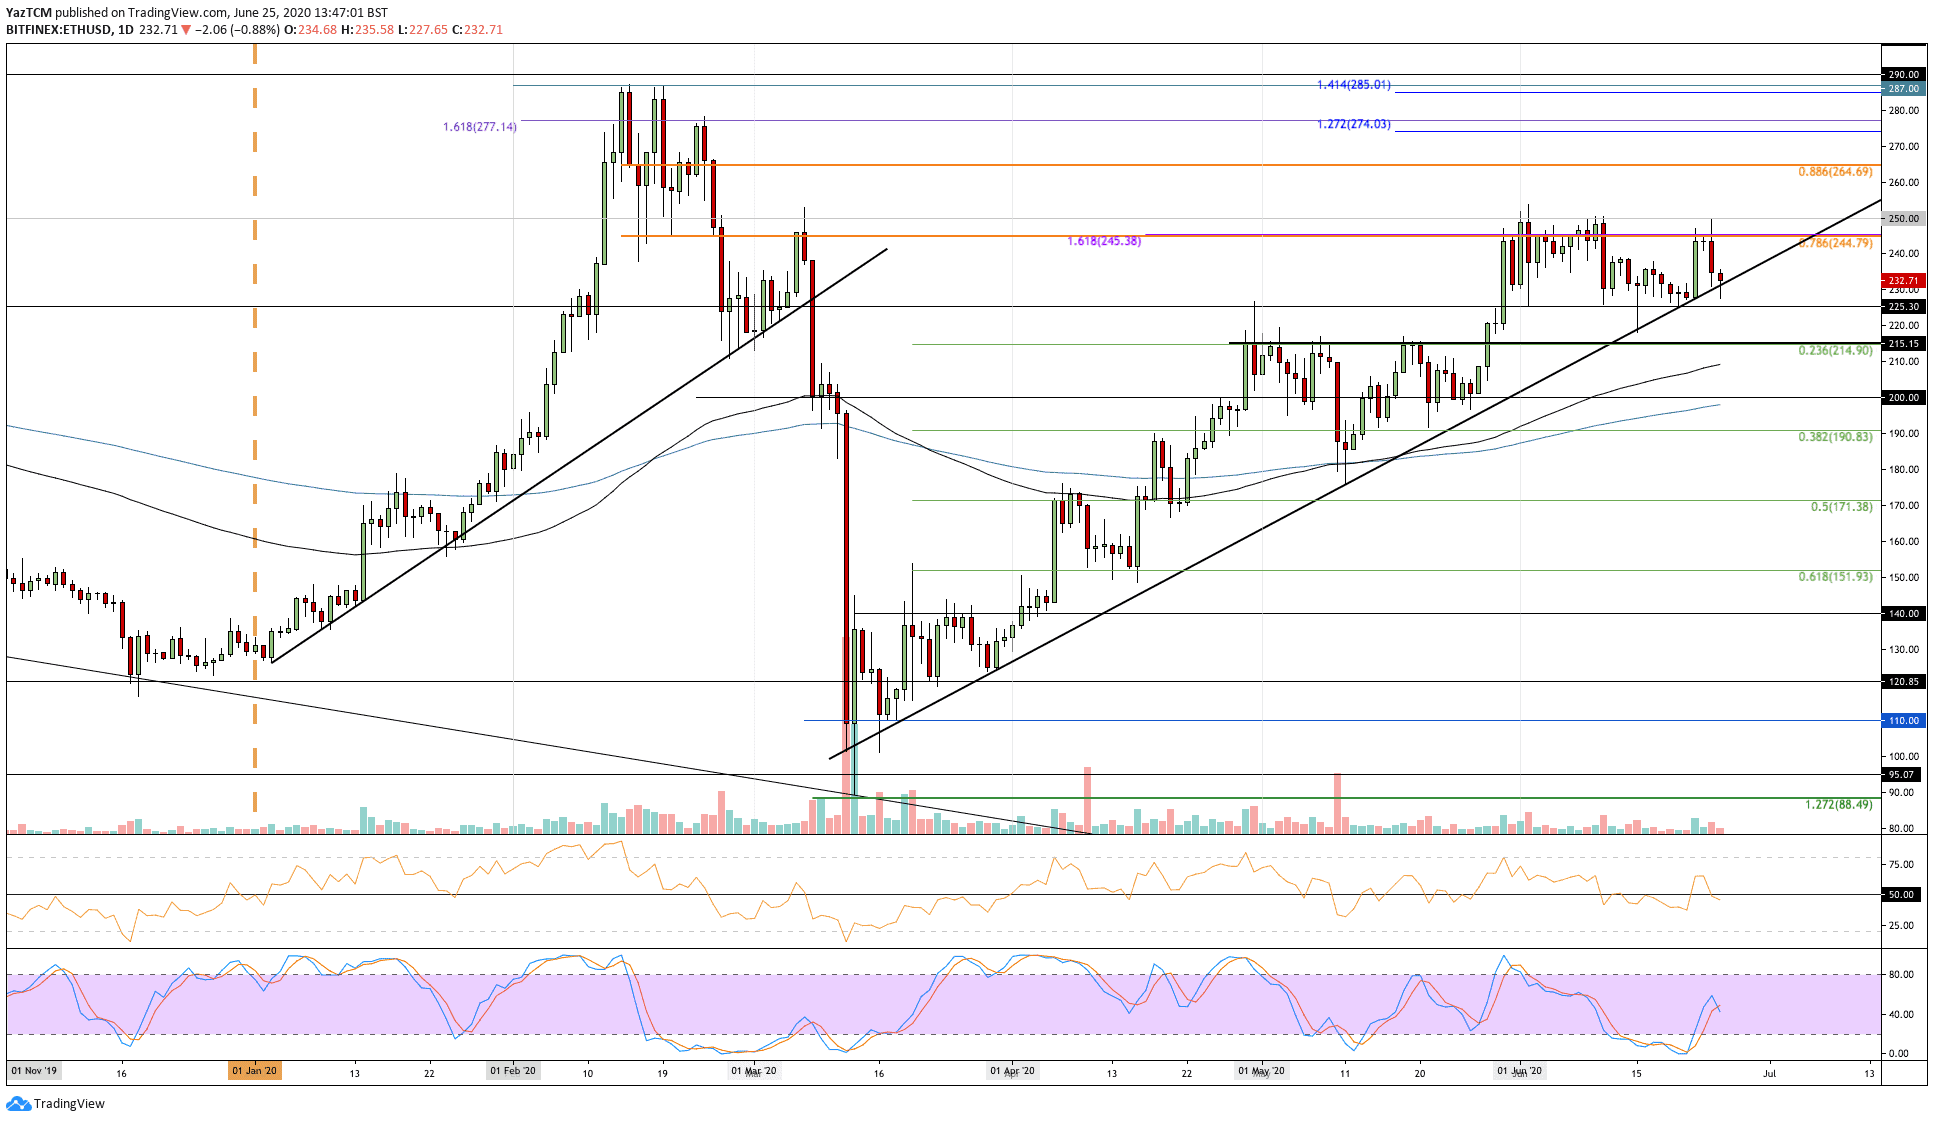
ETH-USD Short Term Price Prediction
Looking ahead, if the sellers push beneath the rising trend line, support is expected at $225 and $215. Beneath this, added support lies at $210 (100-day EMA) and $200 (200-day EMA).
On the other side, if the bulls push higher, the first two levels of resistance lie at $245 and $250. Above this, added resistance is expected at $265 (bearish .886 Fib Retracement) and $275.
The RSI recently dipped beneath the 50 line to show that the sellers have started to take control of the market momentum.
ETH/BTC: ETH Re-testing 0.0253 BTC Resistance
Against Bitcoin, Ethereum surged higher this week as it returned to the 0.0253 BTC resistance. ETH has been struggling to close above this level for the past three days of trading. The resistance had also caused trouble for ETH during late May and early June.
If the buyers can break the aforementioned resistance, they will be clear to make an attempt at the 2020 price high at around0.0278 BTC.

ETH-BTC Short Term Price Prediction
Above the 0.0253 BTC level, higher resistance is found at 0.026 BTC (bearish .786 Fib Retracement), 0.0263 BTC, and 0.0266 BTC (bearish .886 Fib Retracement).
On the other side, if the sellers push lower, the first level of support lies at 0.025 BTC. Beneath this, support is found at 0.0243 BTC (.236 Fib Retracement), 0.0239 BTC, and 0.0235 BTC (.382 Fib Retracement & 100-days EMA).
The RSI remains well above the 50 line to indicate that the buyers are in comfortable control of the market momentum. However, the Stochastic RSI is in oversold conditions, and a bearish crossover signal would send the market lower.