Ethereum dropped a steep 12% over the last 24-hours as it sinks into support at 5.The cryptocurrency initially climbed into the 0 resistance before severely rolling over and crashing toward the 100-days exponential moving average.Against Bitcoin, Ethereum also dropped but found support at the 0.0247 BTC level.Key Support & Resistance LevelsETH/USD:Support: 0, 0, 1.Resistance: 6, 0, 5.ETH/BTC:Support: 0.025 BTC, 0.0247 BTC, 0.0239 BTC.Resistance: 0.0263 BTC, 0.027 BTC, 0.0278 BTC.ETH/USD: ETH Finds Support At The 100-days EMASince our last analysis, Ethereum climbed above 0 and even hit 0 before the market rolled over and reversed. The price drop is primarily following the Bitcoin price, which crashed and broke beneath ,000 after a turbulent OPEC meeting last
Topics:
Yaz Sheikh considers the following as important: ETH Analysis, Ethereum (ETH) Price
This could be interesting, too:
Mandy Williams writes Ethereum Derivatives Metrics Signal Modest Downside Tail Risk Ahead: Nansen
CryptoVizArt writes Will Weak Momentum Drive ETH to .5K? (Ethereum Price Analysis)
Mandy Williams writes Ethereum Key Metrics Point to Persistent Bullish Outlook for ETH: CryptoQuant
CryptoVizArt writes Ethereum Price Analysis: Following a 15% Weekly Crash, What’s Next for ETH?
- Ethereum dropped a steep 12% over the last 24-hours as it sinks into support at $205.
- The cryptocurrency initially climbed into the $250 resistance before severely rolling over and crashing toward the 100-days exponential moving average.
- Against Bitcoin, Ethereum also dropped but found support at the 0.0247 BTC level.
Key Support & Resistance Levels
ETH/USD:
Support: $200, $190, $171.
Resistance: $206, $220, $225.
ETH/BTC:
Support: 0.025 BTC, 0.0247 BTC, 0.0239 BTC.
Resistance: 0.0263 BTC, 0.027 BTC, 0.0278 BTC.
ETH/USD: ETH Finds Support At The 100-days EMA
Since our last analysis, Ethereum climbed above $240 and even hit $250 before the market rolled over and reversed. The price drop is primarily following the Bitcoin price, which crashed and broke beneath $8,000 after a turbulent OPEC meeting last Friday, along with the Coronavirus devastating effects.
Ethereum crashed beneath support at $220 (.5 Fib Retracement), and $206 (.618 Fib Retracement) to land at support provided by the 100-days EMA at $200. It dipped even lower but managed to bounce rapidly back above $200.
This latest price decline puts ETH at a monthly price low, after breaking down a critical ascending trend-line.

ETH-USD Short Term Price Prediction
From below, the first level of support lies at $200. Beneath this, support lies at $194 – $195 (today’s low, along with 200-days EMA), $190 (downside 1.618 Fib Extension), and $185. If the bears push lower, additional support lies at $180 and $171 (.886 Fib Retracement).
On the other side, the first level of resistance now lies at $206. Above this, support turned resistance levels are located at $220, $225, and $240.
The RSI has now dropped beneath 50 as the sellers take control of the market momentum.
ETH/BTC: ETH Finds Support At .382 Fib Retracement
Against Bitcoin, ETH failed to close above 0.027 BTC and rolled over. It then went on to drop by 7% (against BTC) as it found support at 0.0247 BTC, which is provided by a .382 Fib Retracement.
Since then, we saw a rebound back above 0.025 BTC, currently trading beneath 0.026 BTC.
In the short-term, this latest price drop still has not turned ETH bearish against BTC as it would need to close beneath 0.0245 BTC for this to happen. To turn bullish, ETH still needs to close above 0.0278 BTC.
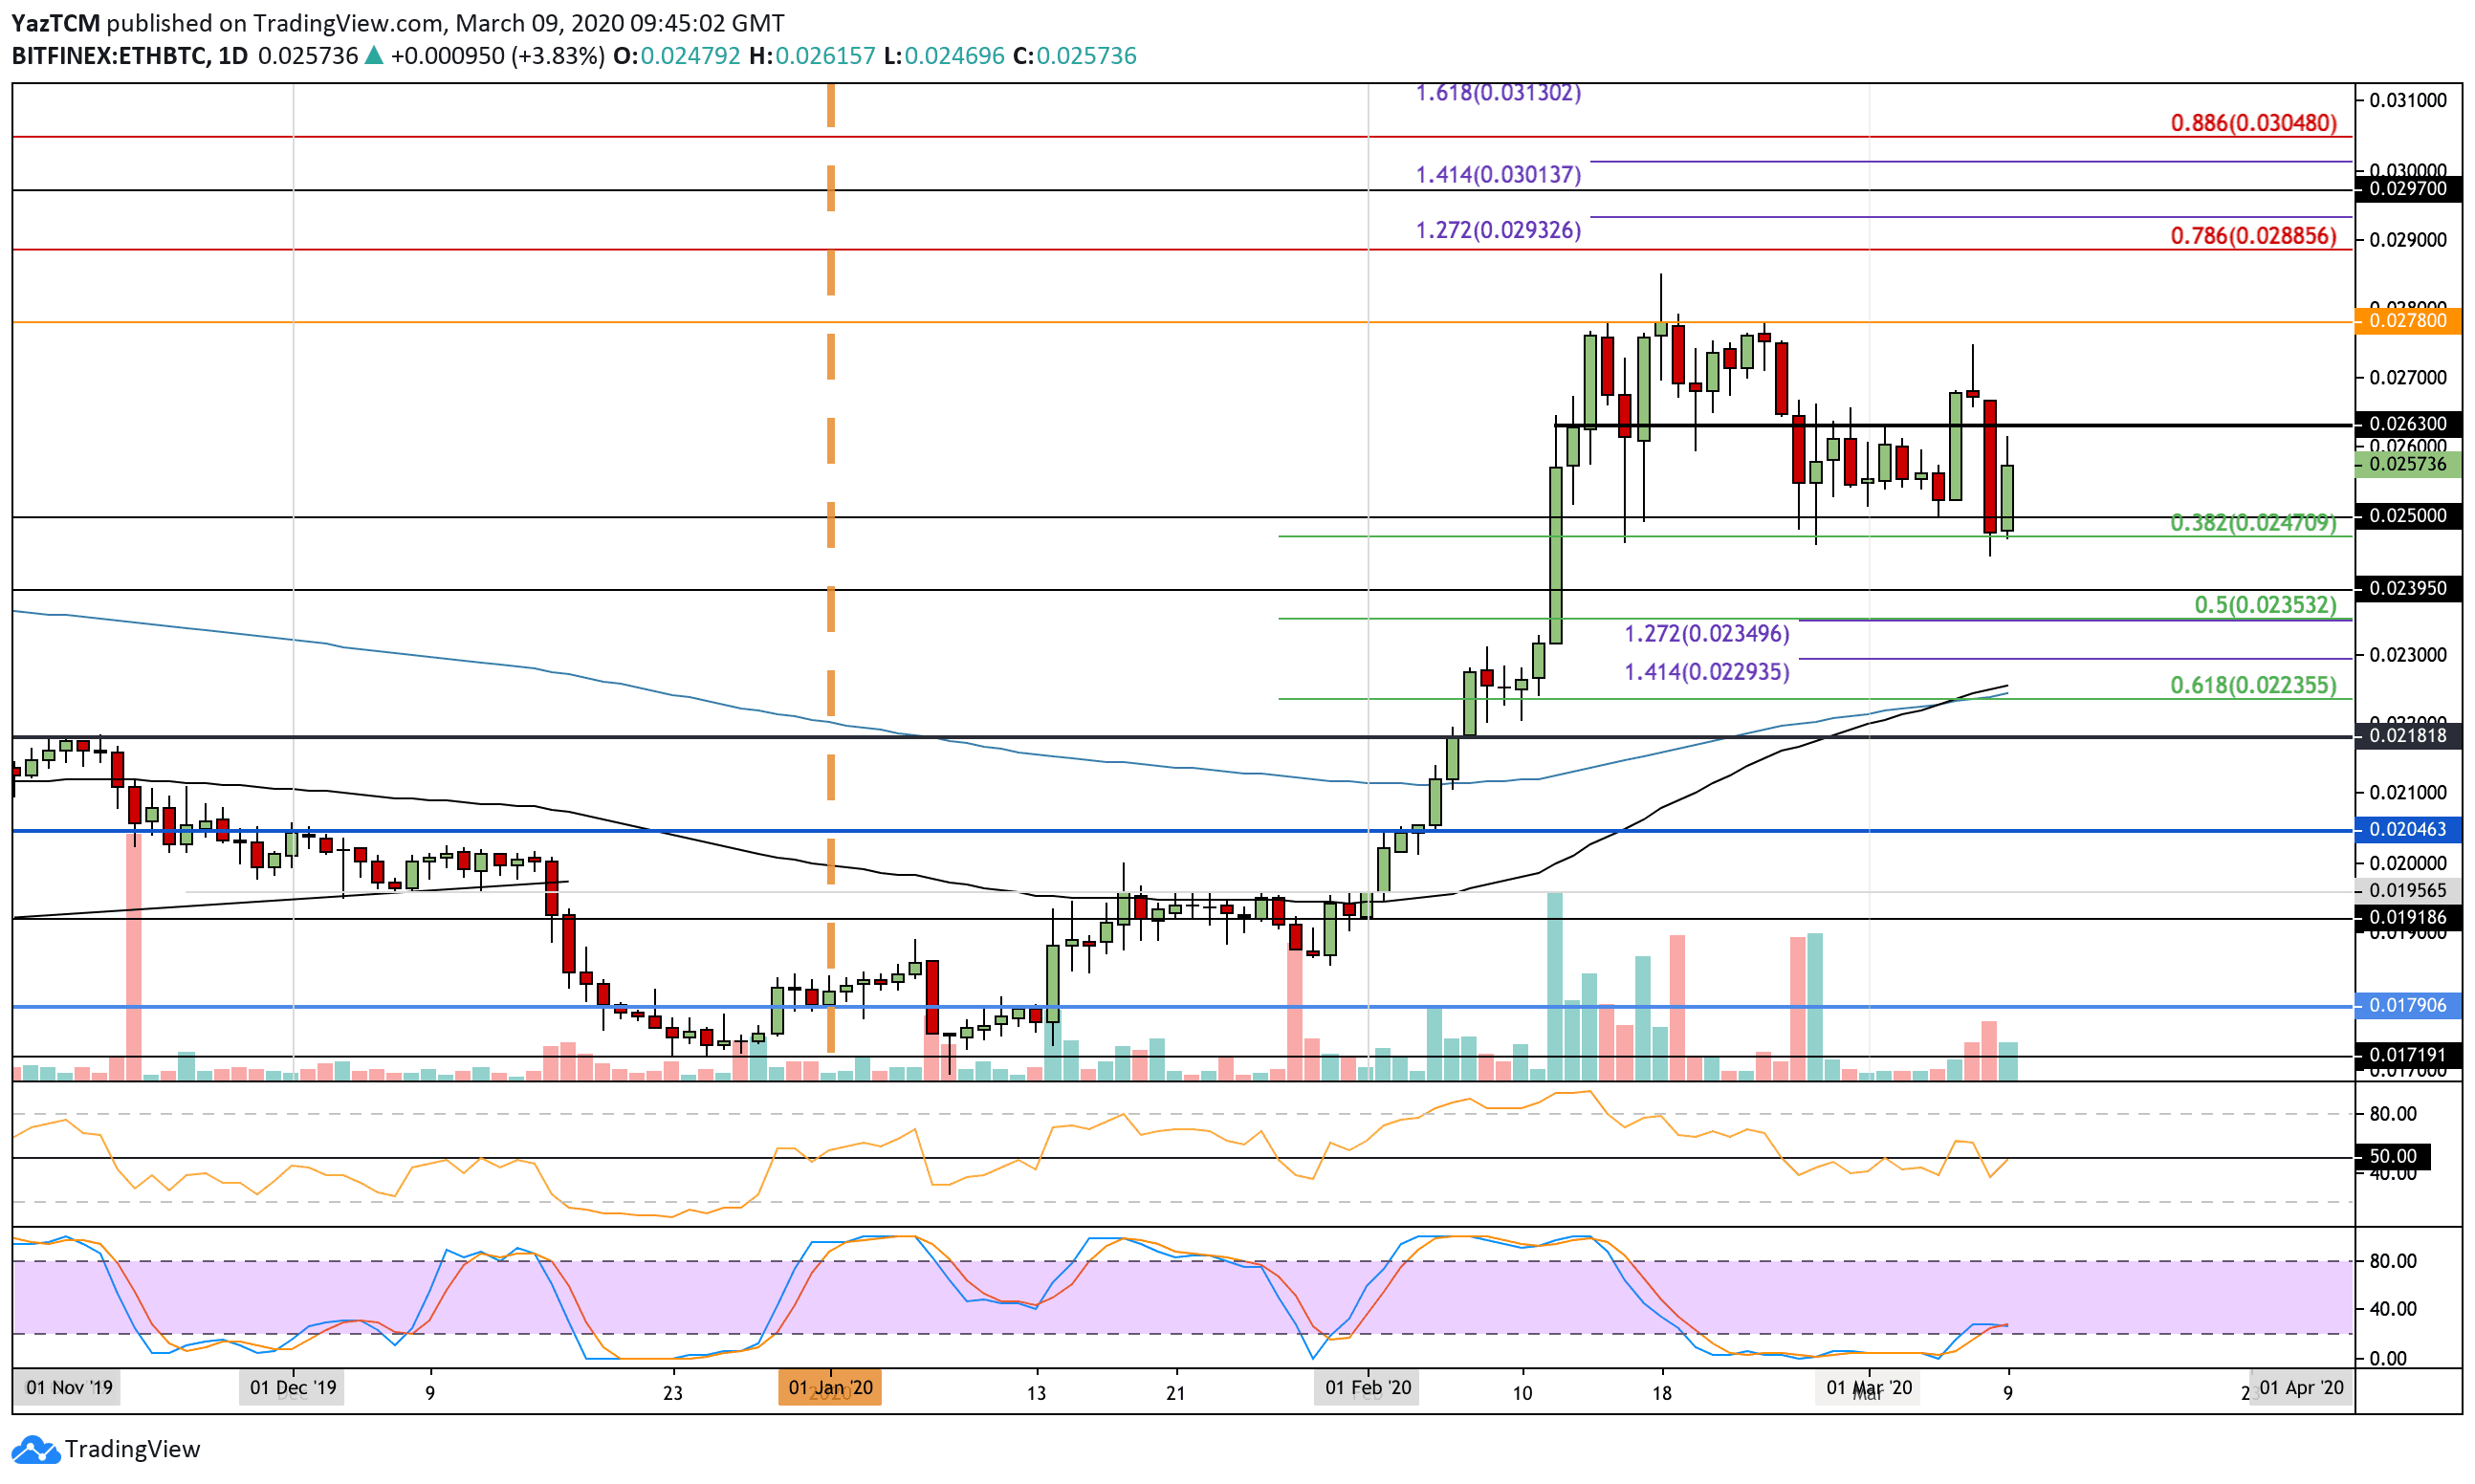
ETH-BTC Short Term Price Prediction
From above, the first level of resistance lies at 0.0263 BTC and 0.027 BTC. Above this, resistance can be found at 0.0278 BTC and 0.0288 BTC.
On the other hand, initial support is located at 0.025 BTC, 0.0247 BTC (.382 Fib Retracement), and 0.0239 BTC.
The RSI is trading at 50 after a brief dip below, and this shows indecision within the market. It would need to rise above 50 for the buyers to push ETH higher against BTC.