Ethereum saw an impressive 13% price surge today as the coin reached as high as 6.This allowed ETH to break out of the previous phase of consolidation and turn bullish.Against Bitcoin, Ethereum is attempting to create a fresh high-day closing candle for 2020.ETH/USD: Bullish Breakout Could Start Surge Toward 0Key Support Levels: 5, 0, 5Key Resistance Levels: 5, 7, 4Ethereum had found strong support at a rising trend line, which also acted as the lower boundary of a triangle, earlier in the week. It rebounded aggressively from there over the past couple of days, which allowed ETH to push above the previous ascending triangle pattern that it was trading within.After breaking higher, ETH continued to surge until it met resistance at 5 (bearish .886 Fib Retracement).
Topics:
Yaz Sheikh considers the following as important: ETH Analysis, ETHBTC, Ethereum (ETH) Price, ethusd
This could be interesting, too:
Mandy Williams writes Ethereum Derivatives Metrics Signal Modest Downside Tail Risk Ahead: Nansen
Jordan Lyanchev writes Weekly Bitcoin, Ethereum ETF Recap: Light at the End of the Tunnel for BTC
CryptoVizArt writes Will Weak Momentum Drive ETH to .5K? (Ethereum Price Analysis)
Jordan Lyanchev writes Bybit Hack Fallout: Arthur Hayes, Samson Mow Push for Ethereum Rollback
- Ethereum saw an impressive 13% price surge today as the coin reached as high as $276.
- This allowed ETH to break out of the previous phase of consolidation and turn bullish.
- Against Bitcoin, Ethereum is attempting to create a fresh high-day closing candle for 2020.
ETH/USD: Bullish Breakout Could Start Surge Toward $300
Key Support Levels: $265, $250, $245
Key Resistance Levels: $275, $287, $294
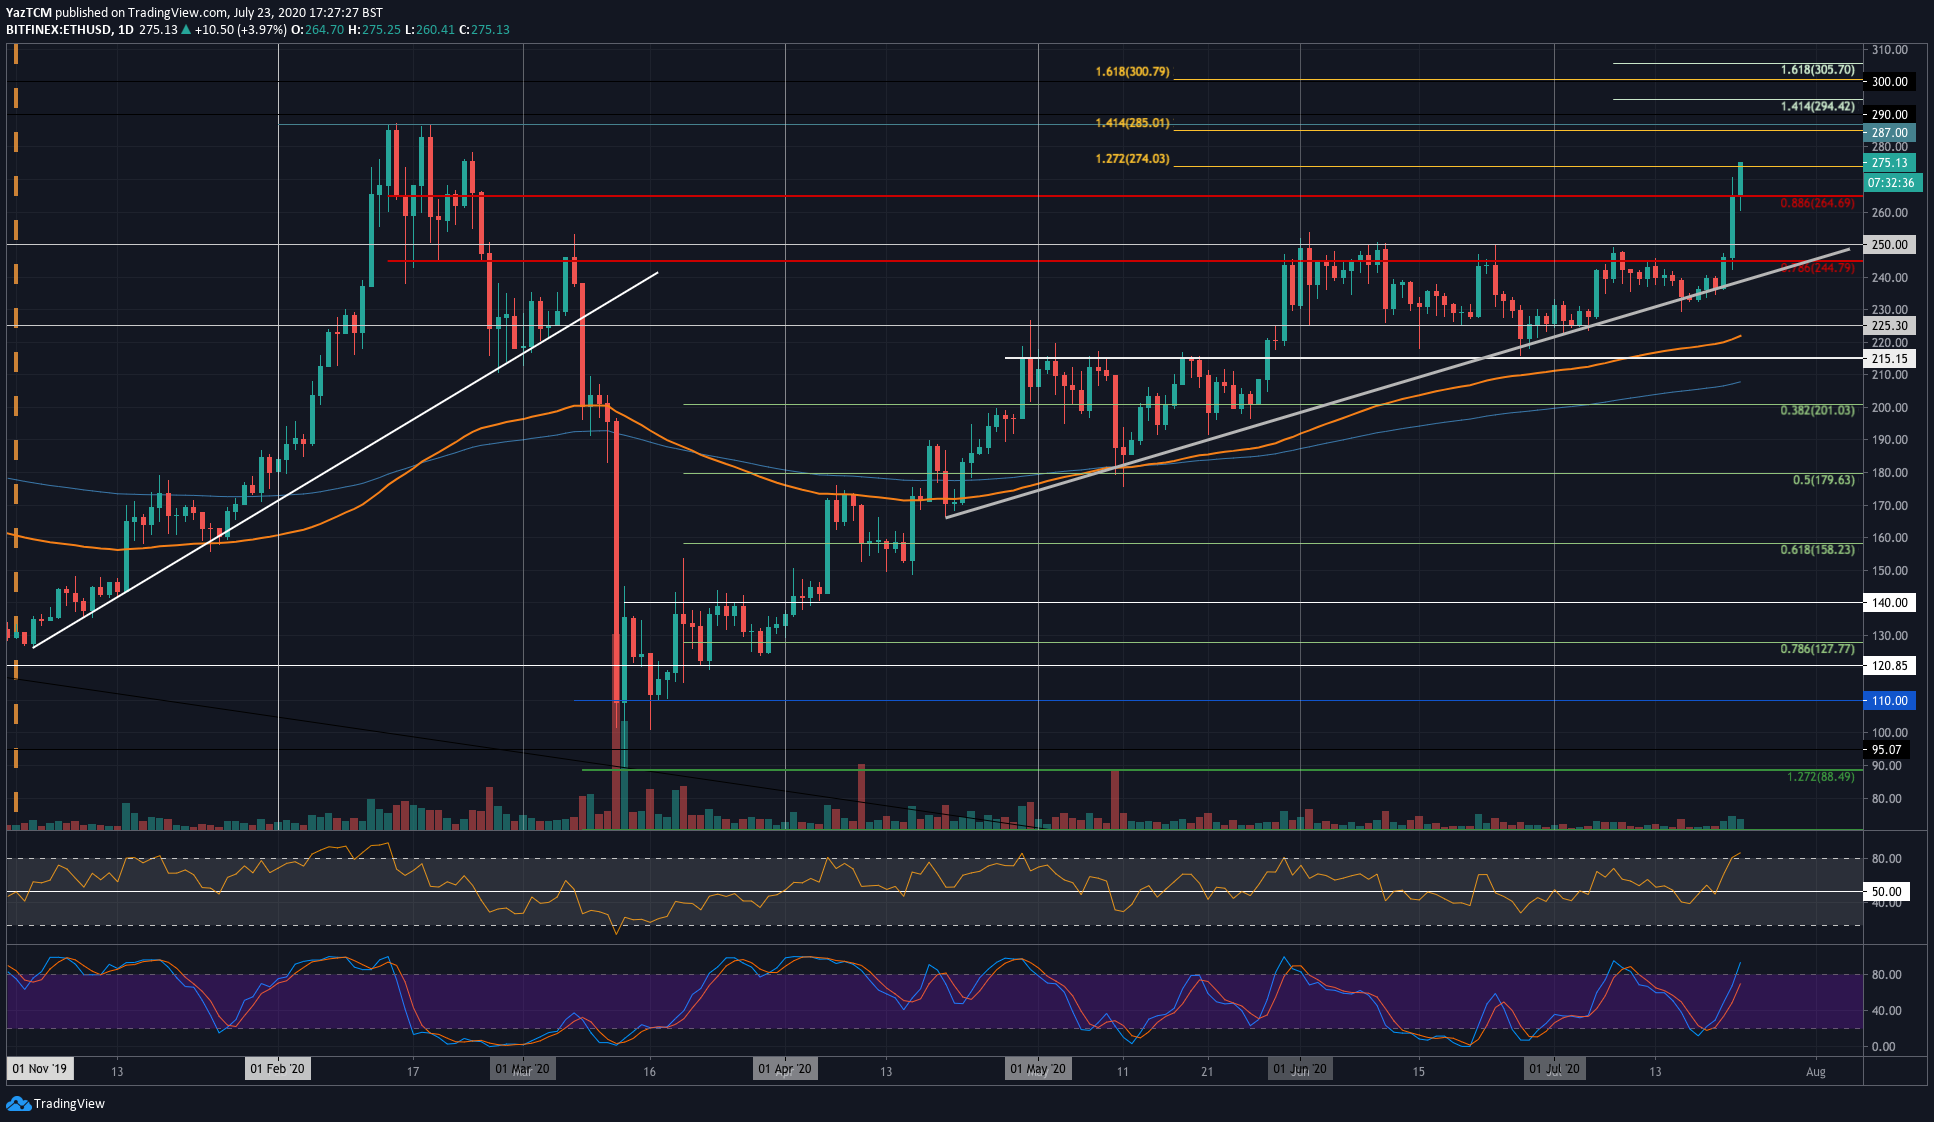
Ethereum had found strong support at a rising trend line, which also acted as the lower boundary of a triangle, earlier in the week. It rebounded aggressively from there over the past couple of days, which allowed ETH to push above the previous ascending triangle pattern that it was trading within.
After breaking higher, ETH continued to surge until it met resistance at $265 (bearish .886 Fib Retracement). It stalled here for a few short hours but eventually penetrated above as it reached the resistance at $274 (1.272 Fib Extension). This decisive breakout now shifts the sentiment towards the bullish favor for ETH as it heads toward the 2020 highs at $287.

ETH-USD Short Term Price Prediction
Looking ahead, if the buyers break the resistance at $274, immediate resistance is located at $287 (2020 high & 1.414 Fib Extension). Above this, resistance lies at $294 and $300.
On the other side, the first level of strong support lies at $265 and $250. Beneath this, support is found at $245, the rising trend line, and $220 (200-days EMA).
The RSI has exploded higher as it reached overbought conditions. This suggests the market may be a little overextended and may need a brief retracement.
ETH/BTC – Ethereum Bulls Re-Test 2020 Highs
Key Support Levels: 0.0278 BTC, 0.0273 BTC, 0.0263 BTC.
Key Resistance Levels: 0.0293 BTC, 0.03 BTC, 0.0304 BTC.
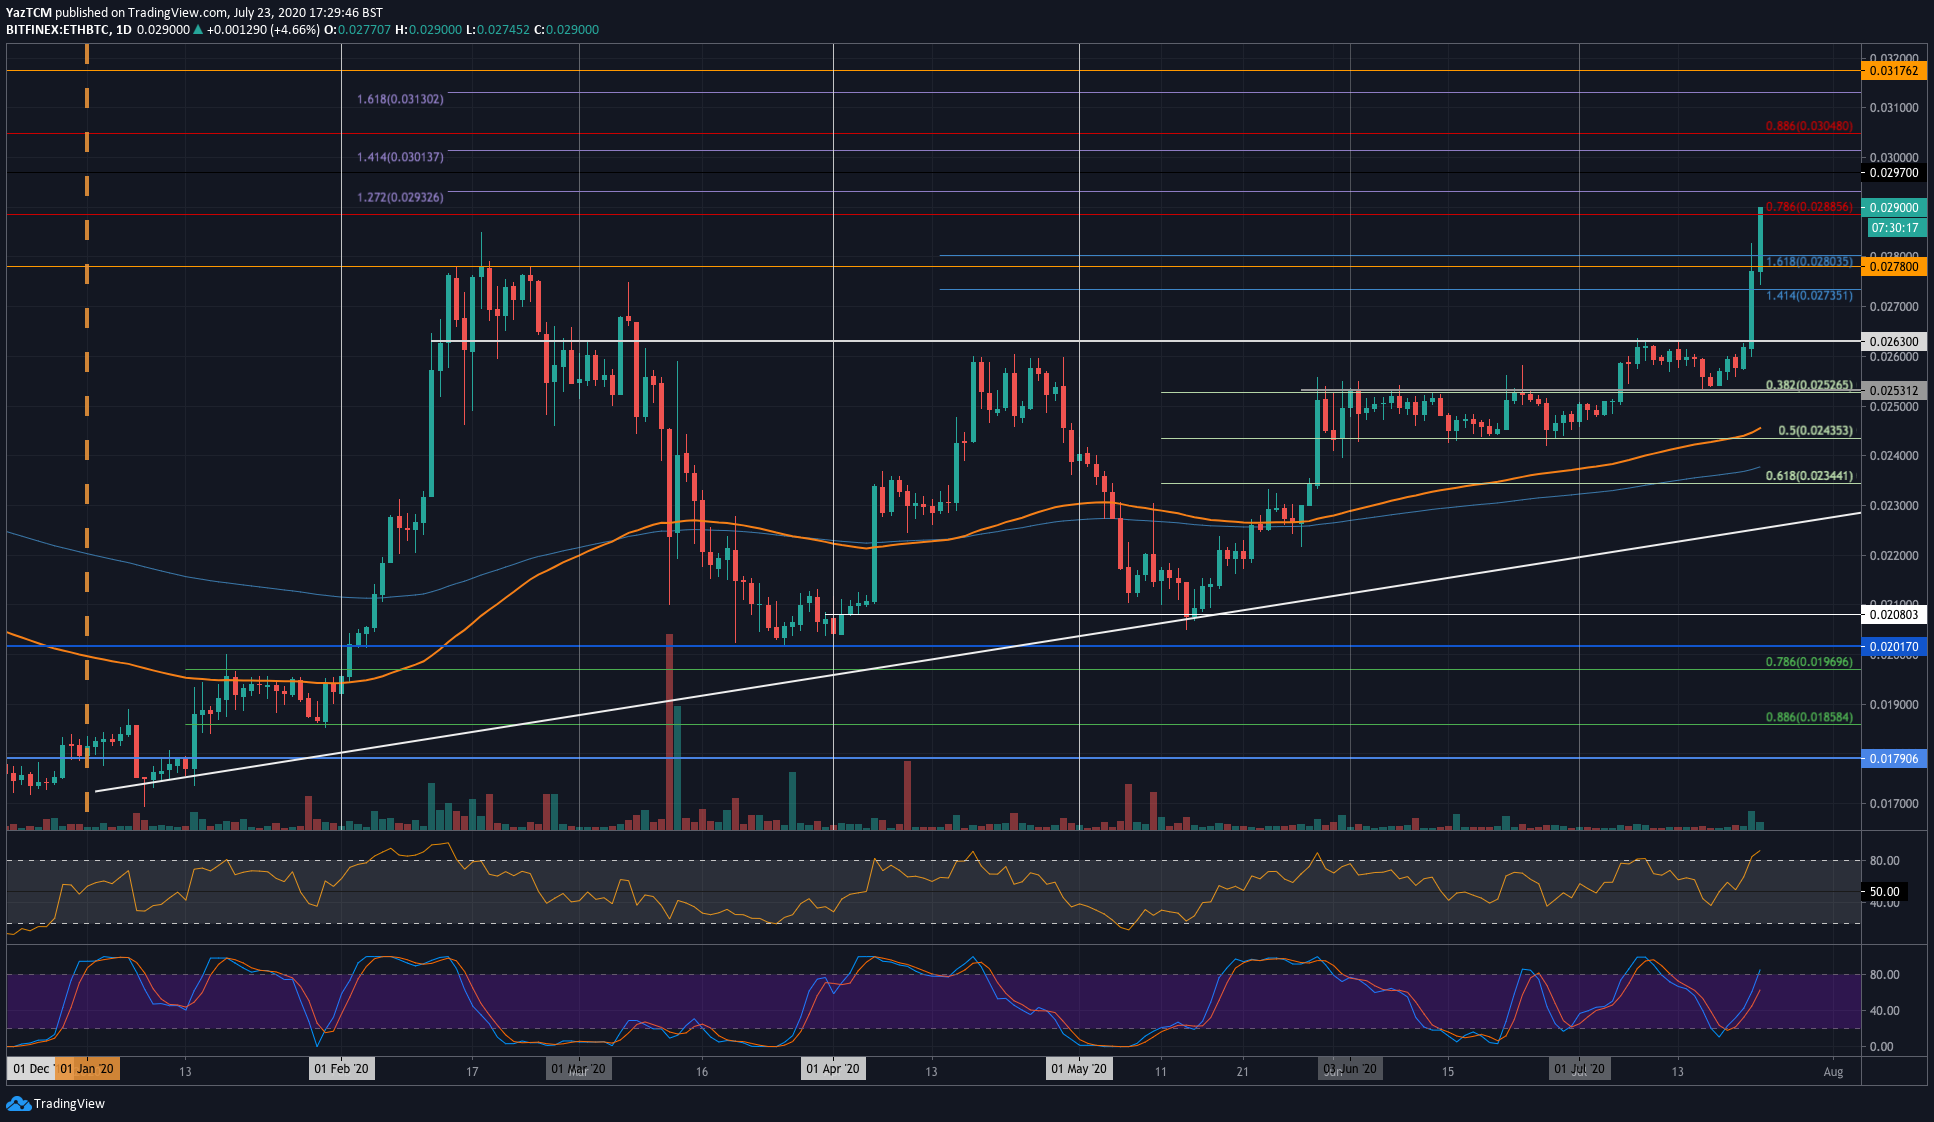
Against Bitcoin, ETH managed to push above the previous strong resistance at 0.0263 BTC over the past couple of days to continue higher and reach the 2020 high at 0.0278 BTC. This resistance was broken today as ETH created a fresh 2020 high at 0.029 BTC.
ETH struggled at 0.0263 BTC throughout the entire period of July, and this decisive breakout also turns it bullish.

ETH-BTC Short Term Price Prediction
If the bulls push higher, the first level of resistance lies at 0.0293 BTC (1.272 Fib Extension). Above this, added resistance lies at 0.030 BTC (1.414 Fib Extension) and 0.0304 BTC (bearish .886 Fib Retracement).
On the other side, support is found at 0.0278 BTC, 0.0273 BTC, 0.0263 BTC, and 0.0253 BTC (.382 Fib Retracement).
Likewise, the RSI has also reached overbought conditions, which could suggest the bulls are overextended and may need to retrace briefly before continuing higher.
