Ethereum saw a strong 5% price surge over the past 24 hours as the cryptocurrency trades at 2.Against BTC, ETH finally broke above the resistance at 0.0184 BTC, clearing the way to head toward 0.020 BTC.Ethereum also managed to break above the sideways trading range at 5 as it heads toward 0.Key Support & Resistance LevelsETH/USDSupport: 3.50, 8, 0.Resistance: 5, 2, 8.ETH/BTC:Support: 0.0185 BTC, 0.018 BTC, 0.0171 BTC.Resistance: 0.019 BTC, 0.0198 BTC, 0.0204 BTC.ETH/USD: ETH Finally Breaks 3.50 Since our last analysis, ETH went on to fall into the support at 8 but then spiked higher. It spent a day or two struggling with the resistance at 3.50 but finally managed to smash above this level in today’s trading session.Although Ethereum may be on the
Topics:
Yaz Sheikh considers the following as important: ETH Analysis
This could be interesting, too:
CryptoVizArt writes Will Weak Momentum Drive ETH to .5K? (Ethereum Price Analysis)
CryptoVizArt writes Ethereum Price Analysis: Following a 15% Weekly Crash, What’s Next for ETH?
CryptoVizArt writes ETH Seems Primed to Take Down K After Recent Rebound: Ethereum Price Analysis
CryptoVizArt writes Ethereum Price Analysis: Can ETH Take Down K Resistance After Gaining 10% Weekly?
- Ethereum saw a strong 5% price surge over the past 24 hours as the cryptocurrency trades at $142.
- Against BTC, ETH finally broke above the resistance at 0.0184 BTC, clearing the way to head toward 0.020 BTC.
- Ethereum also managed to break above the sideways trading range at $135 as it heads toward $150.
Key Support & Resistance Levels
ETH/USD
Support: $133.50, $128, $120.
Resistance: $145, $152, $158.
ETH/BTC:
Support: 0.0185 BTC, 0.018 BTC, 0.0171 BTC.
Resistance: 0.019 BTC, 0.0198 BTC, 0.0204 BTC.
ETH/USD: ETH Finally Breaks $133.50
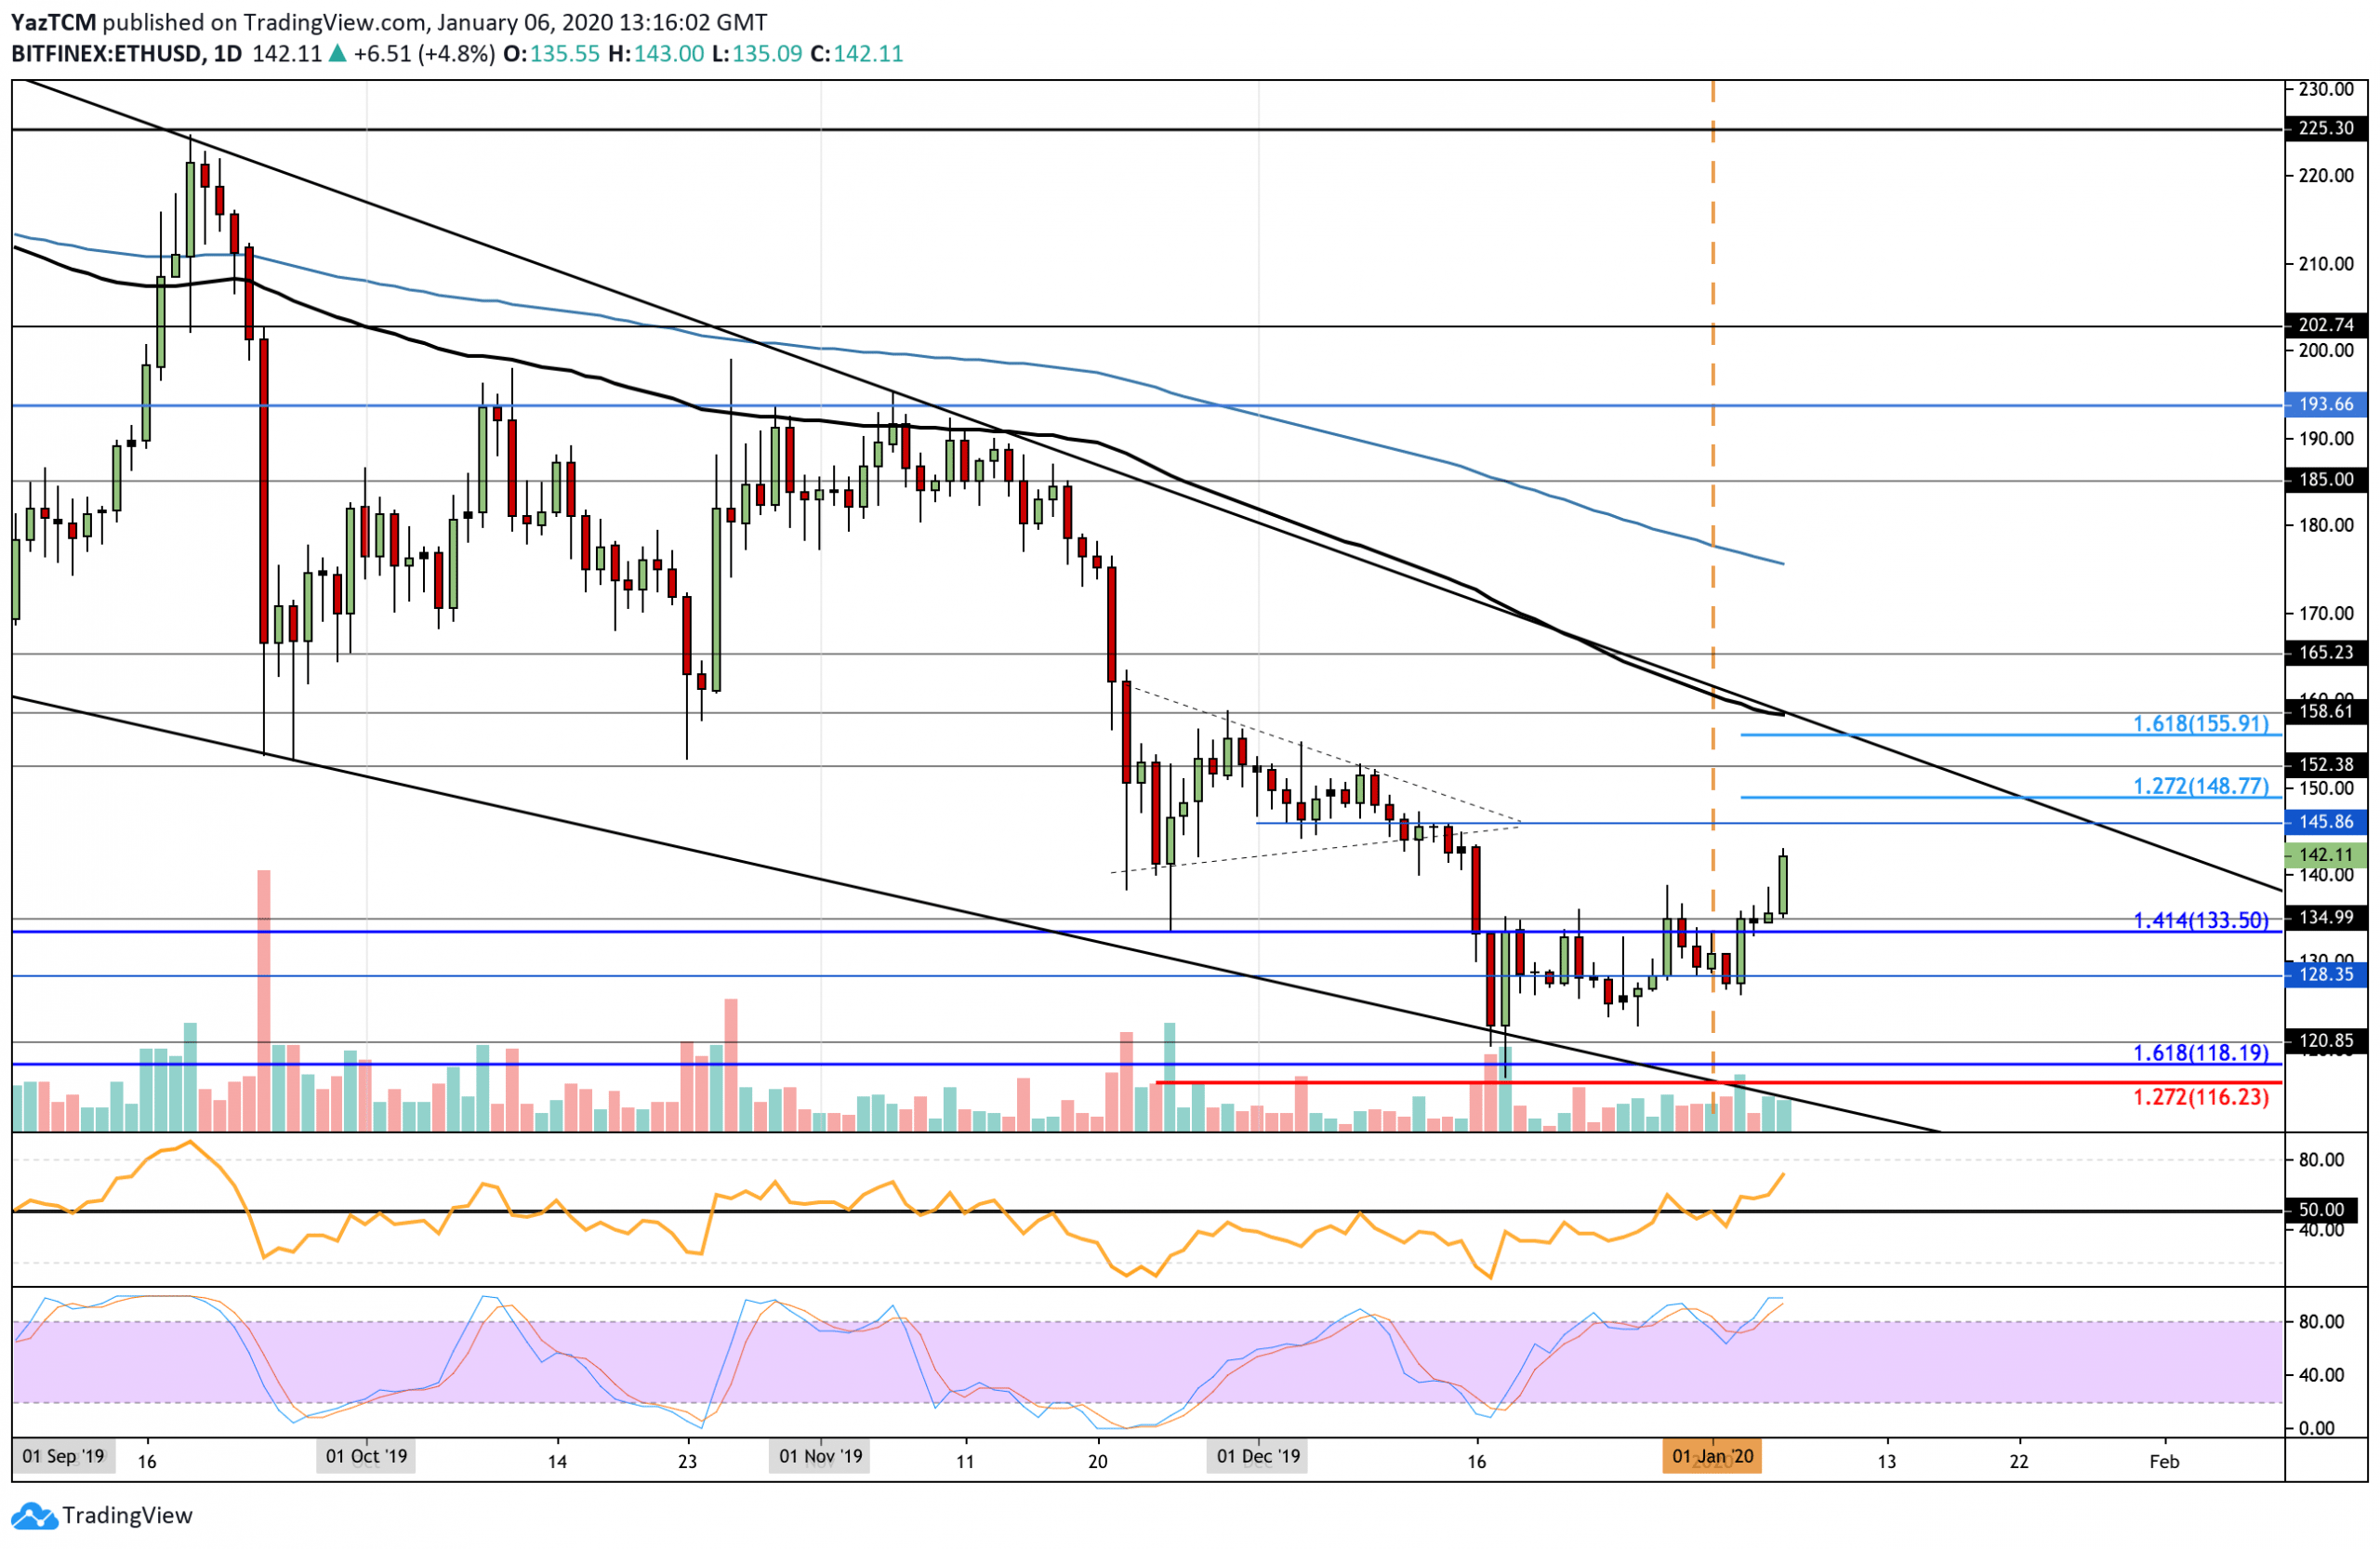 Since our last analysis, ETH went on to fall into the support at $128 but then spiked higher. It spent a day or two struggling with the resistance at $133.50 but finally managed to smash above this level in today’s trading session.
Although Ethereum may be on the positive footing, it would still need to break above the resistance at $152 to clear the December 2019 price high and turn strongly bullish. On the other hand, it would need to fall and drop beneath $120 to turn bearish again.
Ethereum Short Term Price Prediction
If the bulls continue to drive ETH higher over the next few days, an initial resistance is located at $145 and $150. If the buyers continue above $152, higher resistance is expected at $156 (100-days EMA), $165 and $176 (200-days EMA). Alternatively, if the sellers push the market lower, initial support is located at $135 and $133.50. Beneath this, additional support is found at $130, $128, and $120.
The RSI has broken above the 50 level as the momentum finally reaches the bull’s favor. However, the Stochastic RSI is in overbought conditions in which a bearish crossover signal could send the cryptocurrency lower.
ETH/BTC: ETH On The Way To Test 0.020 BTC Again.
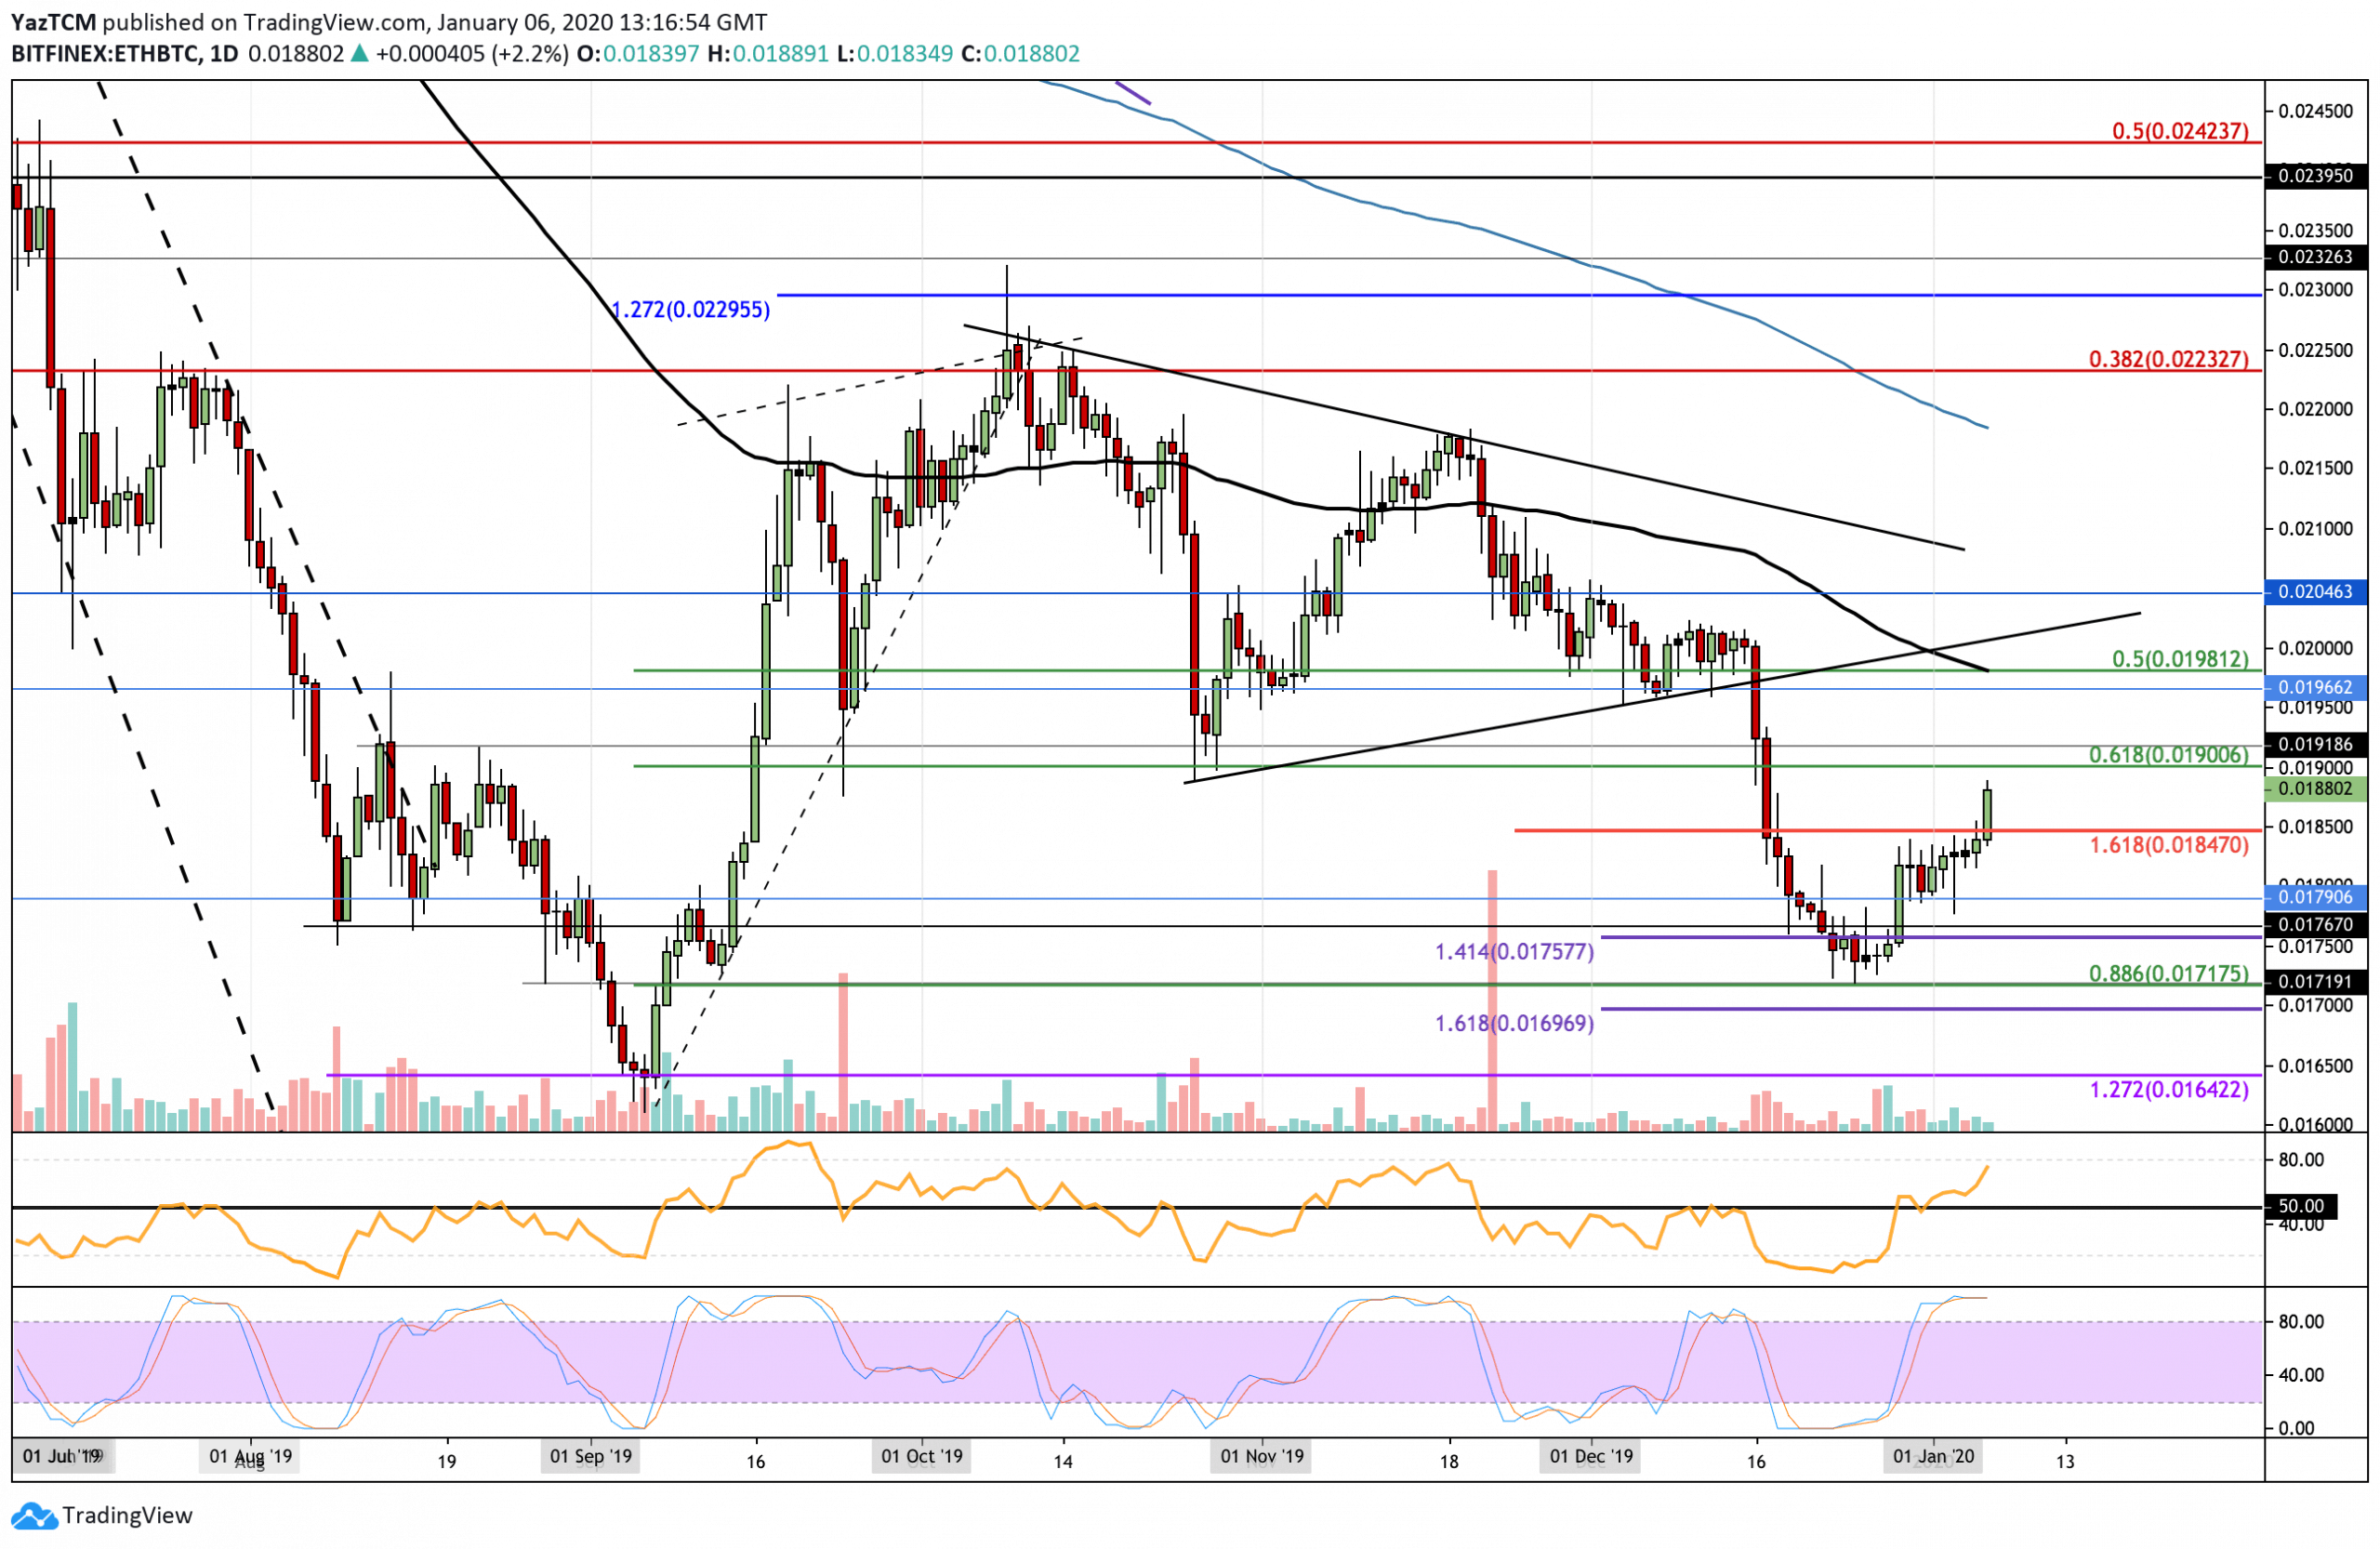
Against Bitcoin, ETH started to slowly grind higher as it struggled to break above the resistance at 0.01847 BTC. The cryptocurrency managed to penetrate above this level of resistance in today’s trading session, allowing the price for ETH to rise to the 0.0188 BTC level.
ETH is still pretty far from being considered as bullish as it would need to break above 0.0204 BTC to clear the December 2019 highs. On the other hand, if ETH was to drop and fall beneath the support at 0.0171 BTC the market would be considered as bearish once again.
Ethereum Short Term Price Prediction
If the bulls continue to push ETH higher against BTC, the first level of resistance will be located at 0.019 BTC. Above this, resistance is expected at 0.0195 BTC and 0.0198 BTC (100-days EMA). If the bulls continue to break above 0.020 BTC, resistance is then expected at 0.0204 BTC (December high). On the other hand, if the sellers step back in and push the market lower, support is found at 0.01847 BTC. Beneath this, additional support is found at 0.018 BTC, 0.0176 BTC, and 0.0171 BTC.
The RSI has penetrated above the 50 level to show that the bulls dominate the market momentum. However, the Stochastic RSI is also in overbought conditions which warn traders to be cautious as a bearish crossover signal could send the market lower.