Etheruem rebounded and increased by 5% over the past 24-hours to return into the 2020 high at 7.Over the past few days, ETH dropped into support at 7, where it bounced higher again.Against Bitcoin, ETH clocked a fresh 2020 high above 0.028 BTC.Key Support & Resistance LevelsETH/USD:Support: 0, 7, 2.Resistance:7, 0, 0.ETH/BTC:Support: 0.027 BTC, 0.0261 BTC, 0.0256 BTC..Resistance: 0.0278 BTC, 0.0288 BTC, 0.030 BTC .ETH/USD – Ethereum Returns to 2020 HighSince our last analysis, the support at 7 (.382 Fib Retracement) held and allowed ETH to bounce higher back above 0 and into the 2020 high at 7.Etheruem has now seen a strong 60% price increase over the past 30-days of trading, making it the strongest performing cryptocurrency out of the top-5 ranked
Topics:
Yaz Sheikh considers the following as important: ETH Analysis, Ethereum (ETH) Price
This could be interesting, too:
Mandy Williams writes Ethereum Derivatives Metrics Signal Modest Downside Tail Risk Ahead: Nansen
CryptoVizArt writes Will Weak Momentum Drive ETH to .5K? (Ethereum Price Analysis)
Mandy Williams writes Ethereum Key Metrics Point to Persistent Bullish Outlook for ETH: CryptoQuant
CryptoVizArt writes Ethereum Price Analysis: Following a 15% Weekly Crash, What’s Next for ETH?
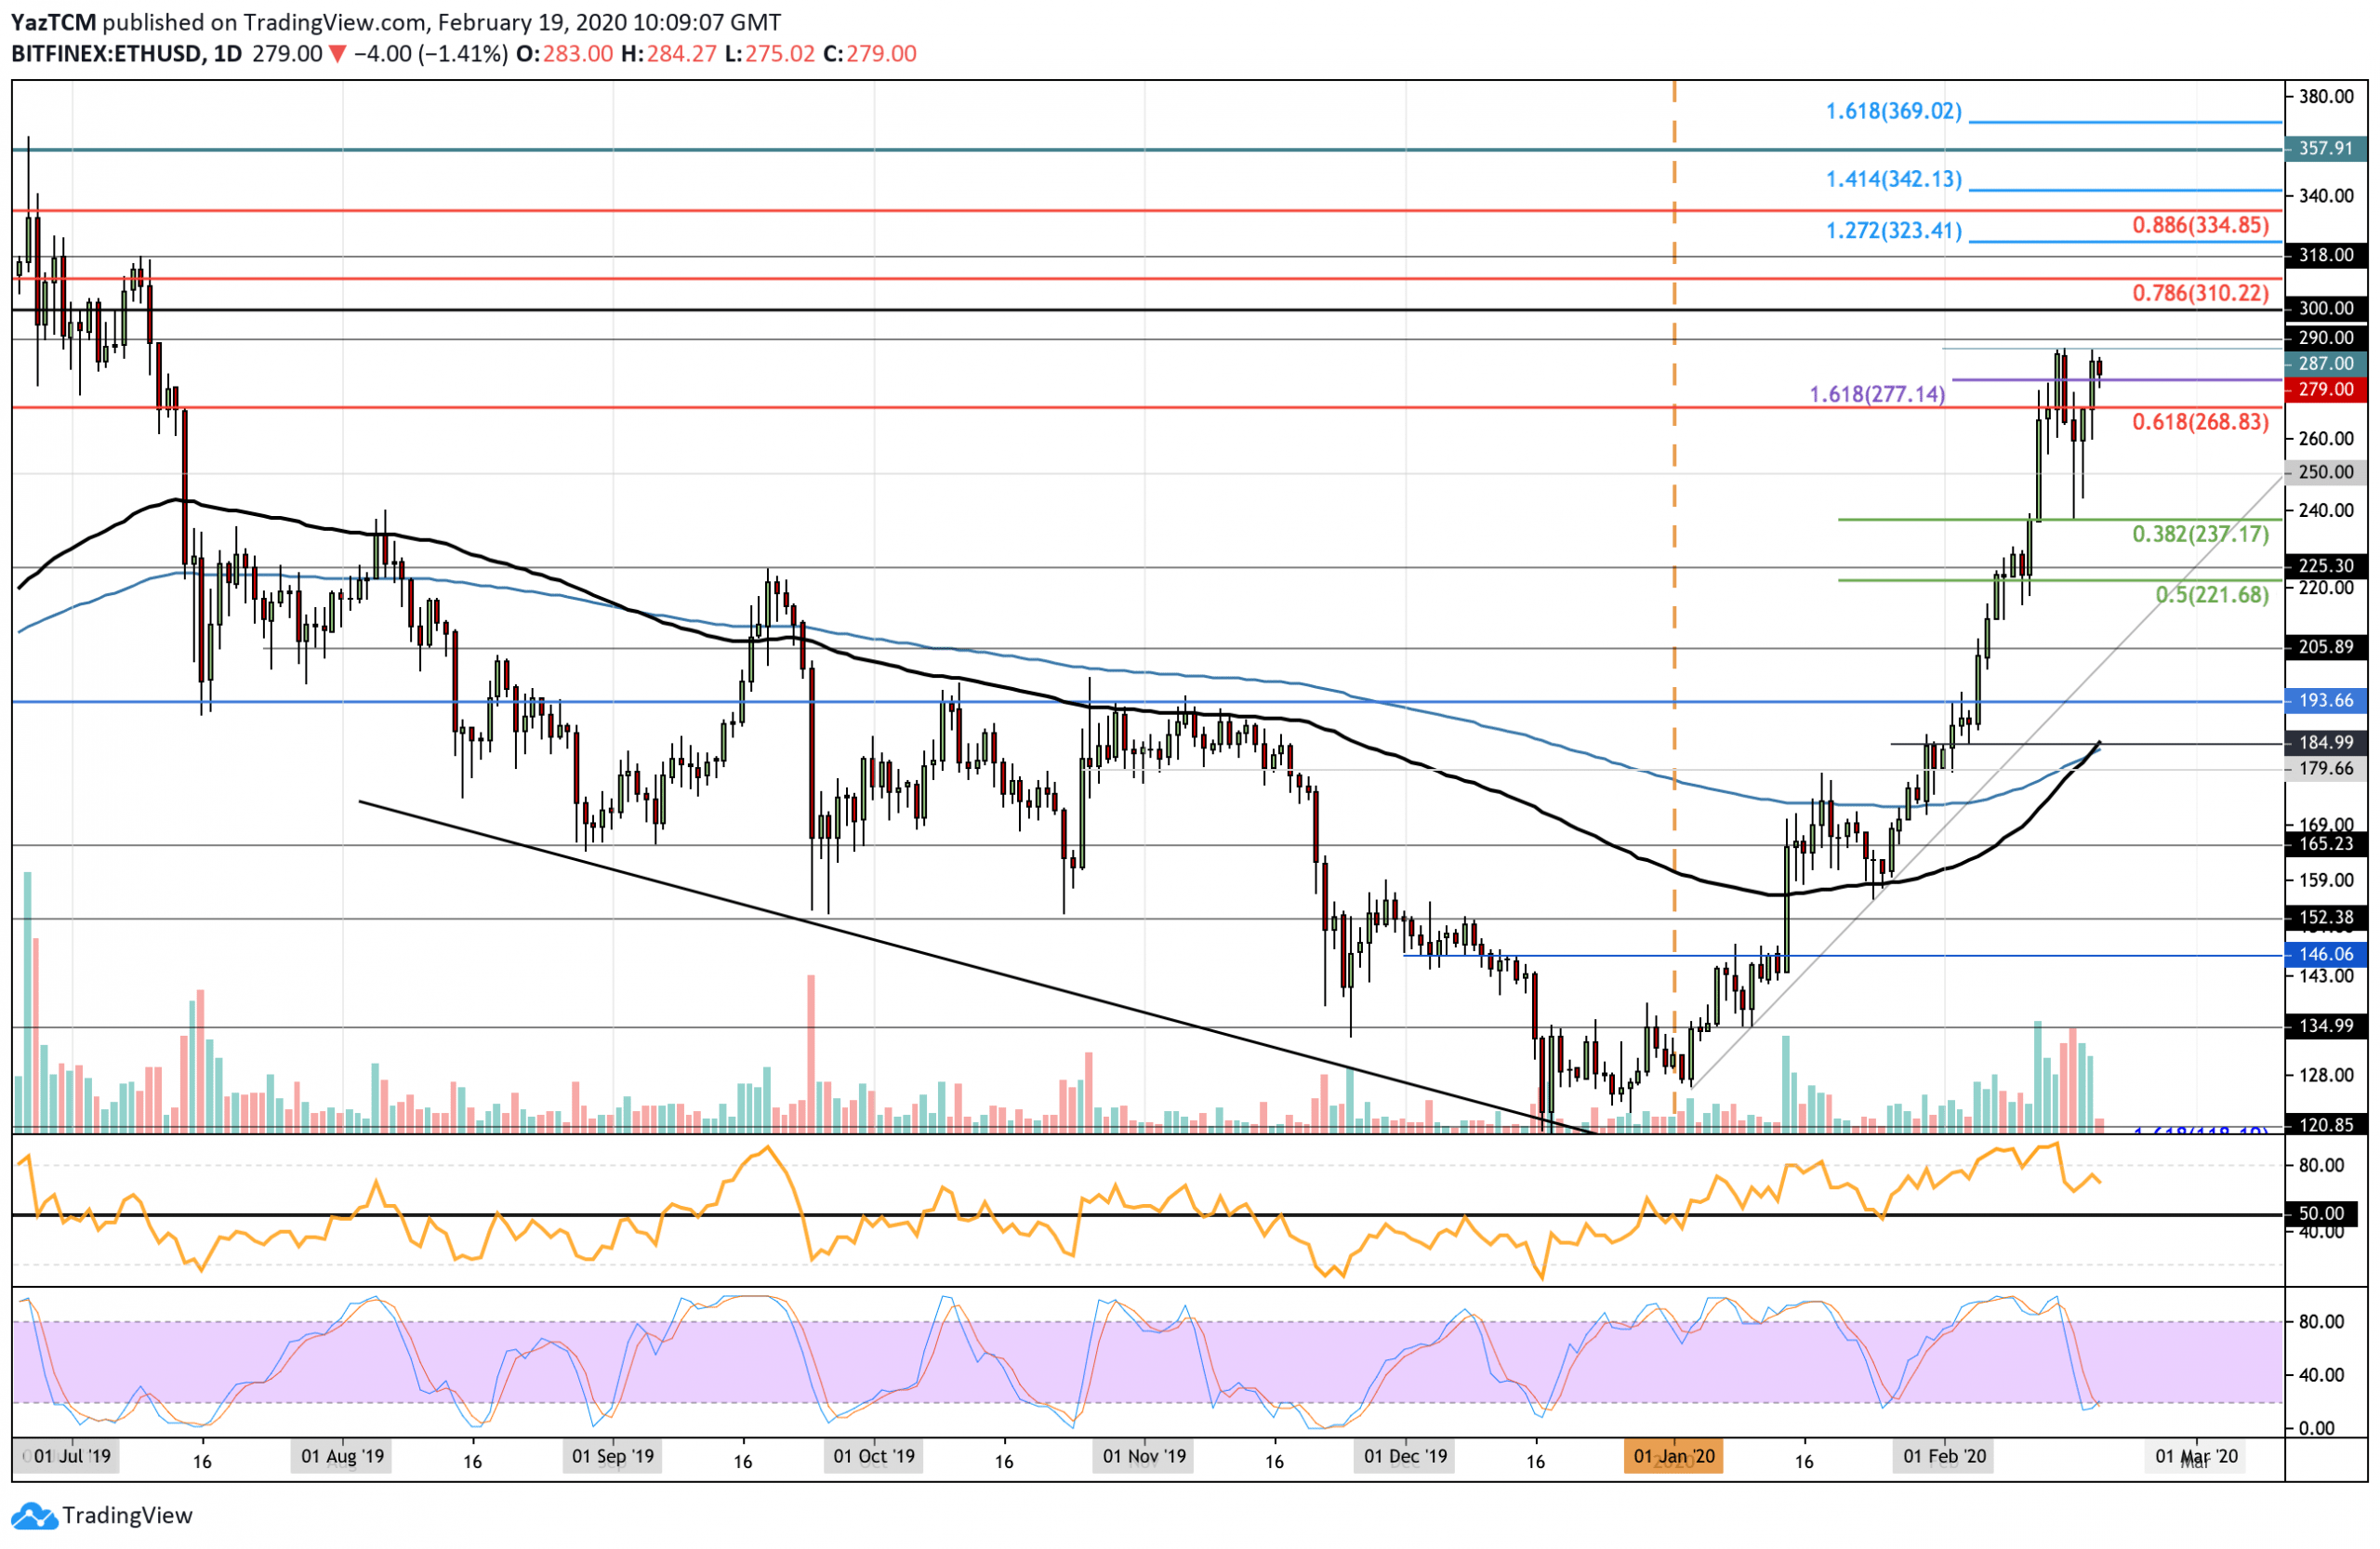
- Etheruem rebounded and increased by 5% over the past 24-hours to return into the 2020 high at $287.
- Over the past few days, ETH dropped into support at $237, where it bounced higher again.
- Against Bitcoin, ETH clocked a fresh 2020 high above 0.028 BTC.
Key Support & Resistance Levels
ETH/USD:
Support: $250, $237, $222.
Resistance:$287, $300, $310.
ETH/BTC:
Support: 0.027 BTC, 0.0261 BTC, 0.0256 BTC..
Resistance: 0.0278 BTC, 0.0288 BTC, 0.030 BTC .
ETH/USD – Ethereum Returns to 2020 High
Since our last analysis, the support at $237 (.382 Fib Retracement) held and allowed ETH to bounce higher back above $250 and into the 2020 high at $287.
Etheruem has now seen a strong 60% price increase over the past 30-days of trading, making it the strongest performing cryptocurrency out of the top-5 ranked projects.
The volume for Ethereum has increased dramatically during February and is still maintaining its high pace. The cryptocurrency remains bullish and would need to drop beneath $200 for this to be invalidated.
Ethereum Short Term Price Prediction
If the buyers break above the 2020 high at $287 and above $290, the next level of resistance is located at $300. Beyond this, resistance lies at $310 (bearish .786 Fib Retracement), $323 (1.272 Fib Extension), and $334 (bearish .886 Fib Retracement).
Alternatively, if the sellers push lower, the first level of support lies at $250. Beneath this, support is expected at $237 (.382 Fib Retracement) and $222 (.5 Fib Retracement).
The RSI is still above the 50 level to indicate that the bulls are in charge of the momentum. However, the recent downtick might be a slight cause for concern and should be watched. Nevertheless, the Stochastic RSI is primed for a bullish crossover signal, which should provide a push higher for ETH/USD.
ETH/BTC – ETH Creates Fresh 2020 High Against Bitcoin
Against Bitcoin, ETH managed to remain supported at the 0.026 BTC level during the recent retracement. It did spike lower. However, it always managed to close each day above 0.026 BTC as the bulls remained in control.
Yesterday, Ethereum clocked in a fresh 2020 high against Bitcoin at 0.0284 BTC, but it fell lower and is struggling at the resistance around 0.0278 BTC.

Ethereum Short Term Price Prediction
If the buyers manage to break above 0.0278 BTC, resistance lies at 0.0288 BTC (bearish .786 Fib Retracement), 0.0297 BTC, 0.030 BTC, and 0.0304 BTC (bearish .886 Fib Retracement).
Alternatively, if the sellers break lower, the first level of support lies at 0.027 BTC. Beneath this, support lies at 0.0261 BTC and 0.0256 BTC.
The RSI also experienced a small downtick, which could be a cause for concern. The Stochastic RSI has not even reached oversold conditions, which show that there could be some bearish turbulence ahead.