Ethereum saw a 3% price decline over the past 24 hours of trading as the cryptocurrency drops into the 0 level.ETH was previously struggling at the 100-days EMA at around 5, which caused it to fall.Against Bitcoin, the bulls are battling to keep the cryptocurrency above 0.0229 BTC support.Key Support & Resistance LevelsETH/USD:Support: 4, 0, 0.Resistance: 5, 0, 0.ETH/BTC:Support: 0.0229 BTC, 0.0223 BTC, 0.0219 BTC.Resistance: 0.023 BTC, 0.0239 BTC, 0.0247 BTC..ETH/USD: Ethereum Reaches .5 Fib Retracement SupportEthereum continued to fall from the 0 resistance level, provided by the 100-days EMA, but managed to remain above 7 during the weekend. In today’s trading session, ETH fell beneath this to reach the 0 support provided by a .5 Fib Retracement.The
Topics:
Yaz Sheikh considers the following as important: ETH Analysis, ETHBTC, Ethereum (ETH) Price, ethusd
This could be interesting, too:
Mandy Williams writes Ethereum Derivatives Metrics Signal Modest Downside Tail Risk Ahead: Nansen
Jordan Lyanchev writes Weekly Bitcoin, Ethereum ETF Recap: Light at the End of the Tunnel for BTC
CryptoVizArt writes Will Weak Momentum Drive ETH to .5K? (Ethereum Price Analysis)
Jordan Lyanchev writes Bybit Hack Fallout: Arthur Hayes, Samson Mow Push for Ethereum Rollback
- Ethereum saw a 3% price decline over the past 24 hours of trading as the cryptocurrency drops into the $150 level.
- ETH was previously struggling at the 100-days EMA at around $175, which caused it to fall.
- Against Bitcoin, the bulls are battling to keep the cryptocurrency above 0.0229 BTC support.
Key Support & Resistance Levels
ETH/USD:
Support: $144, $140, $130.
Resistance: $165, $170, $180.
ETH/BTC:
Support: 0.0229 BTC, 0.0223 BTC, 0.0219 BTC.
Resistance: 0.023 BTC, 0.0239 BTC, 0.0247 BTC..
ETH/USD: Ethereum Reaches .5 Fib Retracement Support
Ethereum continued to fall from the $170 resistance level, provided by the 100-days EMA, but managed to remain above $157 during the weekend. In today’s trading session, ETH fell beneath this to reach the $150 support provided by a .5 Fib Retracement.
The momentum seems to have shifted for ETH, largely caused by Bitcoin dropping to $6,700, and it is likely to see ETH beneath $150 at some point during the week.
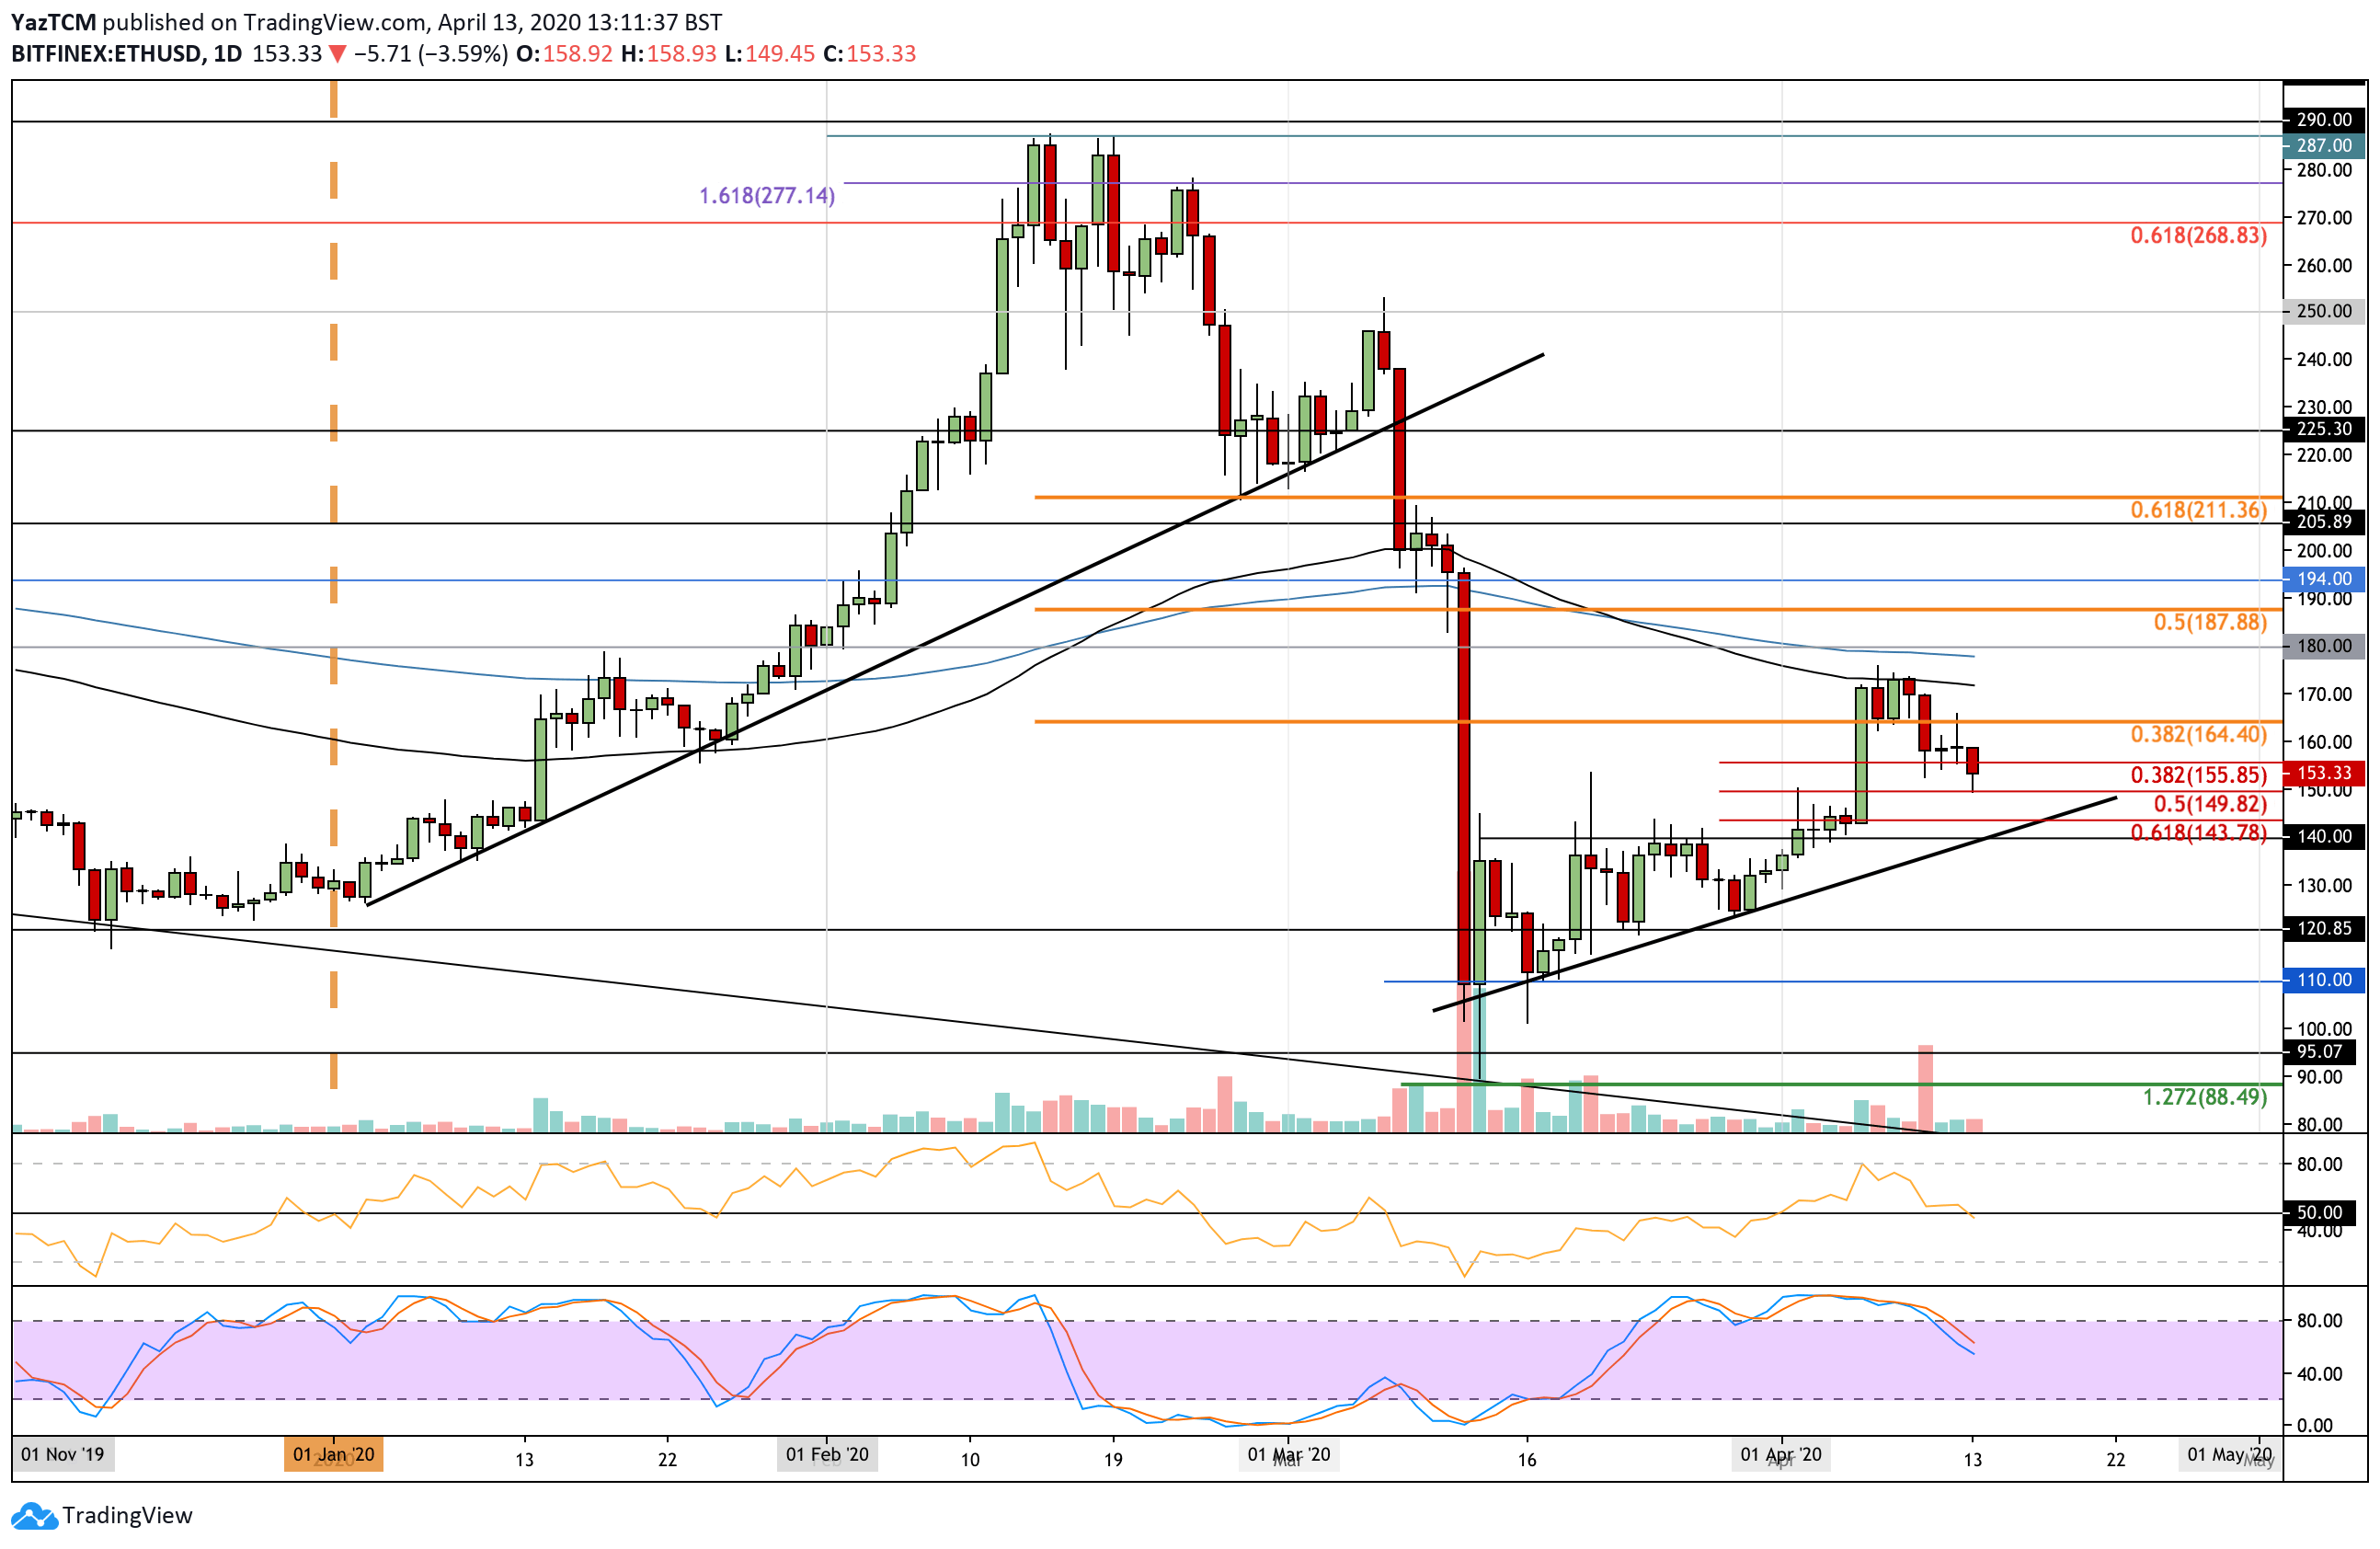
ETH/USD Short Term Price Prediction
If $150 breaks, added support lies at $144 (.618 Fib Retracement) and then at the rising support trend line. Beneath this, support can be found at $140, $130, and $120.
On the other side, if the bulls can rebound from $150, the first level of strong resistance lies at $165 (bearish .382 Fib Retracement). Above this, resistance lies at $170 (100-days EMA) and $180 (200-days EMA).
The RSI has dipped slightly beneath the 50 level as the sellers take control of the market momentum. If it continues lower, ETH is likely to break the $150 support. Additionally, the Stochastic RSI produced a bearish crossover signal to send the market downward.
ETH/BTC: Bulls Battle To Defend 0.0229 BTC.
Against Bitcoin, Ethereum struggled to climb above 0.0235 BTC this week, causing the cryptocurrency to roll over and reach the support at 0.0229 BTC, provided by a short term .236 Fib Retracement.
The buyers are battling to defend this area, but if they break beneath, ETH is likely to head below the 0.022 BTC level.
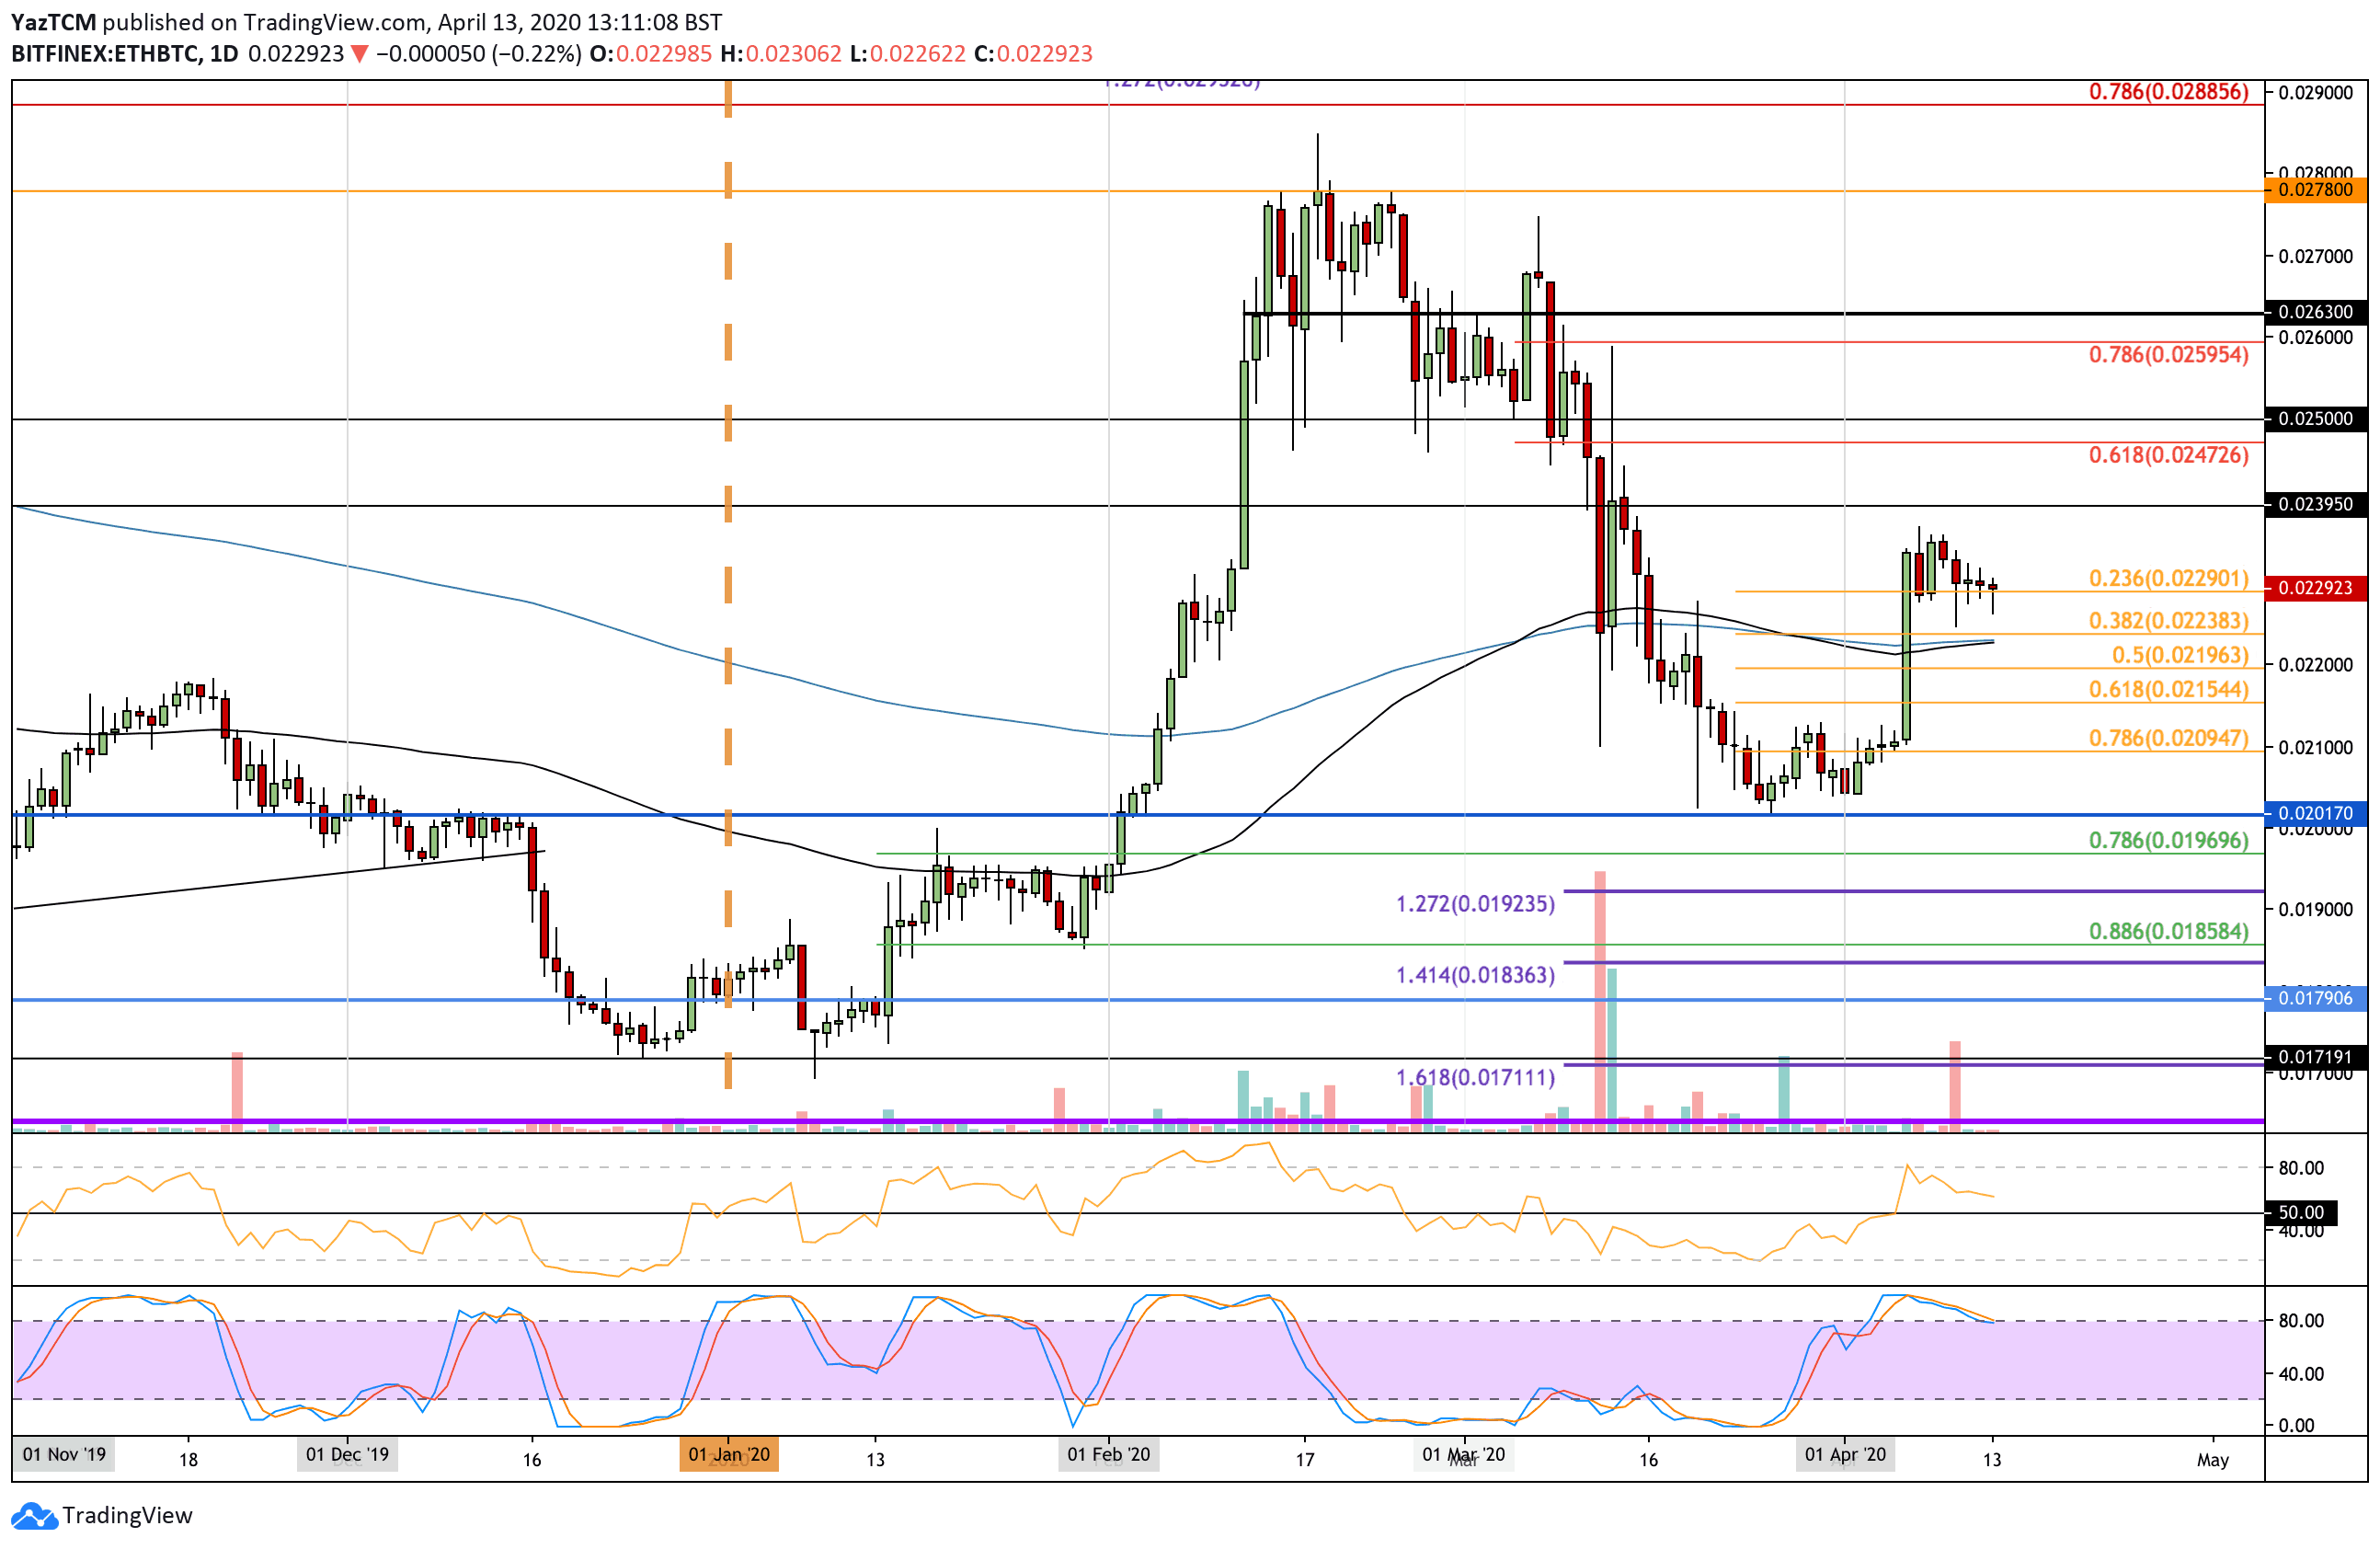
ETH/BTC Short Term Price Prediction
If the sellers push below 0.0229 BTC, initial support lies at 0.0223 BTC (.382 Fib Retracement). This is followed by strong support at 0.0222 BTC, where lies the 100-days and 200-days EMA levels. Beneath this, added support is located at 0.0219 BTC (.5 Fib Retracement).
Alternatively, if the bulls can rebound from 0.0229 BTC and push higher, the first level of resistance lies at 0.023 BTC. Above this, resistance is located at 0.0239 BTC, 0.0247 BTC (bearish .618 Fib Retracement), and 0.025 BTC.
The RSI remains above the 50 level, which shows that the buyers still are in control of the market momentum. If it can remain above 50, ETH can be expected to rebound soon and head toward 0.024 BTC.