Ethereum saw a small 3.5% price decline over the past 24 hours of trading as the cryptocurrency rolls over and drops beneath 0.Against BTC, ETH failed to breach the resistance at 0.0184 BTC causing it to reverse and drop quite aggressively into the 0.0175 BTC region.Ethereum remains ranked as the 2nd largest cryptocurrency with a market cap of .12 billion. It is still up by a total of 10% over the past fortnight.Key Support & Resistance LevelsETH/USDSupport: 3.50, 8, 0.Resistance: 5, 2, 8.ETH/BTC:Support: 0.0171 BTC, 0.0169 BTC, 0.0164 BTC.Resistance: 0.0175 BTC, 0.0185 BTC, 0.019 BTC.ETH/USD – ETH Rolls Over At 4 And Heads Lower Since our last analysis, ETH did not climb much higher from the 4 region as the market started to roll over and fall. This
Topics:
Yaz Sheikh considers the following as important: ETH Analysis, Ethereum (ETH) Price
This could be interesting, too:
Mandy Williams writes Ethereum Derivatives Metrics Signal Modest Downside Tail Risk Ahead: Nansen
CryptoVizArt writes Will Weak Momentum Drive ETH to .5K? (Ethereum Price Analysis)
Mandy Williams writes Ethereum Key Metrics Point to Persistent Bullish Outlook for ETH: CryptoQuant
CryptoVizArt writes Ethereum Price Analysis: Following a 15% Weekly Crash, What’s Next for ETH?
- Ethereum saw a small 3.5% price decline over the past 24 hours of trading as the cryptocurrency rolls over and drops beneath $140.
- Against BTC, ETH failed to breach the resistance at 0.0184 BTC causing it to reverse and drop quite aggressively into the 0.0175 BTC region.
- Ethereum remains ranked as the 2nd largest cryptocurrency with a market cap of $15.12 billion. It is still up by a total of 10% over the past fortnight.
Key Support & Resistance Levels
ETH/USD
Support: $133.50, $128, $120.
Resistance: $145, $152, $158.
ETH/BTC:
Support: 0.0171 BTC, 0.0169 BTC, 0.0164 BTC.
Resistance: 0.0175 BTC, 0.0185 BTC, 0.019 BTC.
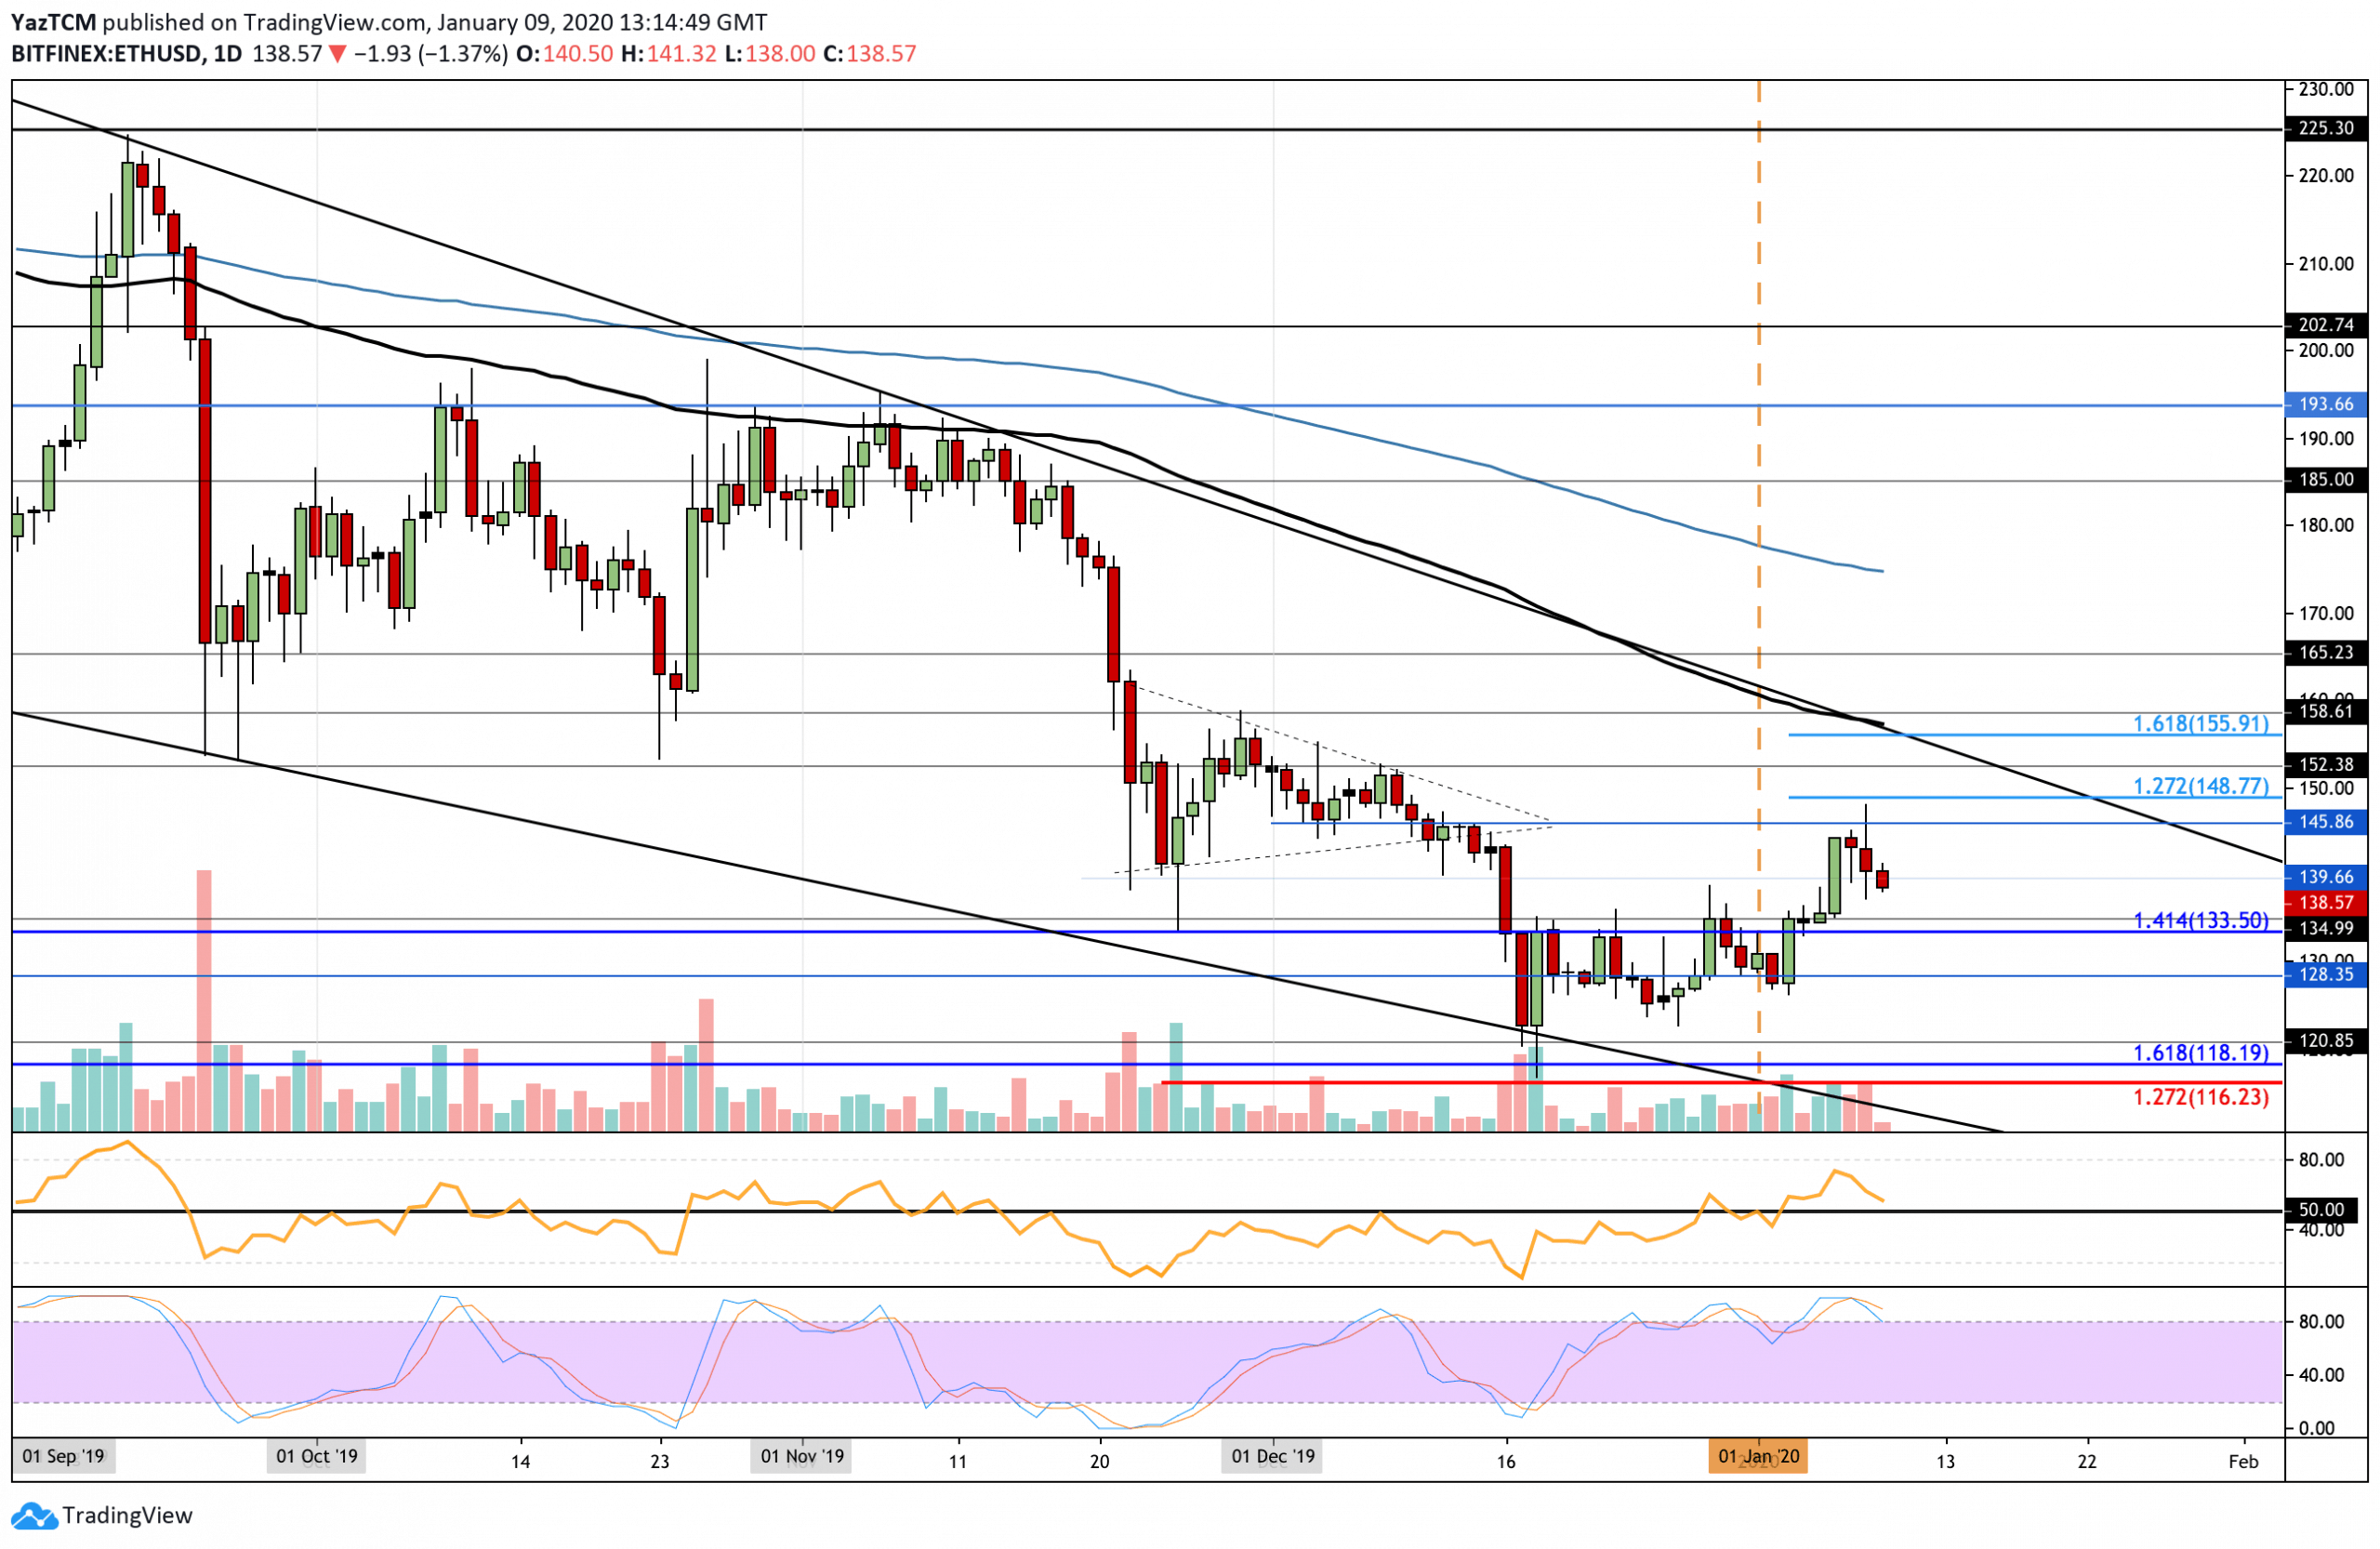
ETH/USD – ETH Rolls Over At $144 And Heads Lower
Since our last analysis, ETH did not climb much higher from the $144 region as the market started to roll over and fall. This decrease is largely attributed to the fact that ETH/BTC plummeted pretty significantly, by a total of 6%, over the past three days.
Etheruem remains in a neutral market until it can rise higher and break above the December highs at around $152. If ETH was to fall and drop beneath the support at $120, the coin would turn bearish.
Ethereum Short Term Price Prediction
If the sellers continue to add downward pressure to ETH, initial support is expected at $133.50. Beneath this, support can be found at $130 and $120. On the other hand, if the bulls can defend the $133.50 region and allow ETH to rebound, an initial resistance is located at $144. Above this, additional resistance is expected at $148 and $155.
The RSI has been falling toward the 50 level which shows that the previous bullish momentum is starting to fade. If the RSI manages to remain above the 50 level then the bulls stand a chance to allow Ethereum to rebound at $133.50. However, if it penetrates beneath, the cryptocurrency may start a downward spiral. Furthermore, the Stochastic RSI has produced a bearish crossover signal that could be sending the market lower.
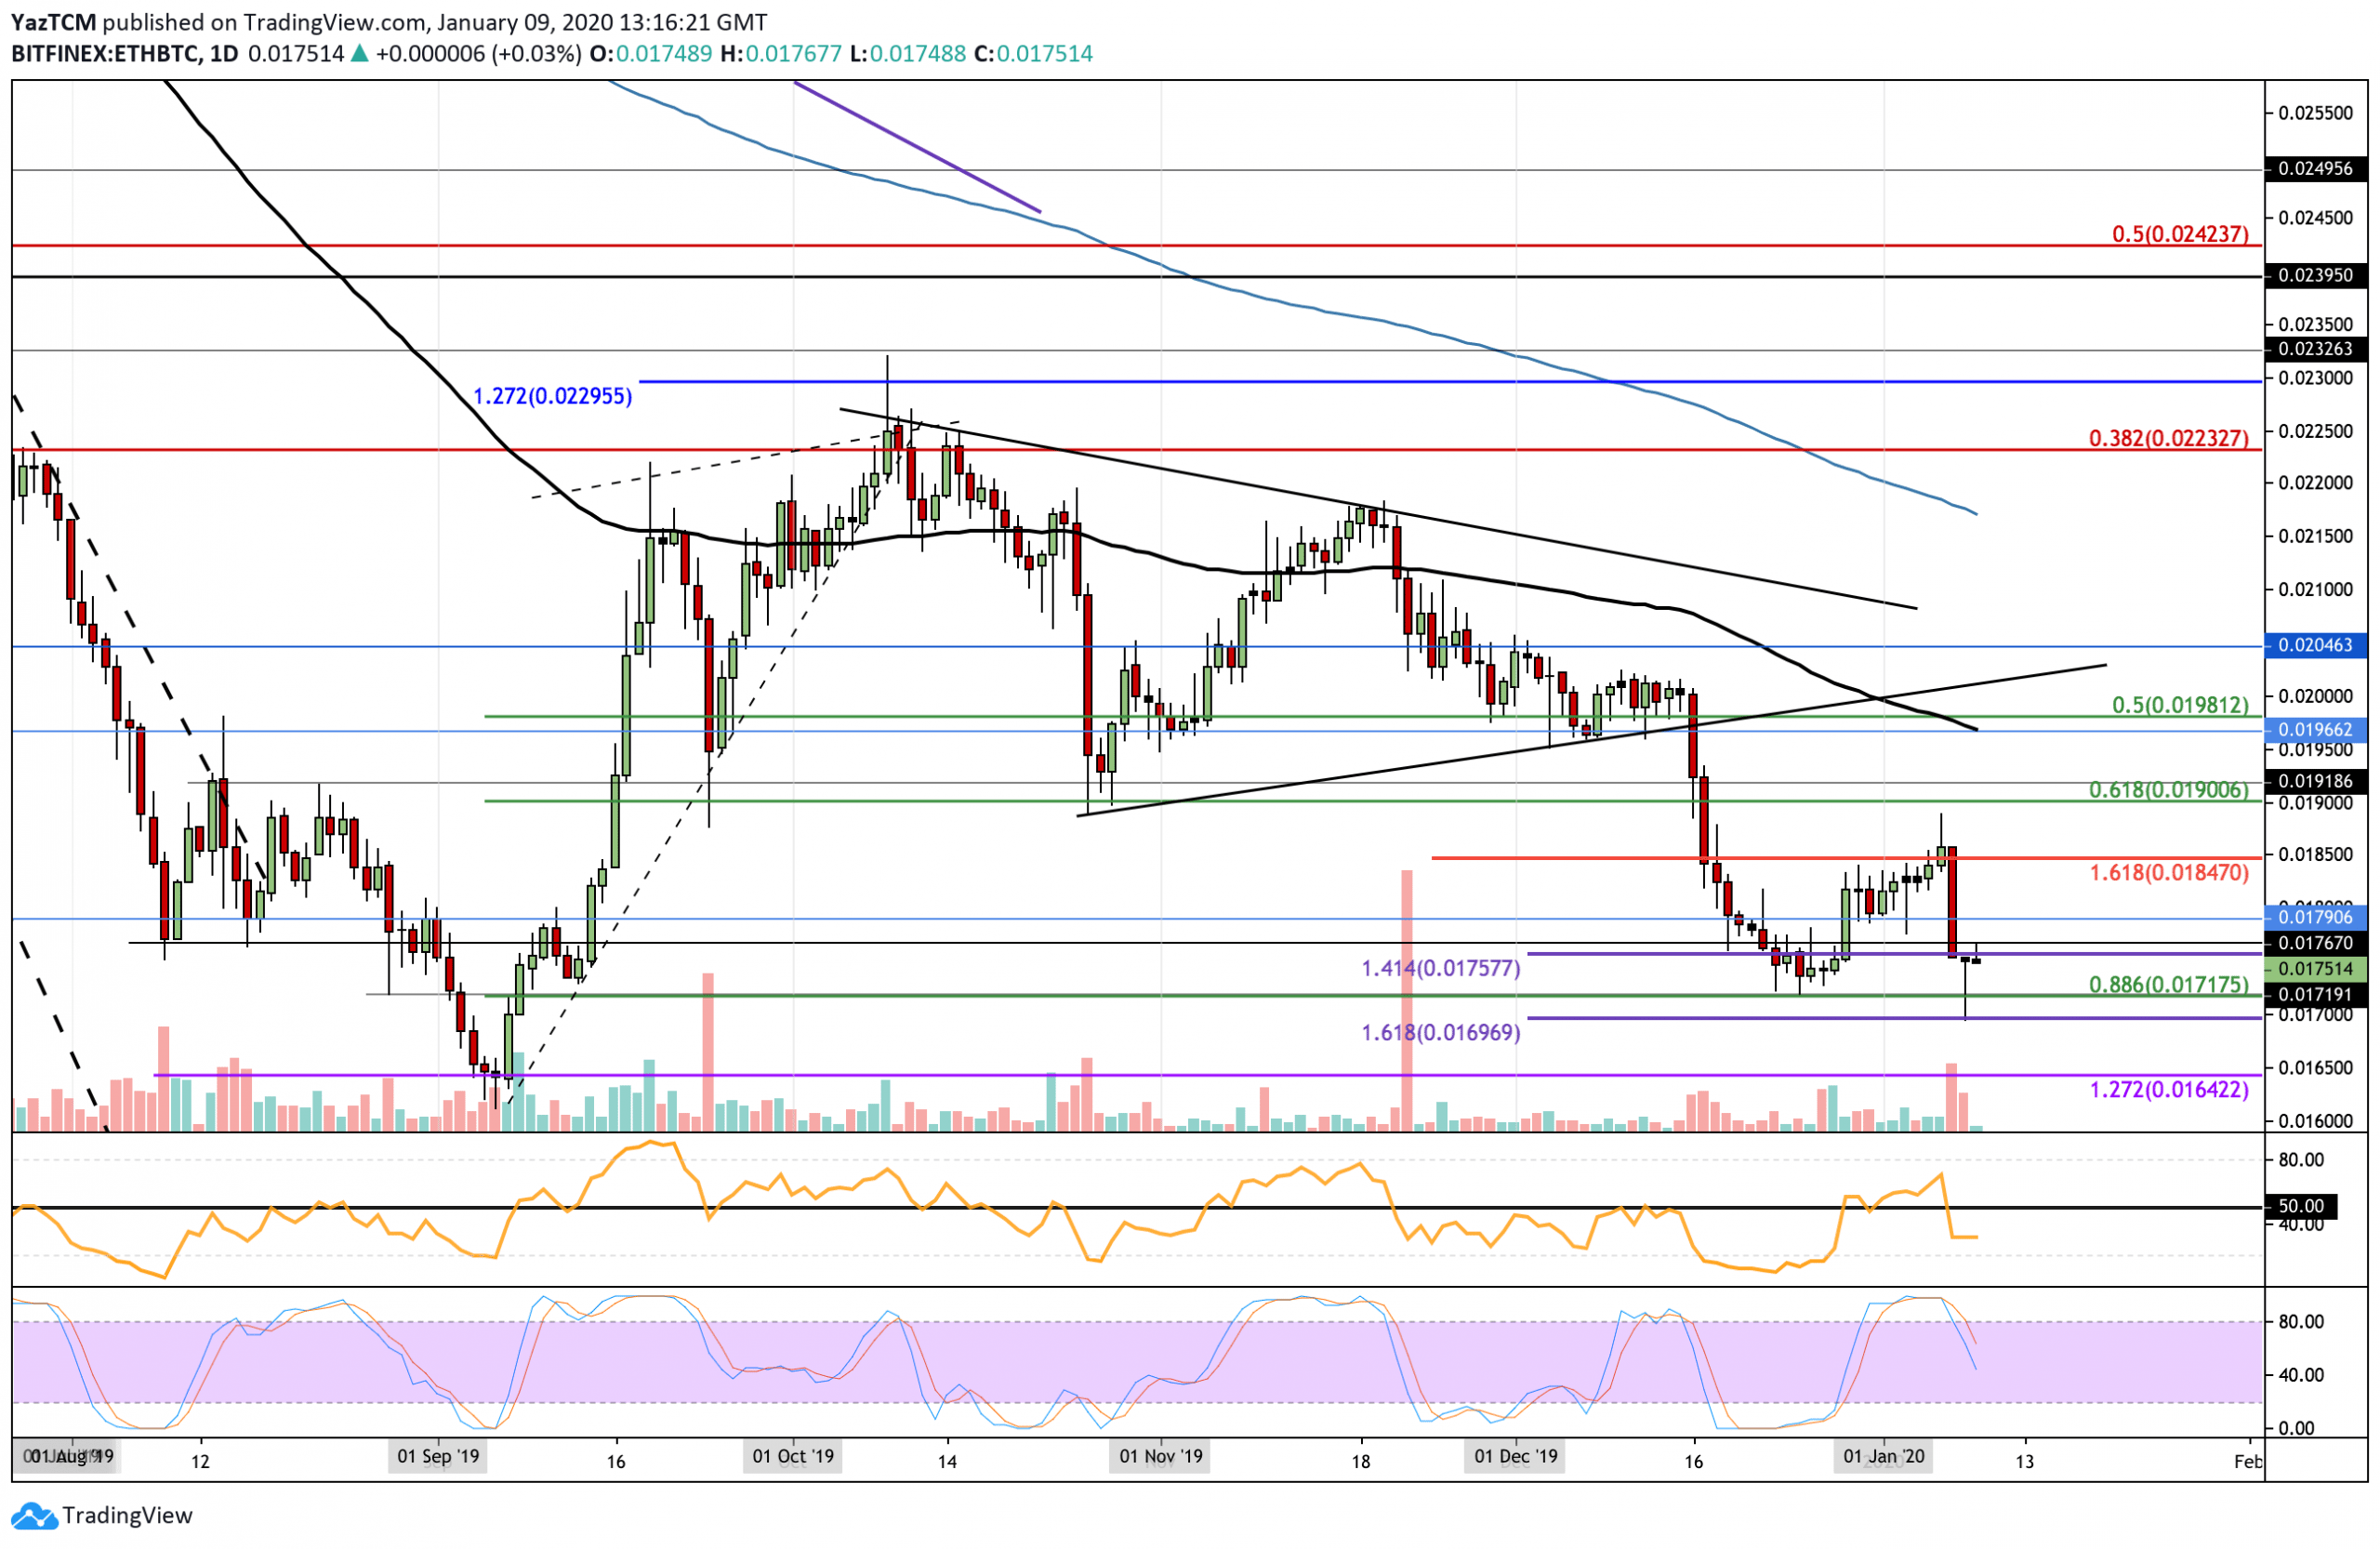
Against Bitcoin, ETH stalled as it reached the resistance around 0.0188 BTC, causing it to roll over and fall. The following trading day after our previous analysis, ETH plummetted precipitously as it dumped into the support at 0.0175 BTC. The pain did not stop there as ETH continued to fall further lower to reach the downside 1.618 Fib Extension at 0.0169 BTC. Ethereum bounced higher from here and returned to the 0.0175 BTC level.
ETH remains in a neutral market condition as it managed to rebound higher above the 0.0171 BTC level. However, if it drops back beneath 0.0171 BTC then the market would have to be considered as bearish. To turn bullish, ETH must rise much higher and break above the 0.02 BTC level.
Ethereum Short Term Price Prediction
If the bears continue to push ETH/BTC lower, initial support is located at 0.0172 BTC (.886 Fib Retracement) and 0.0169 BTC (downside 1.618 Fib Extension). Beneath this, additional support is found at 0.0164 BTC. Alternatively, if the bulls can regroup and bring ETH above 0.0175 BTC, higher resistance is expected at 0.018 BTC. Above this, resistance lies at 0.0185 BTC, 0.019 BTC, and 0.0196 BTC (100-days EMA).
The RSI plummetted beneath the 50 level to show that the bears are now in charge of the market momentum. For a bullish revival, the RSI must start to rise and break back above 50. Furthermore, the Stochastic RSI recently produced a bearish crossover signal that helped to send the market lower.


