ETH bulls penetrated above a symmetrical triangle pattern, as the price rose from 0 to over 0 as of writing these lines.Against Bitcoin, ETH rebounded from the 0.0329 BTC support to resistance at 0.0361 BTC, which is the current daily high.ETH/USD – Ethereum Penetrated Above The Symmetrical TriangleKey Support Levels: 4, 0, 0.Key Resistance Levels: 0, 0, 0.After finding support at the 4 level over the past week, Ethereum was forced into a short period of consolidation as it moved sideways within a symmetrical triangle pattern. Yesterday, ETH managed to break above this formation as it broke out upside.The 4-hour chart below shows this break of the triangle pattern:ETH/USD 4HR Chart. Source: TradingViewToday, ETH surged by 7% (so far), which allowed it to climb
Topics:
Yaz Sheikh considers the following as important: ETH Analysis, ETHBTC, Ethereum (ETH) Price, ethusd
This could be interesting, too:
Mandy Williams writes Ethereum Derivatives Metrics Signal Modest Downside Tail Risk Ahead: Nansen
Jordan Lyanchev writes Weekly Bitcoin, Ethereum ETF Recap: Light at the End of the Tunnel for BTC
CryptoVizArt writes Will Weak Momentum Drive ETH to .5K? (Ethereum Price Analysis)
Jordan Lyanchev writes Bybit Hack Fallout: Arthur Hayes, Samson Mow Push for Ethereum Rollback
- ETH bulls penetrated above a symmetrical triangle pattern, as the price rose from $350 to over $370 as of writing these lines.
- Against Bitcoin, ETH rebounded from the 0.0329 BTC support to resistance at 0.0361 BTC, which is the current daily high.
ETH/USD – Ethereum Penetrated Above The Symmetrical Triangle
Key Support Levels: $364, $350, $340.
Key Resistance Levels: $380, $400, $410.
After finding support at the $324 level over the past week, Ethereum was forced into a short period of consolidation as it moved sideways within a symmetrical triangle pattern. Yesterday, ETH managed to break above this formation as it broke out upside.
The 4-hour chart below shows this break of the triangle pattern:

Today, ETH surged by 7% (so far), which allowed it to climb above the previous 2019 high at $364 to reach the above the $370 level.
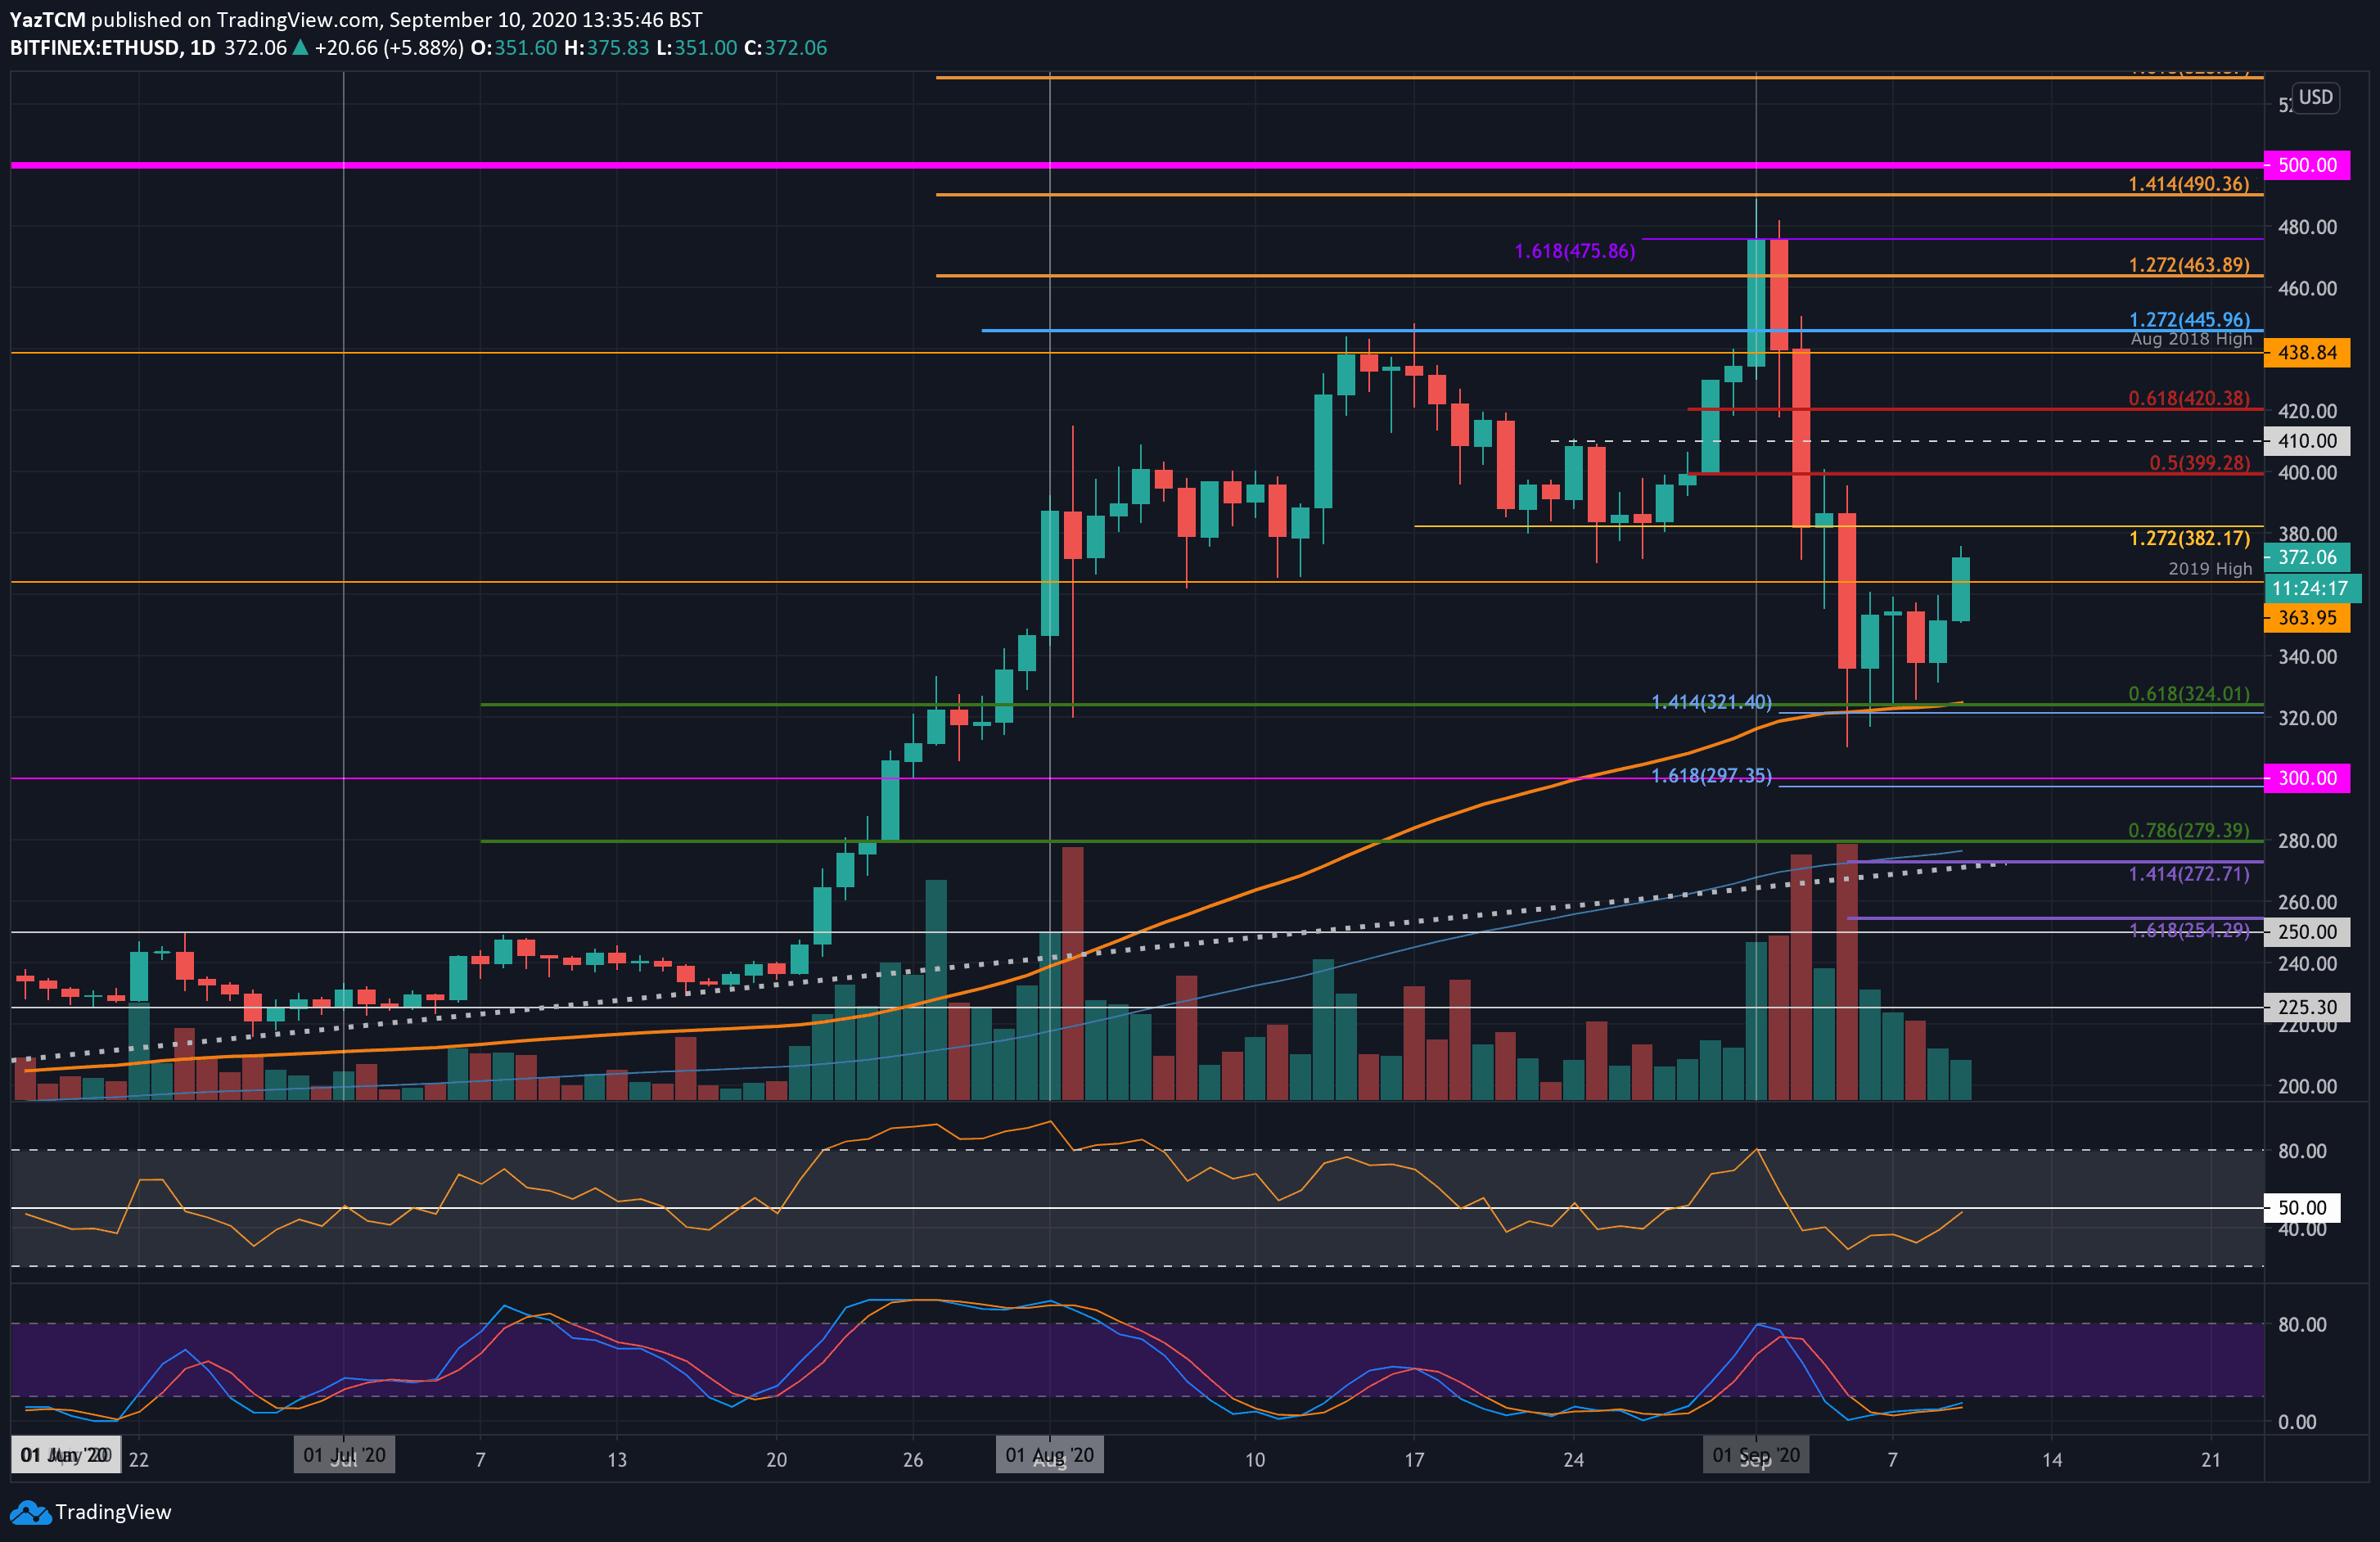
ETH-USD Short Term Price Prediction
Looking ahead, from the above 4HR chart, the first level of resistance lies at $380 (bearish .382 Fib Retracement). Above this, resistance is expected at $400 (bearish .5 Fib Retracement), $410, and $420 (bearish .618 Fib Retracement).
On the other side, the first level of support lies at the 2019 high at $364. Beneath, support lies at $350, $340, and $324 (.618 Fib Retracement & 100-days EMA).
The RSI is about to break above the 50 line on the daily chart, which will indicate that the bulls are taking control of the market momentum. Additionally, a Stochastic RSI bullish crossover signal could send the market even higher in the short-term.
ETH/BTC – Bulls Finally Bounce From 0.5 Fib Retracement Level
Key Support Levels: 0.0352 BTC, 0.0347 BTC, 0.0337 BTC.
Key Resistance Levels: 0.0361 BTC, 0.037 BTC, 0.0376 BTC.
Ethereum price dropped from the 0.04 BTC level at the start of September to reach the support at 0.0329 BTC (.5 Fib Retracement). The buyers defended this support for five days but had difficulties in breaking above resistance at 0.0352 BTC.
Today, the bulls managed to penetrate above 0.0352 BTC as they pushed into the current 0.0358 BTC level. They are now facing resistance at 0.0361 BTC provided by the March 2019 highs.
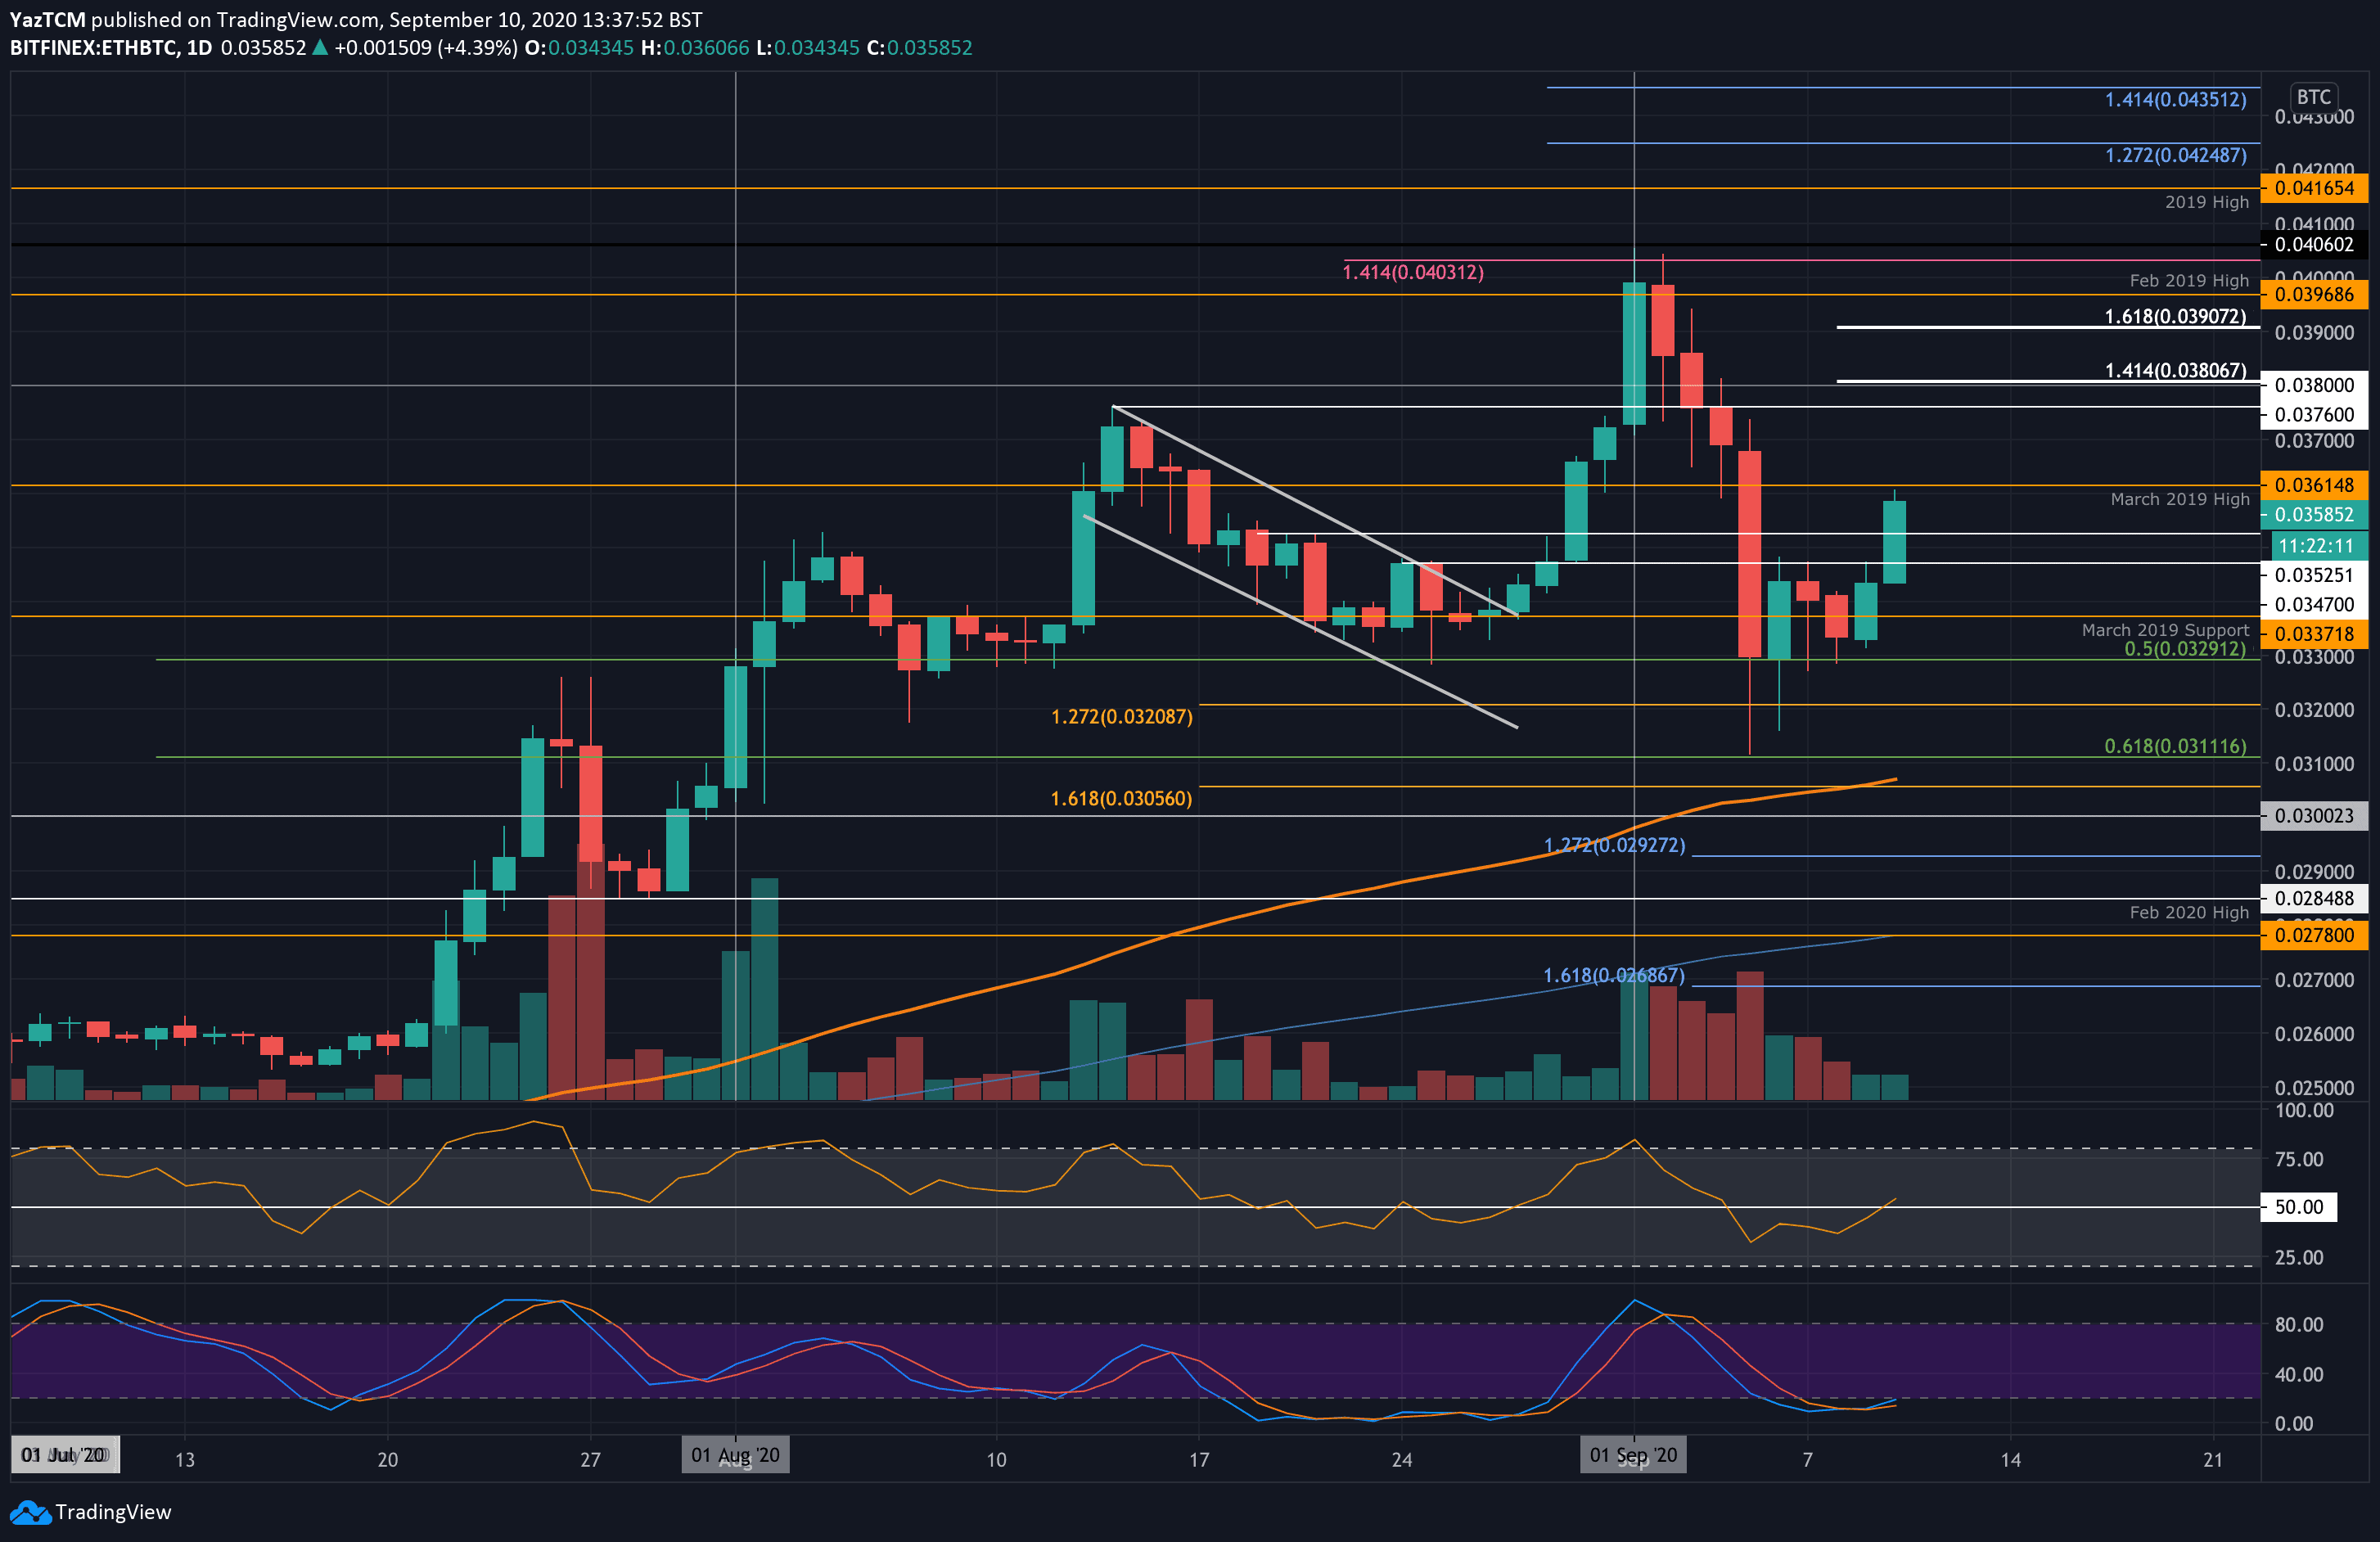
ETH-BTC Short Term Price Prediction
Looking ahead, if the buyers break beyond 0.0361 BTC, resistance lies at 0.037 BTC, 0.0376 BTC, and 0.038 BTC. Additional resistance lies at 0.039 BTC and 0.04 BTC – which is the area of the current 2020 high.
On the other side, the first level of support lies at 0.0352 BTC. This is followed by support at 0.0347 BTC, 0.0337 BTC, and 0.0329 BTC (.5 Fib Retracement).
Likewise, the RSI has poked above the mid-line in this market to indicate that the buyers are taking back control of the market momentum.