Litecoin dropped by a steep 15.5% over the past 7-days of trading as it falls to .The latest price decline has brought it beneath both the 200-days and 100-days EMAs.Against Bitcoin, Litecoin has also dropped in to support at the 100-days EMA.Key Support & Resistance LevelsLTC/USD:Support: , .50, Resistance: , , LTC/BTC:Support: 0.0067 BTC, 0.0065 BTC, 0.0063 BTC.Resistance: 0.00711 BTC, 0.0074 BTC, 0.0076 BTC.LTC/USD: Litecoin Drops Beneath 100-days EMAThe daily chart shows Litecoin reaching the 2020 high at .50 during mid-February and rolling over to reverse. It then went on to drop lower and, after a brief attempt to break up above at the start of this week, it stalled and collapsed by around 24% over the past four days.The price decline caused Litecoin to
Topics:
Yaz Sheikh considers the following as important: Litecoin (LTC) Price, Price Analysis
This could be interesting, too:
Chayanika Deka writes Bitcoin Ends Week with 5M Inflows as Multi-Asset Products Face 1M in Losses
Chayanika Deka writes Litecoin Network Activity Surges, Reaching 401,000 Daily Active Addresses
CryptoVizArt writes ETH’s Path to K Involves Maintaining This Critical Support (Ethereum Price Analysis)
Chayanika Deka writes Small Litecoin (LTC) Fishes Are ‘Jumping Ship,’ Here’s What it Means
- Litecoin dropped by a steep 15.5% over the past 7-days of trading as it falls to $61.
- The latest price decline has brought it beneath both the 200-days and 100-days EMAs.
- Against Bitcoin, Litecoin has also dropped in to support at the 100-days EMA.
Key Support & Resistance Levels
LTC/USD:
Support: $58, $56.50, $54
Resistance: $63, $68, $71
LTC/BTC:
Support: 0.0067 BTC, 0.0065 BTC, 0.0063 BTC.
Resistance: 0.00711 BTC, 0.0074 BTC, 0.0076 BTC.
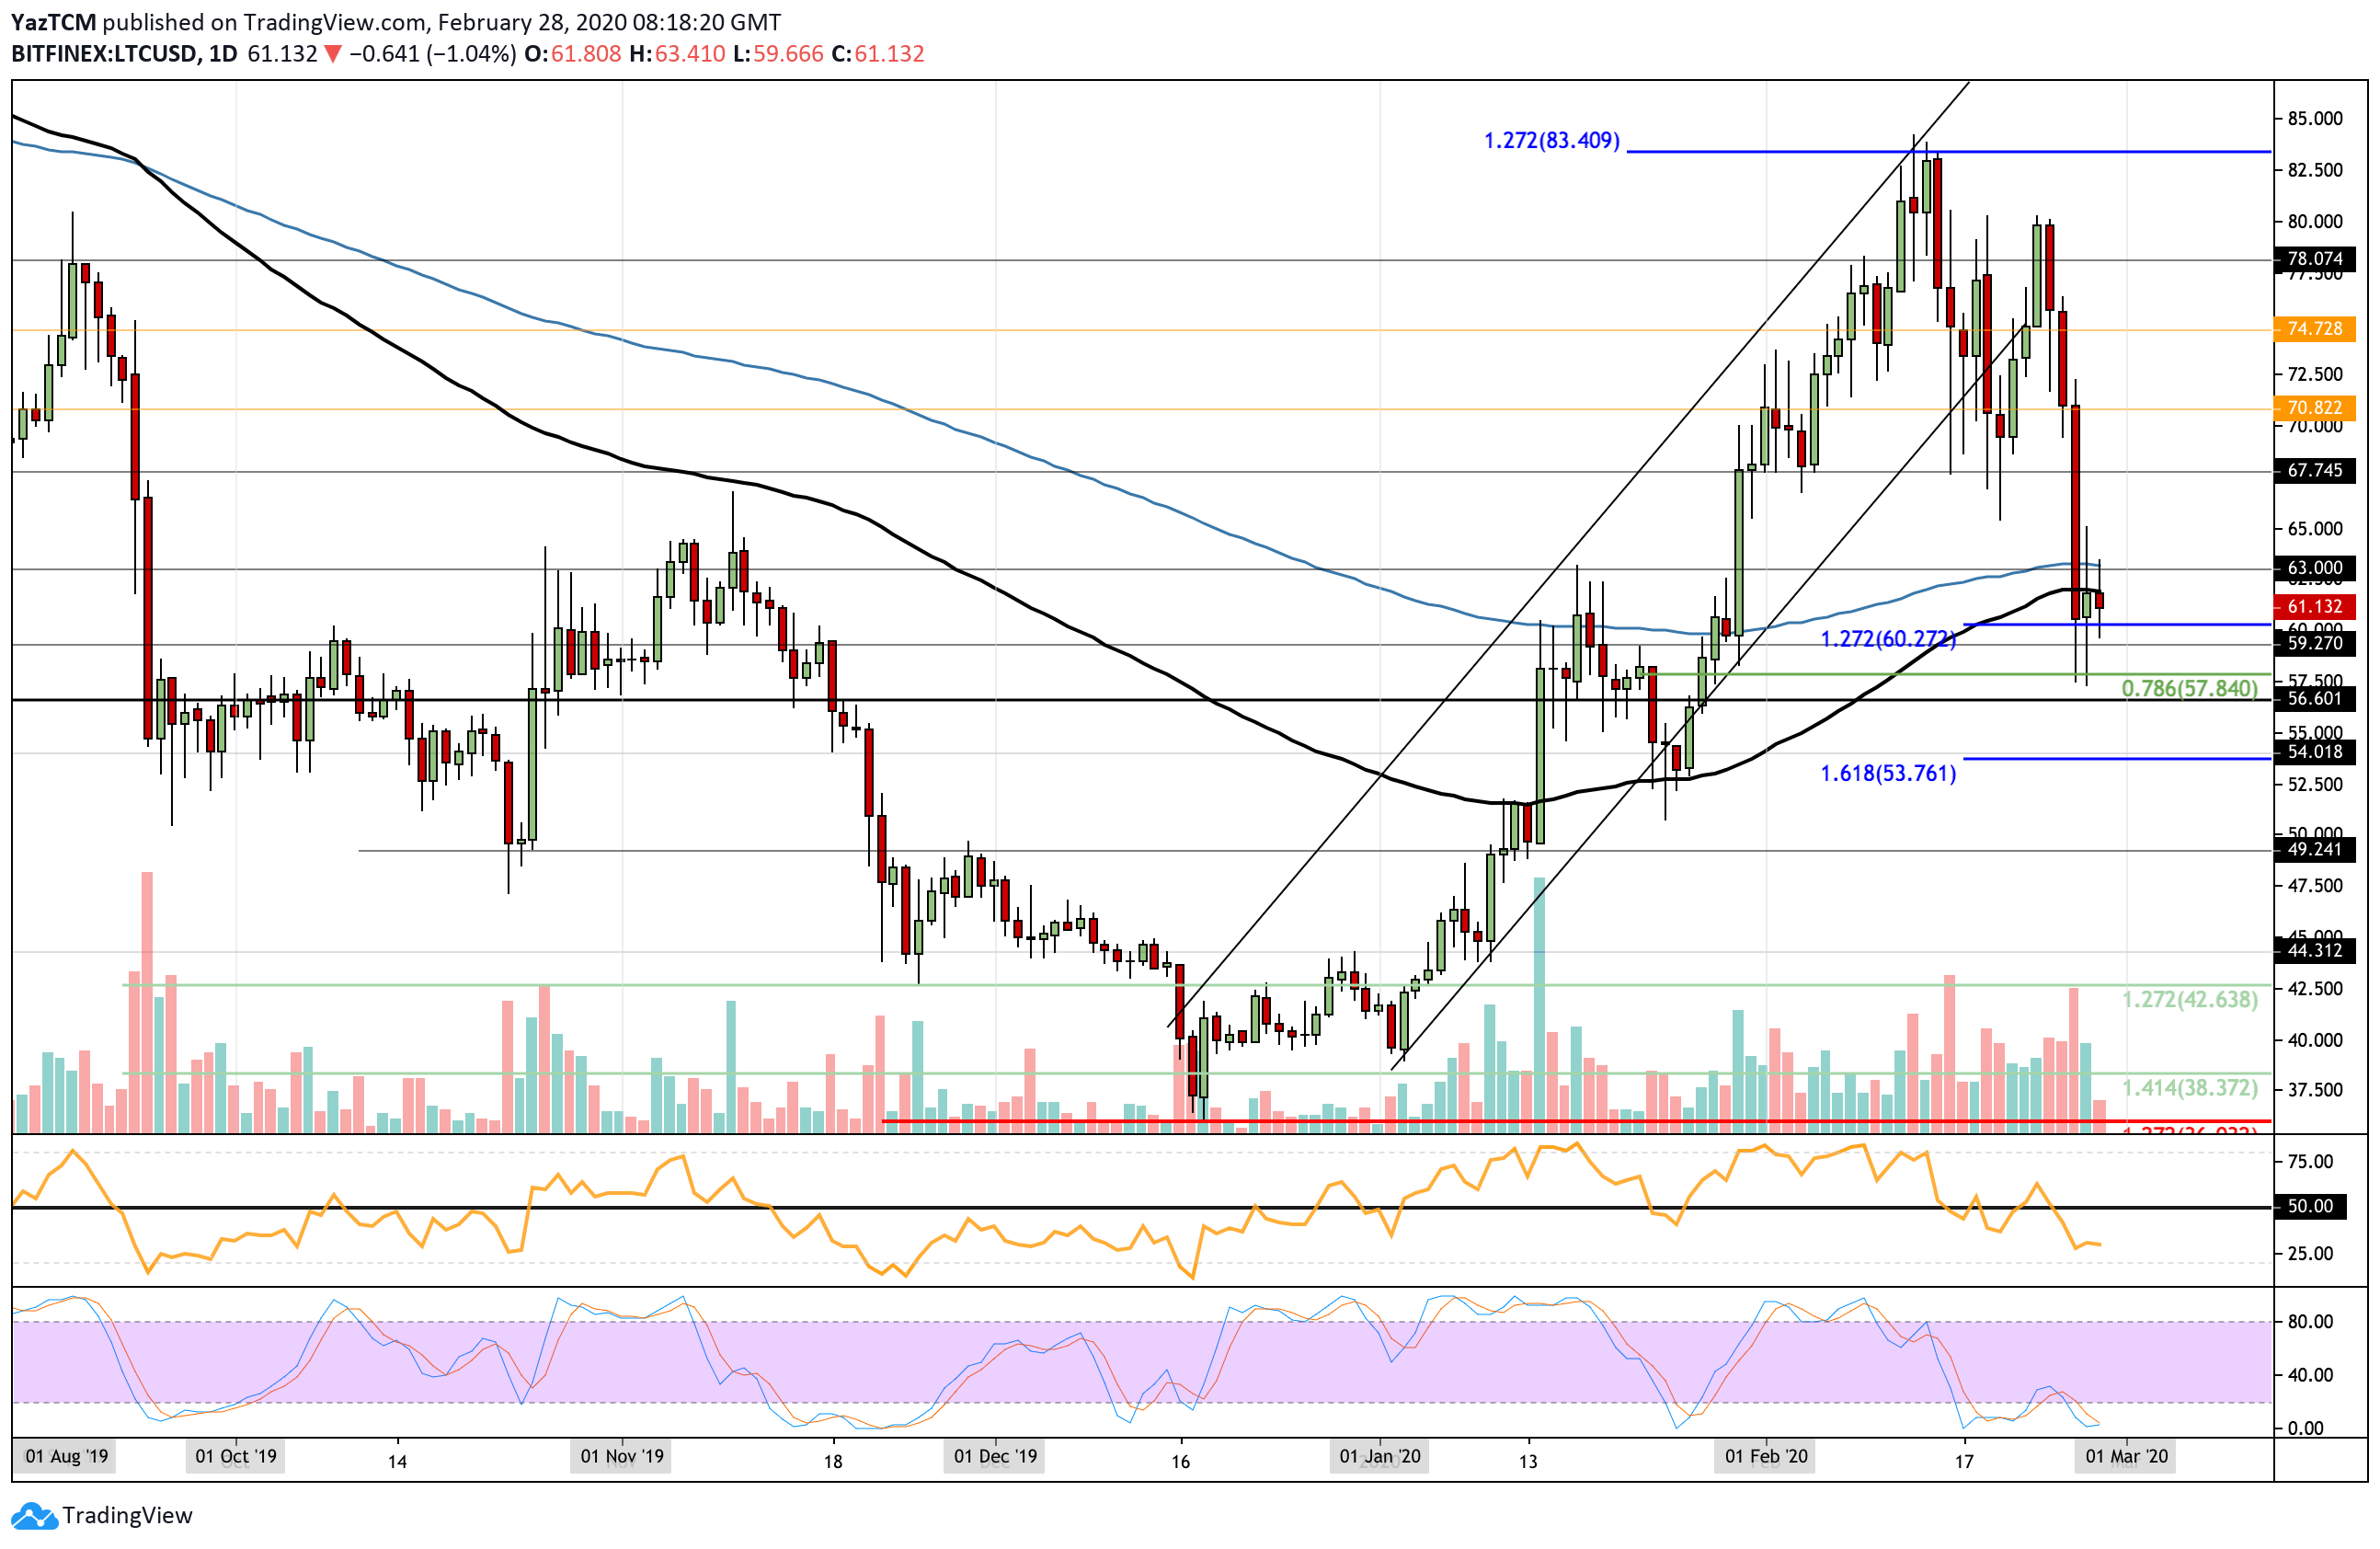
LTC/USD: Litecoin Drops Beneath 100-days EMA
The daily chart shows Litecoin reaching the 2020 high at $83.50 during mid-February and rolling over to reverse. It then went on to drop lower and, after a brief attempt to break up above $80 at the start of this week, it stalled and collapsed by around 24% over the past four days.
The price decline caused Litecoin to also break beneath significant support at the 200-days and 100-days EMAs as it stalls at $60, which is the support provided by a downside 1.272 Fibonacci Extension level.
A break beneath $60 is likely to put Litecoin in danger of turning bearish over the short term.
Litecoin Short Term Price Prediction
If the sellers break $60, support is found at $58 (.786 Fib Retracement), $56.50, $54, and $50.
On the other hand, if the buyers bounce higher, resistance lies at $63, $68, $71, and $75.
The RSI is beneath the 50 level to show the bearish momentum within the market. However, it is currently attempting to stabilize as it starts to move sideways. A bullish crossover signal from the Stochastic RSI will indicate that the buyers are ready to attempt to push higher again.
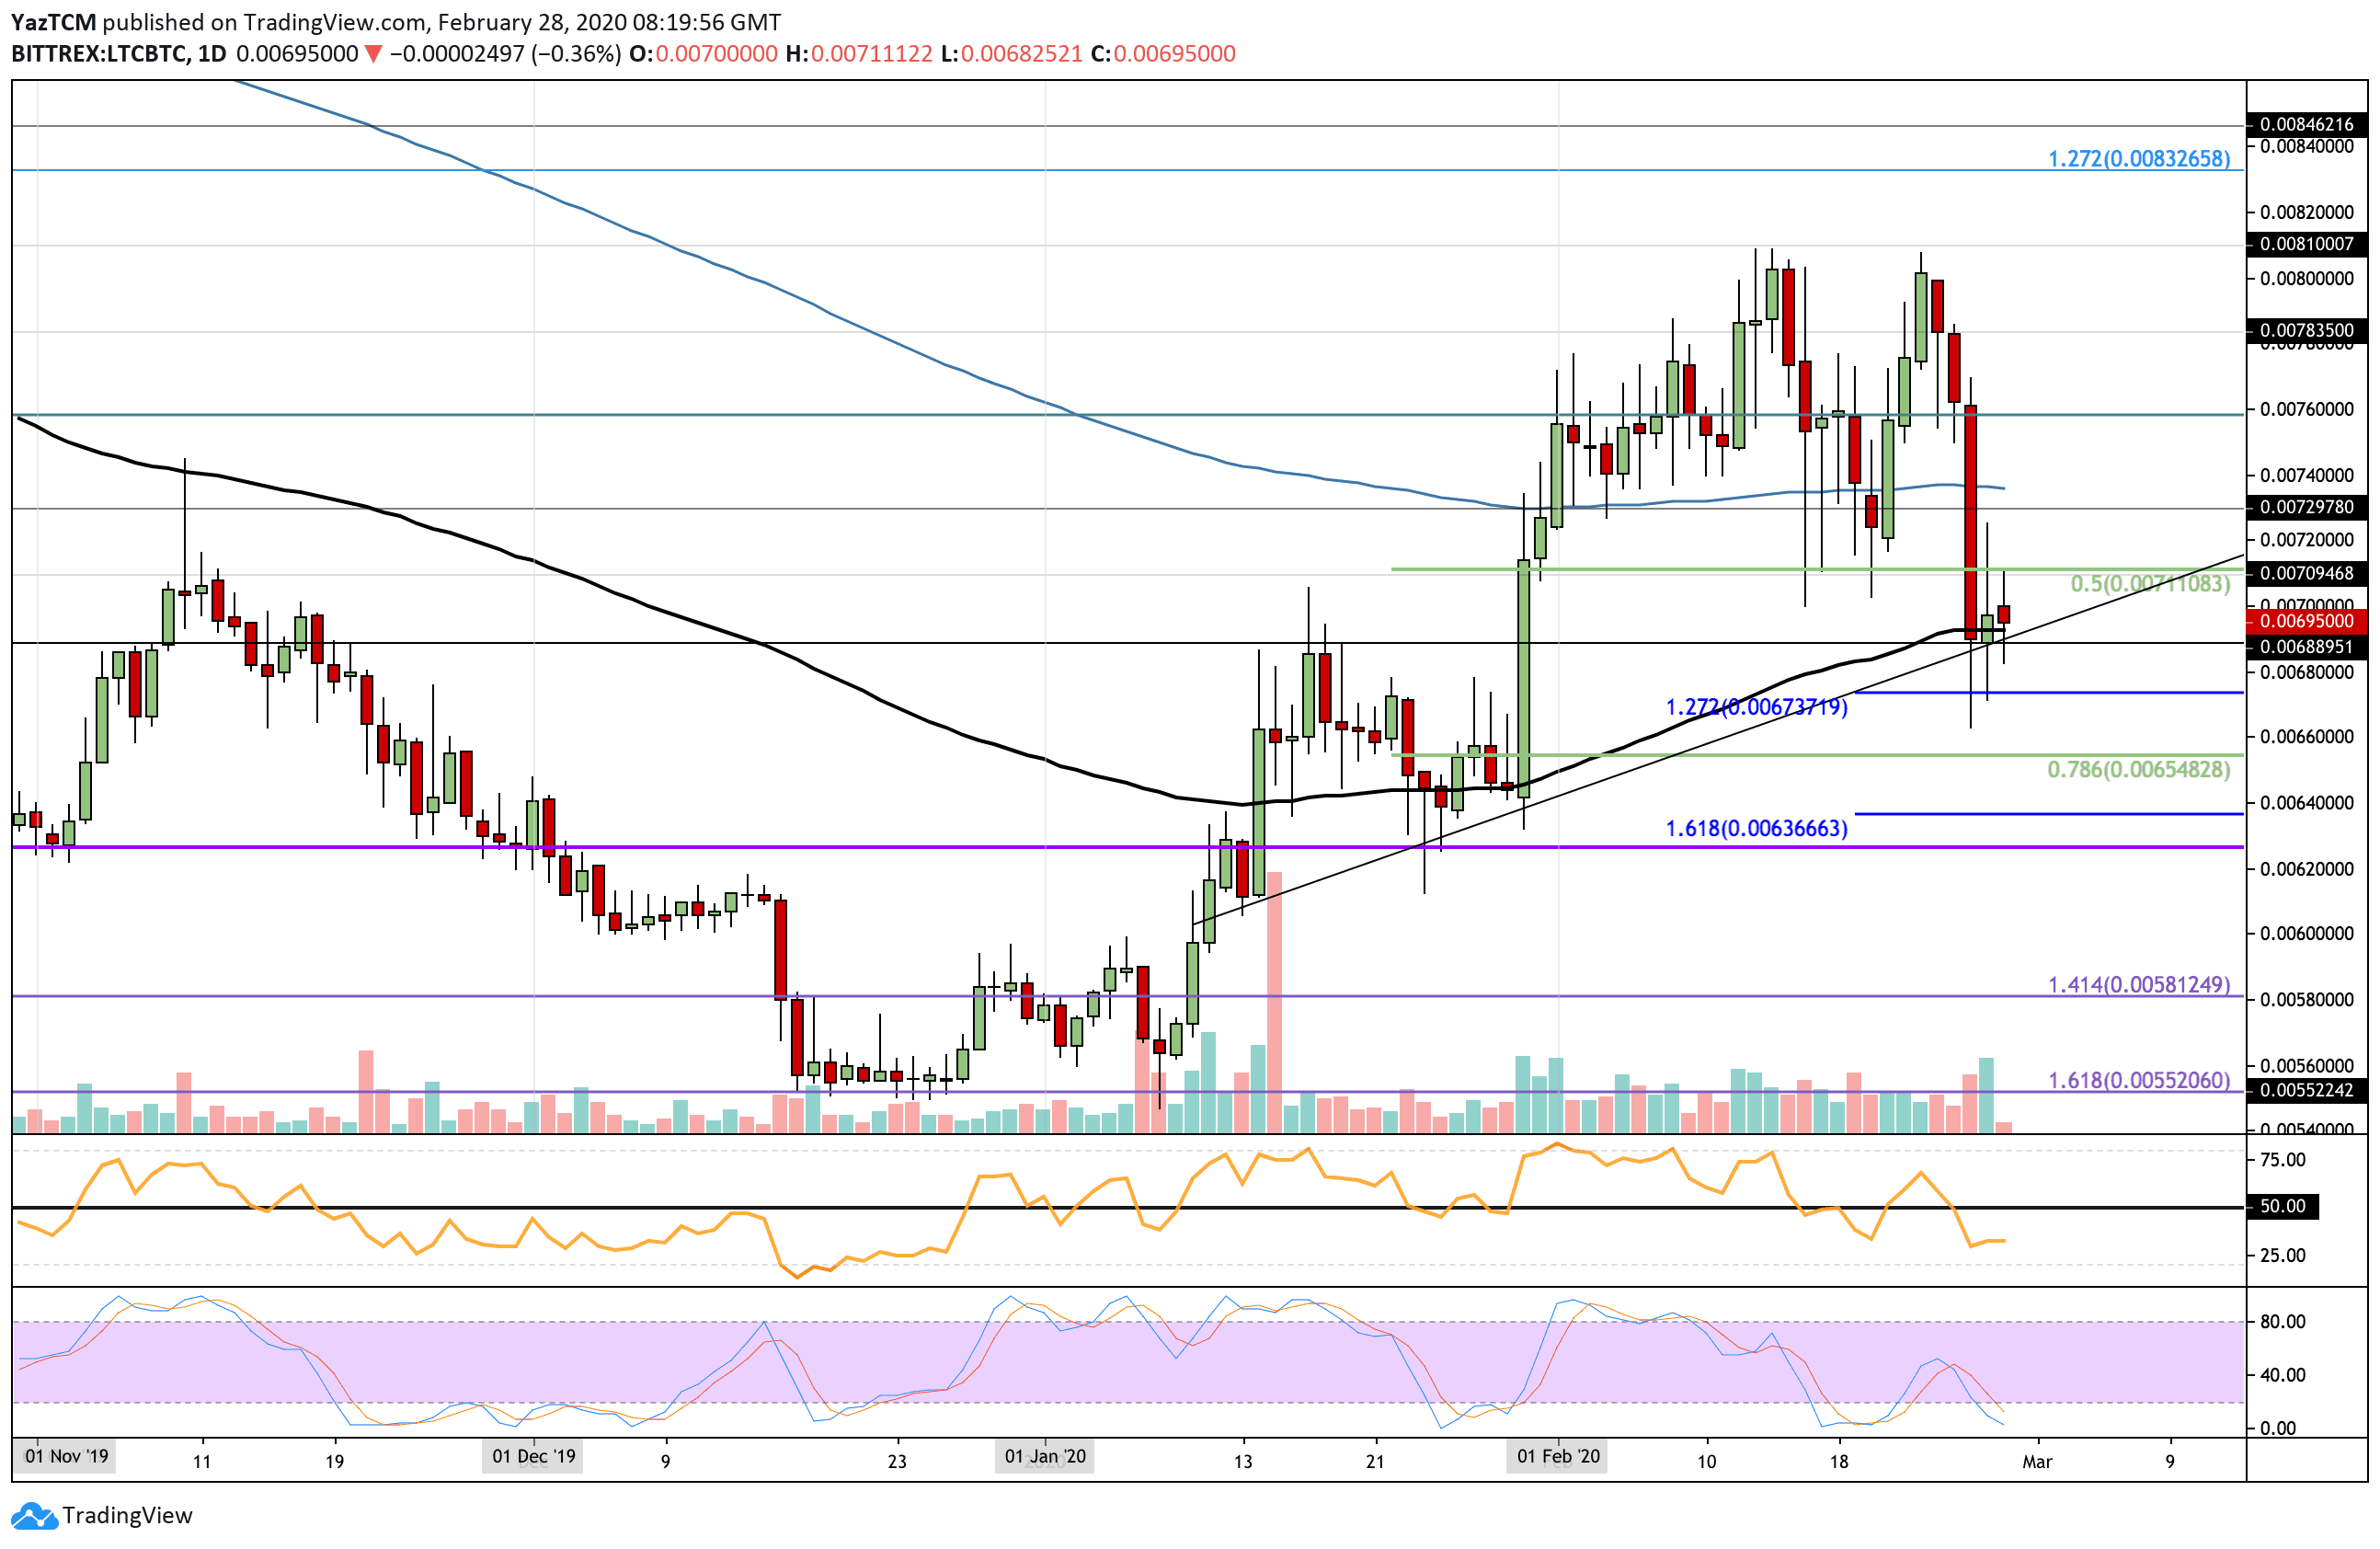
LTC/BTC: Litecoin Finds Support At Rising Trend Line
Against Bitcoin, LTC was unable to overcome resistance at 0.0081 BTC, which caused it to roll over and fall. The cryptocurrency then went on to drop further lower as it broke beneath the 200-days EMA to find support slightly beneath the 100-days EMA at 0.00688 BTC.
It is currently attempting to bounce higher but is finding strong resistance at 0.007 BTC. A break beneath 0.0068 BTC is likely to send Litecoin further lower toward the 0.006 BTC level.
Litecoin Short Term Price Prediction
The first level of resistance for the bulls to break is at 0.00711 BTC. Above this, resistance lies at 0.0074 BTC (200-days EMA), and 0.0076 BTC.
On the other hand, if the sellers push back beneath the 100-days EMA and the rising trend line at 0.0069 BTC, support can be found at 0.0067 BTC, provided by a downside 1.272 Fib Extension. Beneath this, support lies at 0.0065 BTC (.786 Fib Retracement) and 0.00636 BTC (downside 1.618 Fib Extension).
Similarly, the RSI is showing signs that the sellers may be retreating from the market as it moves sideways to stabilize. It would still need to rise and break above the 50 level to confirm that they have indeed left the market.
The Stochastic RSI is still pretty far from being above to produce a bullish crossover signal here, which suggests that more selling pressure may be on the way.