XRP saw a strong 23.5% increase this week as it climbed as high as %excerpt%.321.The coin has dropped slightly as it trades at %excerpt%.30.Against Bitcoin, XRP reached as high as 2800 SAT before falling into the 2555 SAT support.XRP/USD: XRP Bulls Find Resistance at Bearish .886 Fib RetracementKey Support Levels: %excerpt%.3, %excerpt%.291, %excerpt%.28.Key Resistance Levels: %excerpt%.313, %excerpt%.321, %excerpt%.331.XRP saw a massive push this week as it surged above %excerpt%.3 to reach as high as %excerpt%.321 (bearish .886 Fib Retracement). More specifically, the bulls were unable to close above %excerpt%.31 (1.414 Fib Extension), which caused the coin to head into the %excerpt%.30 support today.The price hike this week put XRP back onto the positive footing as it created a fresh 6-month high. It would now have to drop beneath %excerpt%.215 (200-days EMA) before being in
Topics:
Yaz Sheikh considers the following as important: Ripple (XRP) Price, XRP Analysis, xrpbtc, xrpusd
This could be interesting, too:
Jordan Lyanchev writes Ripple’s (XRP) Surge to Triggers Over Million in Short Liquidations
Jordan Lyanchev writes Trump Confirms Work on Strategic Crypto Reserve: XRP, ADA, SOL Included
Dimitar Dzhondzhorov writes Is a Major Ripple v. SEC Lawsuit Development Expected This Week? Here’s Why
Mandy Williams writes Ripple Releases Institutional DeFi Roadmap for XRP Ledger in 2025
- XRP saw a strong 23.5% increase this week as it climbed as high as $0.321.
- The coin has dropped slightly as it trades at $0.30.
- Against Bitcoin, XRP reached as high as 2800 SAT before falling into the 2555 SAT support.
XRP/USD: XRP Bulls Find Resistance at Bearish .886 Fib Retracement
Key Support Levels: $0.3, $0.291, $0.28.
Key Resistance Levels: $0.313, $0.321, $0.331.
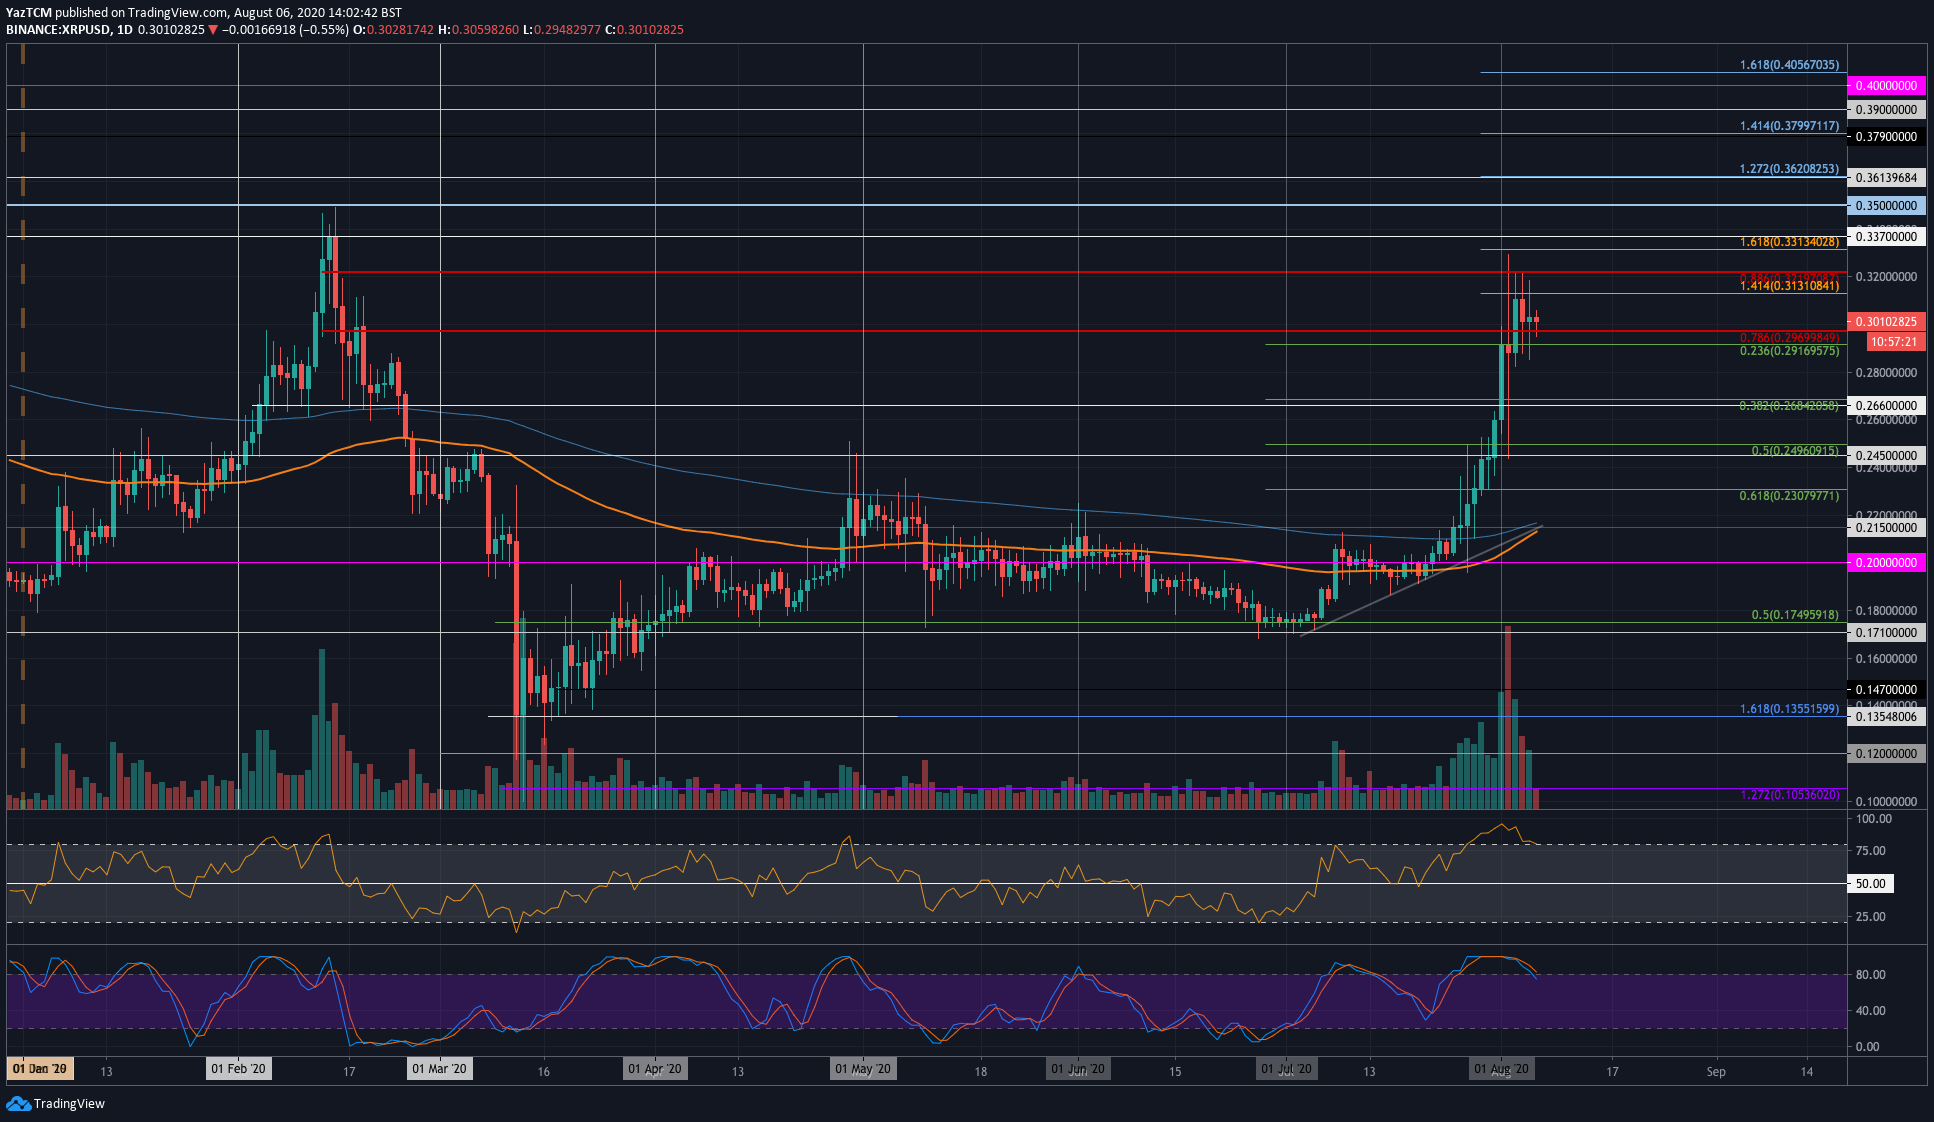
XRP saw a massive push this week as it surged above $0.3 to reach as high as $0.321 (bearish .886 Fib Retracement). More specifically, the bulls were unable to close above $0.31 (1.414 Fib Extension), which caused the coin to head into the $0.30 support today.
The price hike this week put XRP back onto the positive footing as it created a fresh 6-month high. It would now have to drop beneath $0.215 (200-days EMA) before being in danger of turning bearish again.

XRP-USD Short Term Price Prediction
Looking ahead, if the bulls push higher, the first level of resistance lies at $0.313 (1.414 Fib Extension). This is followed by resistance at $0.321 (bearish .886 Fib Retracement), $0.331 (1.618 Fib Extension), and $0.35.
On the other side, if the sellers break beneath $0.3, support lies at $0.291 (.236 Fib Retracement), $0.28, and $0.268 (.382 Fib Retracement). Additional support is found at $0.26 and $0.25.
The RSI has dropped slightly from overbought conditions as the buyers regroup for a breather. Additionally, the Stochastic RSI produced a bearish crossover signal that signals a brief retracement is on the way.
XRP/BTC: Bulls Pull Back From 2800 SAT Resistance
Key Support Levels: 2560 SAT, 2434 SAT, 2333 SAT.
Key Resistance Levels: 2630 SAT, 2700 SAT, 2800 SAT.
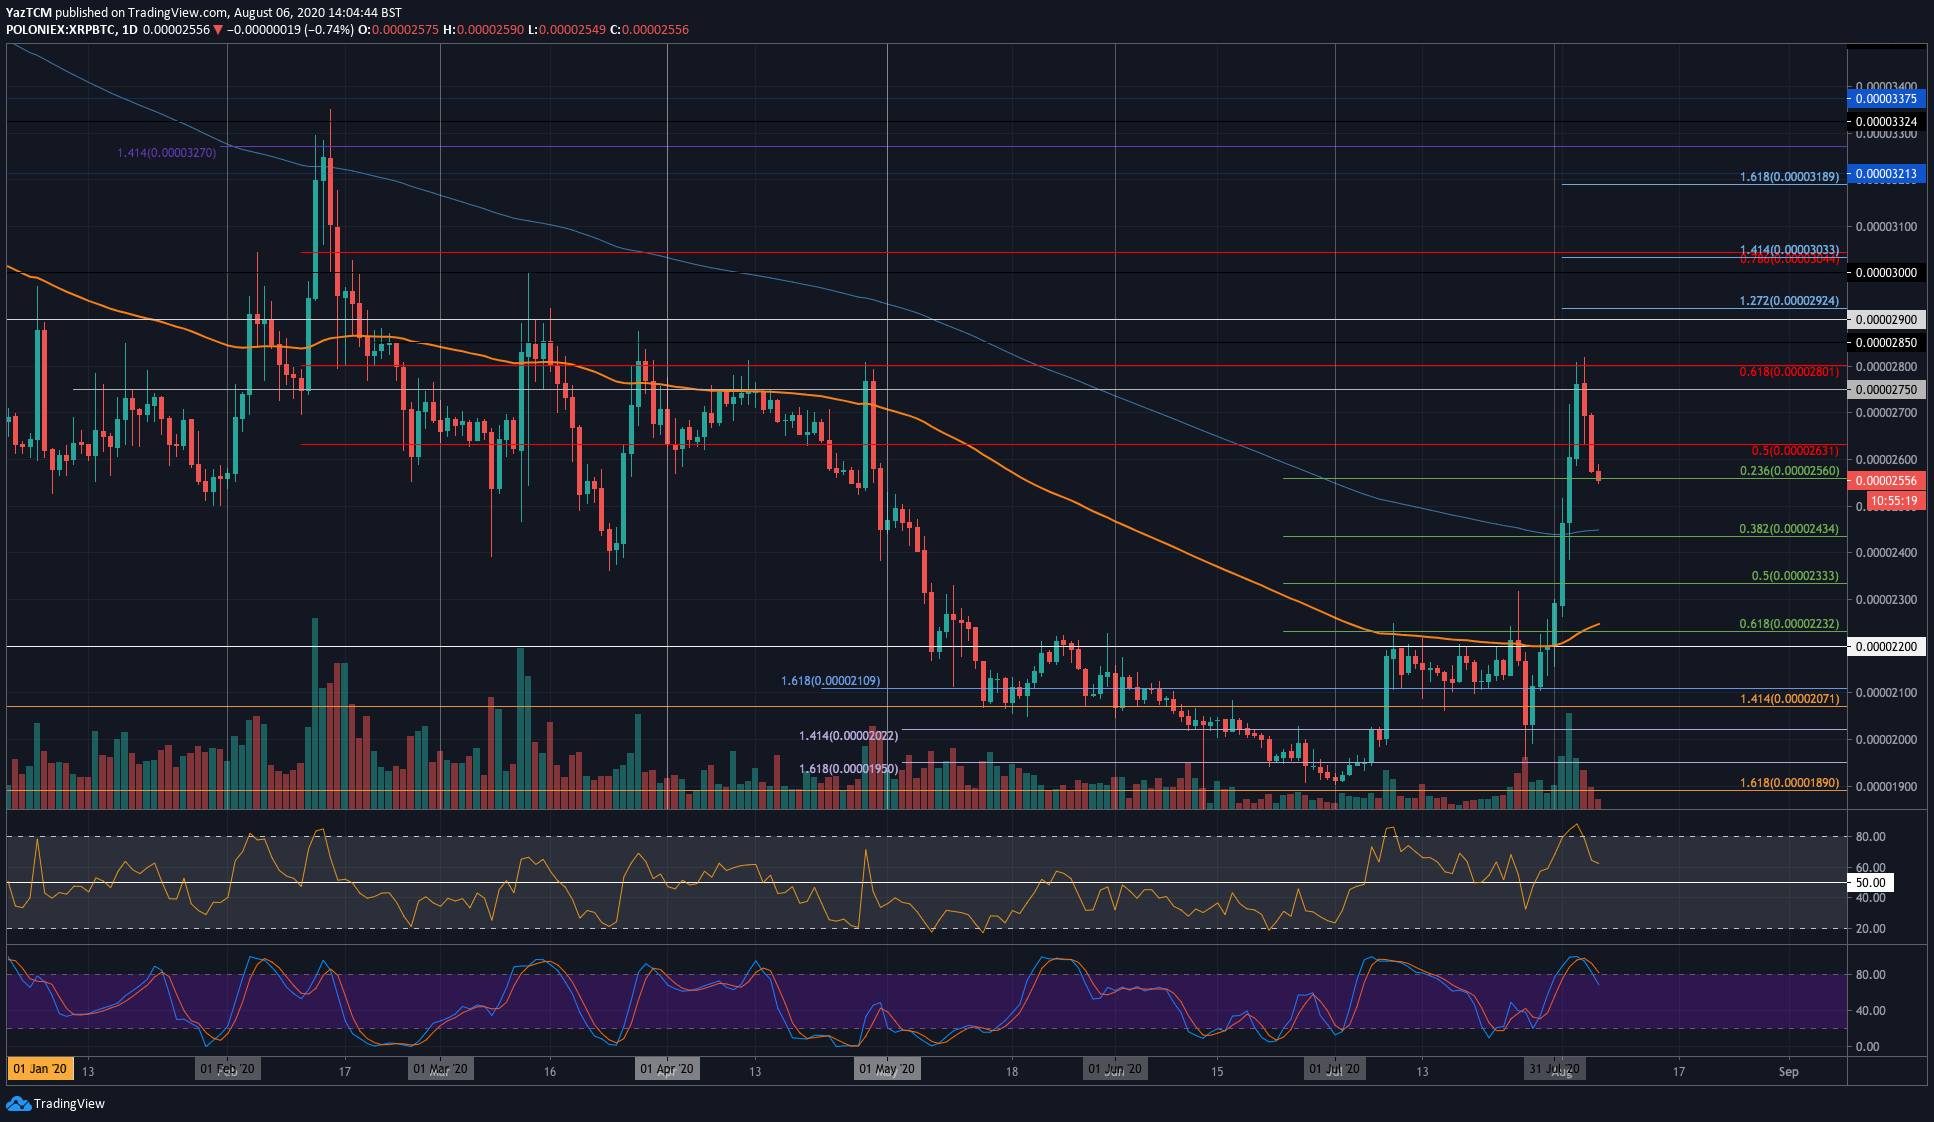
The market is looking pretty similar for XRP against Bitcoin. The coin surged from as low as 2200 SAT at the start of August to reach as high as 2800 SAT, where it ran into resistance at a bearish .618 Fib Retracement.
From there, XRP retraced slightly as it dropped into the support at 2360 SAST (.236 Fib Retracement). The coin is certainly bullish and would need to drop beneath 2250 SAT (200-days EMA) to turn bearish.

XRP-BTC Short Term Price Prediction
Moving forward, if the sellers push beneath 2560 SAT, the first level of support is located at 2434 SAT (.382 Fib Retracement & 100-days EMA). This is followed by support at 2333 SAT (.5 Fib Retracement) and 2250 SAT (200-days EMA).
On the other side, the first level of resistance lies at 2631 SAT (bearish .5 Fib Retracement). This is followed by resistance at 2700 SAT and 2800 SAT (bearish .618 Fib Retracement). Above this, added resistance lies at 2850 SAT, 2900 SAT, and 3000 SAT.
The RSI has dropped from overbought conditions but remains above the 50 line as the bulls are in control of the momentum. Likewise, the Stochastic RSI produced a bearish crossover signal, which would help to send the market lower.
