XRP remains above the %excerpt%.21 level after seeing a 10% price surge over the past week.Against BTC, XRP has plummetted to create a fresh low beneath the December low-day-closing price.If the bulls can continue to defend the %excerpt%.21 level, there is a chance that we will head toward %excerpt%.25.Key Support & Resistance LevelsXRP/USDSupport: %excerpt%.21, %excerpt%.20, %excerpt%.185 Resistance: %excerpt%.22, %excerpt%.228, %excerpt%.234, %excerpt%.26..XRP/BTC:Support: 2800 SAT, 2750 SAT, 2710 SAT, 2600 SAT.Resistance: 2900 SAT, 3000 SAT, 3200 SAT.XRP/USD: XRP Meets Strong Resistance At The 100-Days EMAOn the daily chart above, XRP had surged toward the start of the month as it broke above the %excerpt%.20 level and headed toward %excerpt%.228. The cryptocurrency met strong resistance yesterday at the 100-days EMA which caused it to roll over and fall back into the
Topics:
Yaz Sheikh considers the following as important: Ripple (XRP) Price, XRP Analysis
This could be interesting, too:
Jordan Lyanchev writes Ripple’s (XRP) Surge to Triggers Over Million in Short Liquidations
Jordan Lyanchev writes Trump Confirms Work on Strategic Crypto Reserve: XRP, ADA, SOL Included
Mandy Williams writes Ripple Releases Institutional DeFi Roadmap for XRP Ledger in 2025
Jordan Lyanchev writes ChatGPT and DeepSeek Analyze Ripple’s (XRP) Price Potential for 2025
- XRP remains above the $0.21 level after seeing a 10% price surge over the past week.
- Against BTC, XRP has plummetted to create a fresh low beneath the December low-day-closing price.
- If the bulls can continue to defend the $0.21 level, there is a chance that we will head toward $0.25.
Key Support & Resistance Levels
XRP/USD
Support: $0.21, $0.20, $0.185
Resistance: $0.22, $0.228, $0.234, $0.26..
XRP/BTC:
Support: 2800 SAT, 2750 SAT, 2710 SAT, 2600 SAT.
Resistance: 2900 SAT, 3000 SAT, 3200 SAT.
XRP/USD: XRP Meets Strong Resistance At The 100-Days EMA
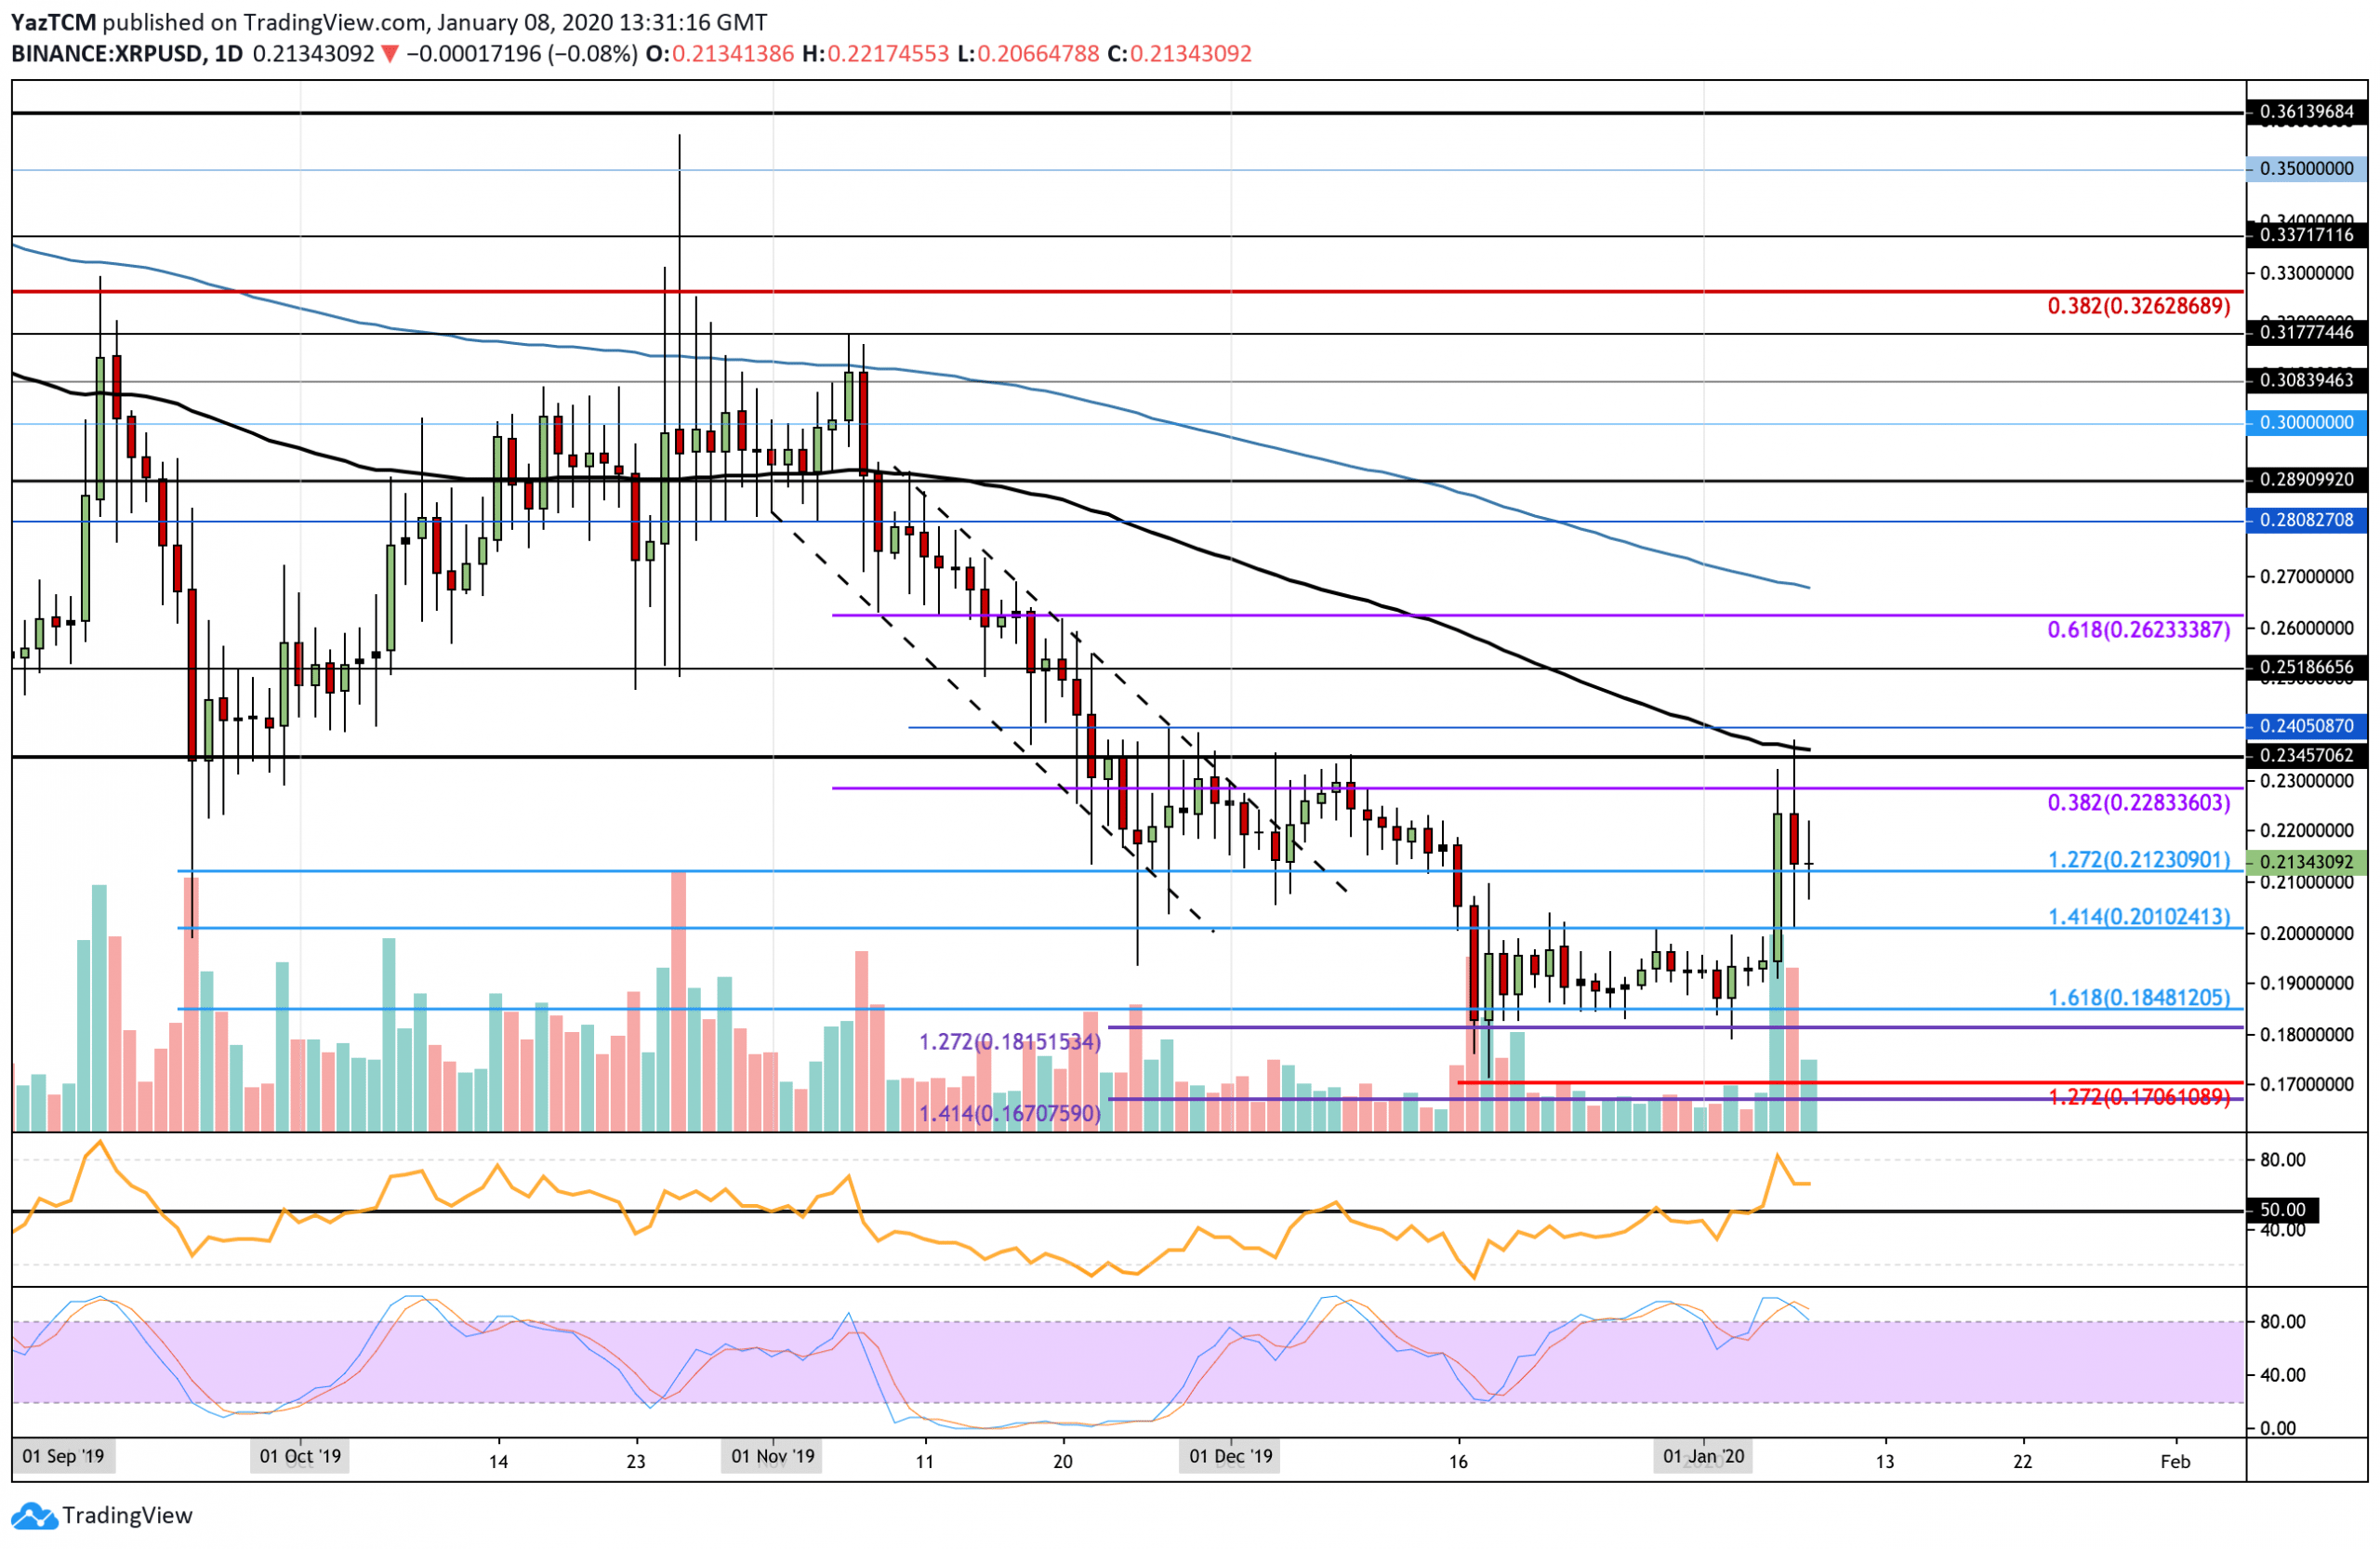
On the daily chart above, XRP had surged toward the start of the month as it broke above the $0.20 level and headed toward $0.228. The cryptocurrency met strong resistance yesterday at the 100-days EMA which caused it to roll over and fall back into the support at $0.212.
XRP remains bullish in the short term but must break this 100-days EMA to be considered bullish over the medium term. If it was to drop beneath the support at $0.212, it could be considered that XRP returned to a neutral trend. To turn bearish, it must fall and break beneath the December support at $0.181.
XRP Short Term Price Prediction
If the buyers manage to defend the $0.212 level and allow XRP to rebound higher, an initial resistance is located at $0.228 (bearish .382 Fib Retracement). Above this, resistance lies at $0.234 which is further bolstered by the 100-days EMA. If the buyers drive XRP above $0.24, the next level of resistance lies at $0.25. On the other hand, if the sellers push XRP beneath $0.212, immediate support is located at $0.20 and $0.19. Beneath this, support lies at $0.185 and $0.181.
The RSI reached overbought conditions and started to roll over. However, as it is still above the 50 level, the momentum remains within the favor of the bulls. Worryingly, the Stochastic RSI recently produced a bearish crossover signal that might send the market lower.
XRP/BTC: XRP Reaches 2900 SAT But Can We Break 3000 SAT?
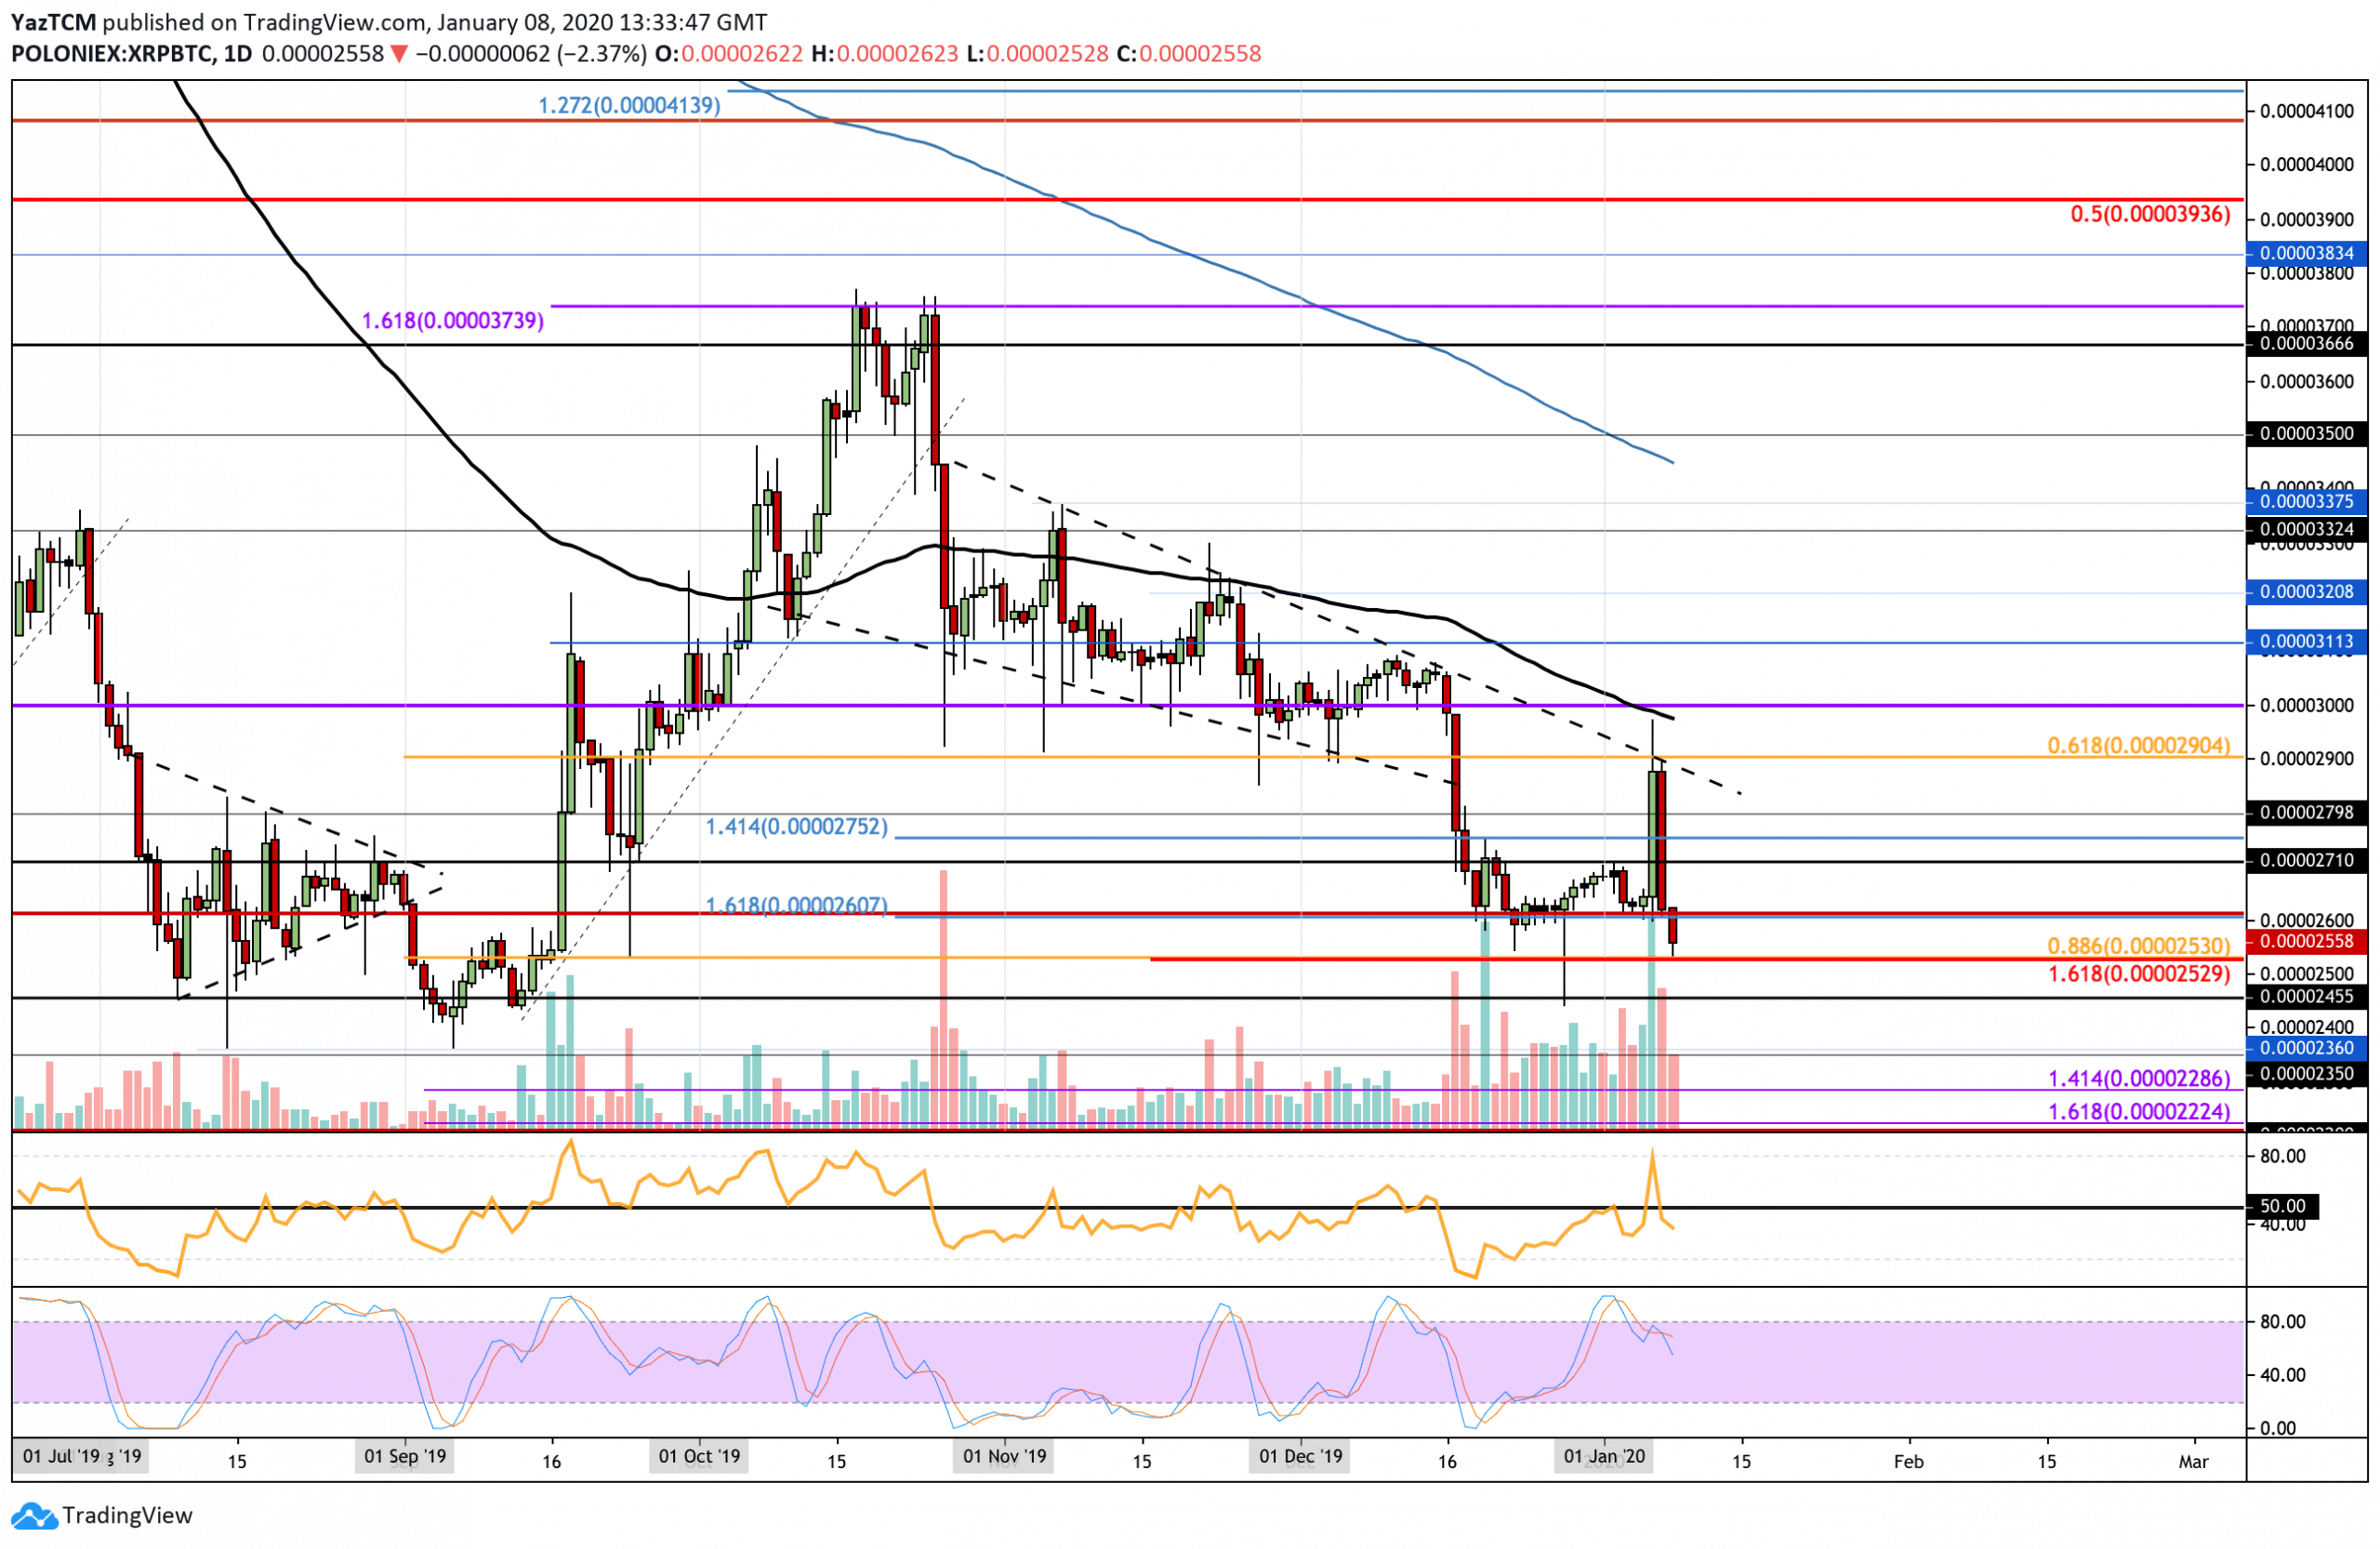
Since our previous analysis, XRP stalled at the resistance provided at the 2900 SAT level. It did continue higher into the 3000 SAT level (and 100-days EMA) but rolled over and started to fall. XRP dropped significantly over the past 2 days against BTC as it fell beneath the December support at 2600 SAT and reached the .886 Fibonacci Retracement level at 2530 SAT.
If XRP was to drop beneath the support at 2530 SAT then the market would be considered as strongly bearish. To turn bullish, it must rise and break above the resistance at the 3000 SAT level.
XRP Short Term Price Prediction
If the sellers push XRP beneath 2530 SAT, immediate support toward the downside is located at 2455 SAT. Beneath this, additional support is located at 2400 SAT, 2360 SAT and 2300 SAT. Alternatively, if the buyers defend the 2530 SAT level and rebound, an initial resistance is located at 2710 SAT and 2750 SAT. Above this, resistance lies at 2800 SAT, 2900 SAT, and 3000 SAT.
The RSI has penetrated beneath the 50 level to indicate that the sellers are in control over the market momentum. For a sign of recovery, look for the RSI to rise back toward the 50 level.