TL;DRXRP increased by a further 1.33% over the past 24 hours, resulting in a weekly increase of over 8%.Against Bitcoin, XRP rebounded from the support at 2525 SAT as it looks to regain some of the January losses.XRP now faces strong resistance at %excerpt%.245 and must close above here to head toward the 200-days EMA.Key Support & Resistance LevelsXRP/USDSupport: %excerpt%.234, %excerpt%.218, %excerpt%.212.Resistance: %excerpt%.245, %excerpt%.25, %excerpt%.26.XRP/BTCSupport: 2525 SAT, 2455 SAT, 2423 SAT.Resistance: 2600 SAT, 2710 SAT, 2800 SAT.XRP/USD – XRP Finally Breaks %excerpt%.24 After 2-Weeks Of AttemptsSince our last analysis, XRP continued to struggle to break above the critical resistance at %excerpt%.24. It did indeed spike higher but always closed the day beneath the resistance mentioned above.The coin continued to remain supported at
Topics:
Yaz Sheikh considers the following as important: Ripple (XRP) Price, XRP Analysis
This could be interesting, too:
Jordan Lyanchev writes Ripple’s (XRP) Surge to Triggers Over Million in Short Liquidations
Jordan Lyanchev writes Trump Confirms Work on Strategic Crypto Reserve: XRP, ADA, SOL Included
Mandy Williams writes Ripple Releases Institutional DeFi Roadmap for XRP Ledger in 2025
Jordan Lyanchev writes ChatGPT and DeepSeek Analyze Ripple’s (XRP) Price Potential for 2025
TL;DR
- XRP increased by a further 1.33% over the past 24 hours, resulting in a weekly increase of over 8%.
- Against Bitcoin, XRP rebounded from the support at 2525 SAT as it looks to regain some of the January losses.
- XRP now faces strong resistance at $0.245 and must close above here to head toward the 200-days EMA.
Key Support & Resistance Levels
XRP/USD
Support: $0.234, $0.218, $0.212.
Resistance: $0.245, $0.25, $0.26.
XRP/BTC
Support: 2525 SAT, 2455 SAT, 2423 SAT.
Resistance: 2600 SAT, 2710 SAT, 2800 SAT.
XRP/USD – XRP Finally Breaks $0.24 After 2-Weeks Of Attempts
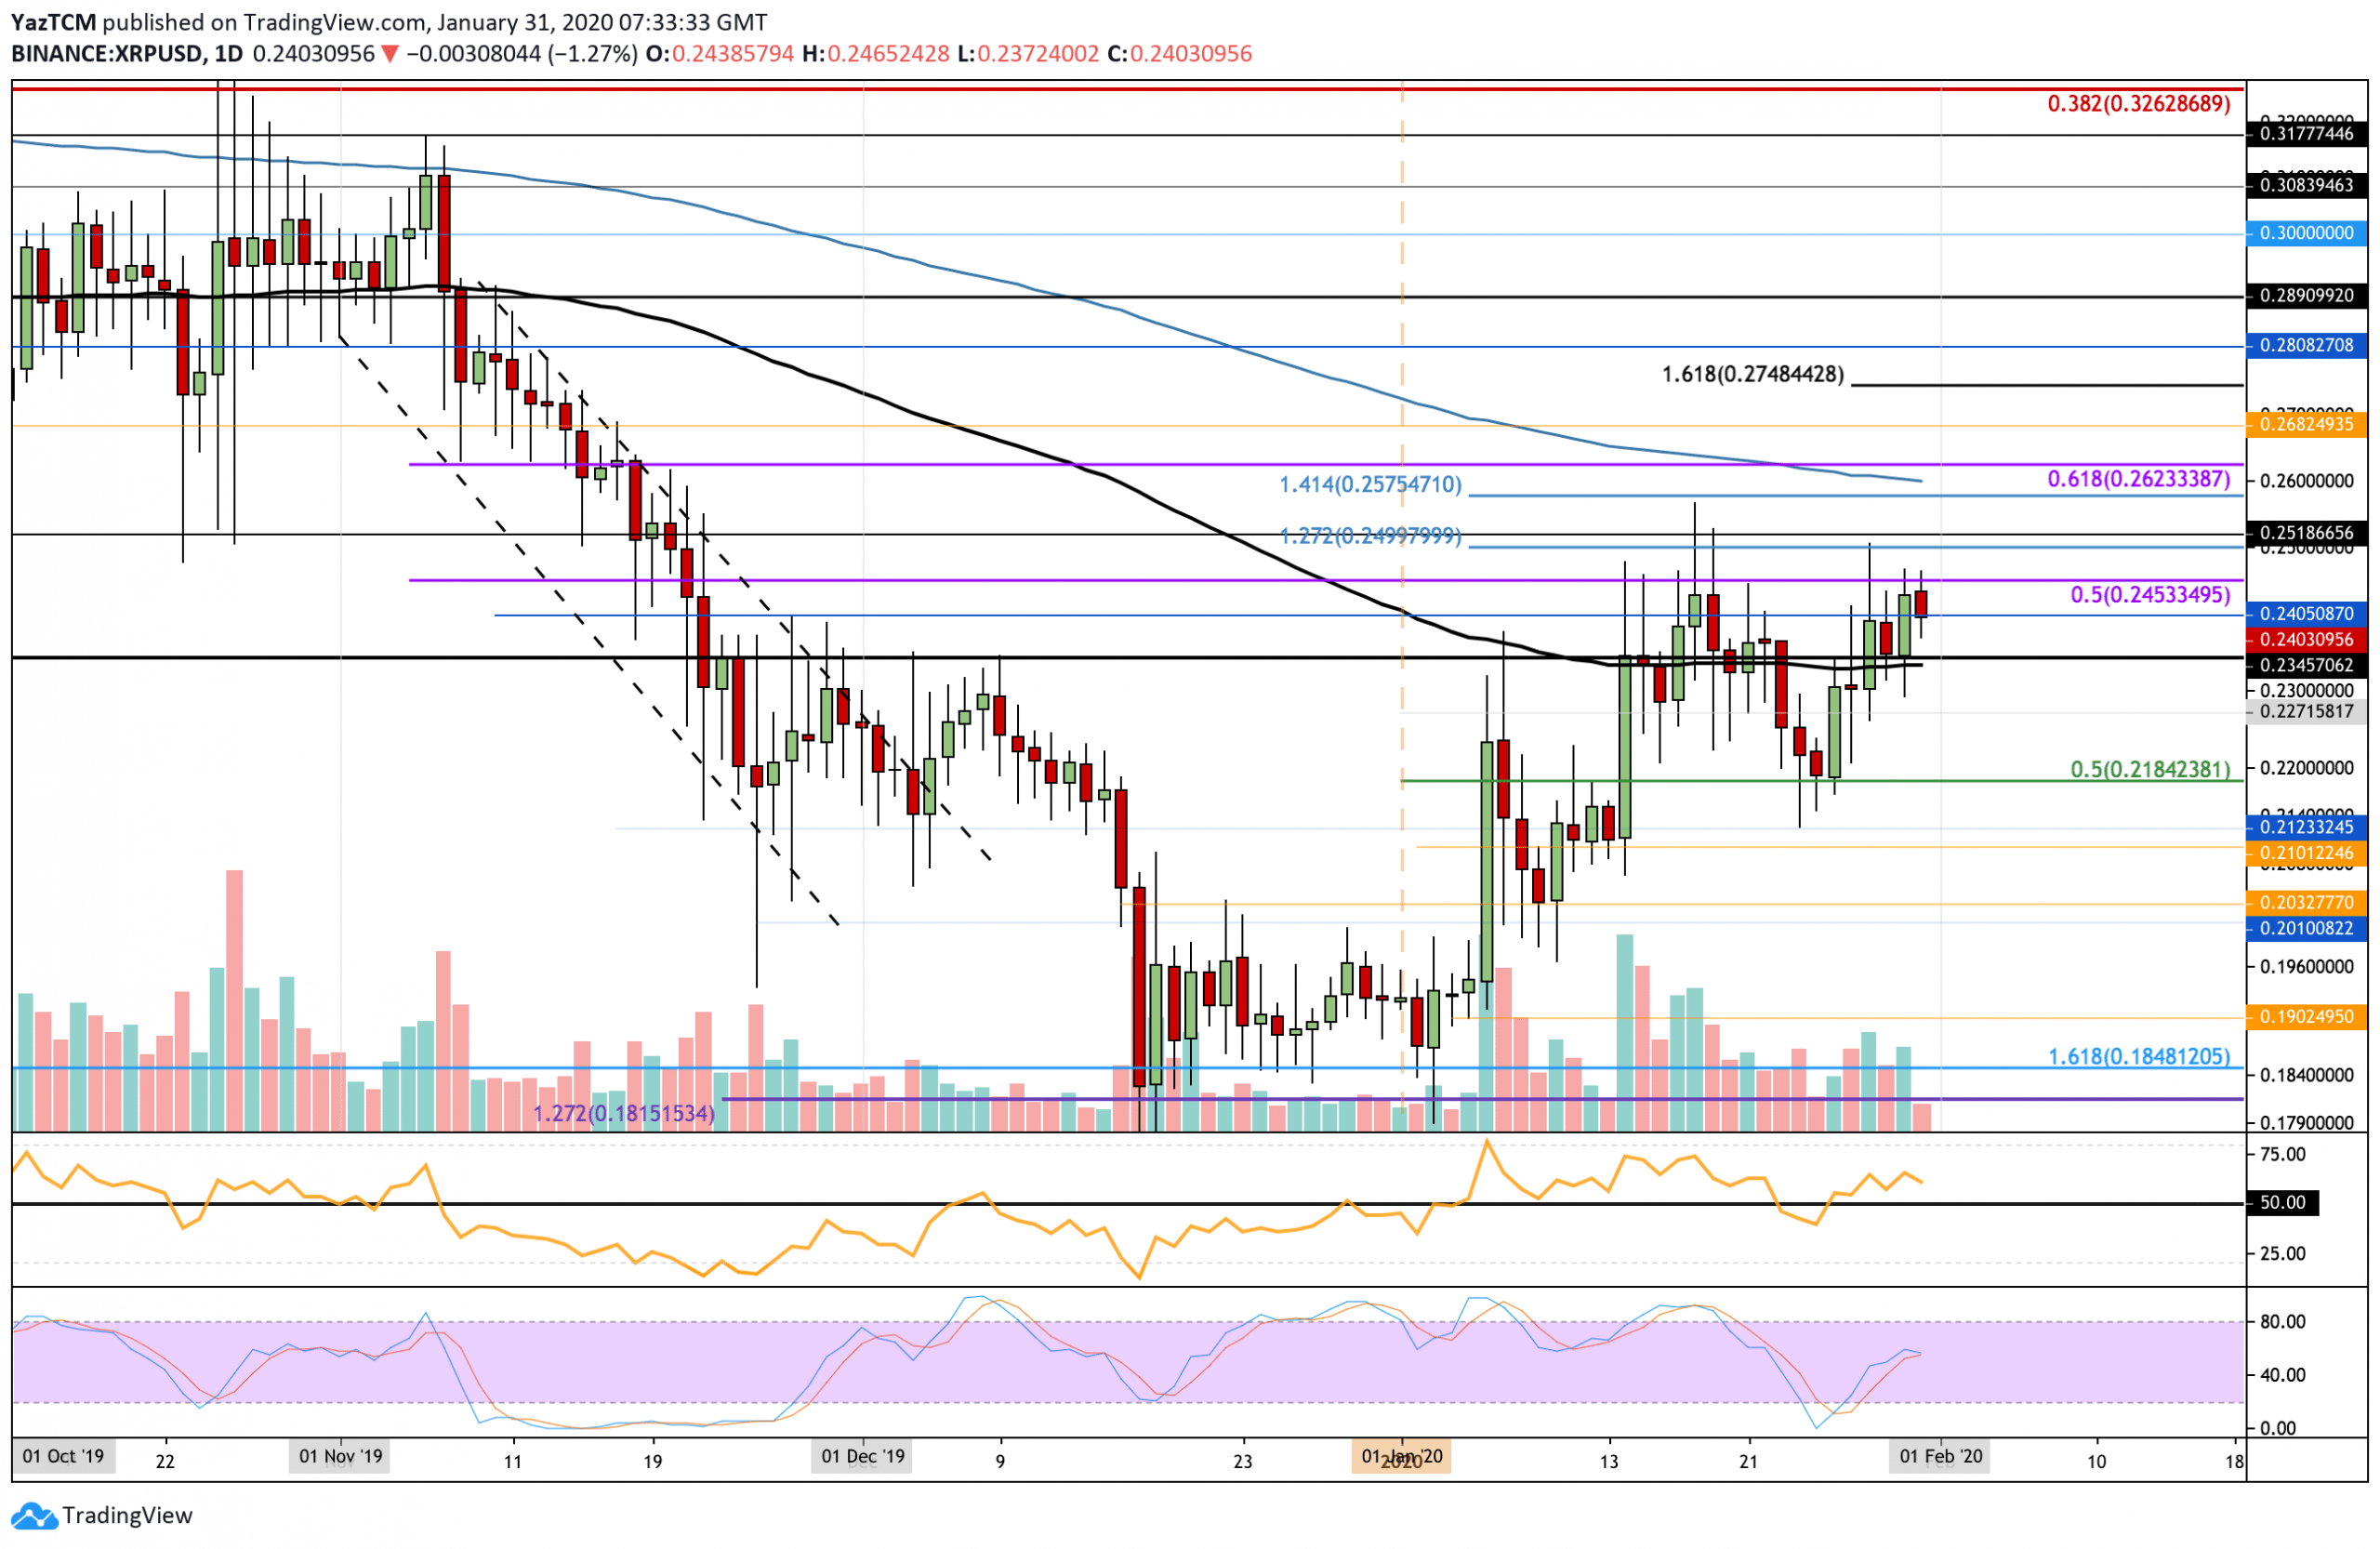
Since our last analysis, XRP continued to struggle to break above the critical resistance at $0.24. It did indeed spike higher but always closed the day beneath the resistance mentioned above.
The coin continued to remain supported at $0.234 this past week. After two weeks of attempts, XRP finally broke above this resistance as the cryptocurrency rose higher into the resistance at $0.245 provided by a bearish 0.5 Fibonacci Retracement.
XRP remains neutral at this moment in time and better close the weekly candle above $0.245 to stay bullish in the short term. A break above $0.26 would confirm a longer termed bullish trend. From the other side, if XRP were to drop beneath the support at $0.21, the market would be considered as bearish in the short term.
XRP Short Term Price Prediction
If the bulls break above $0.245, immediate higher resistance lies at $0.25. Above this, resistance lies at $0.257 (1.414 Fib Extension) and $0.26 (200-days EMA). The bearish .618 Fibonacci Retracement level further bolsters the resistance at $0.26.
On the other hand, if the sellers step in and push XRP lower, support can be found at $0.234 (100-days EMA). Beneath this, additional support lies at $0.227, $0.218 (.5 Fib Retracement), and $0.21.
The RSI has now climbed back above the 50 levels to indicate the bulls are in control over the market momentum. If it can remain above 50, XRP will have the potential to maintain support at $0.234 and break above $0.245.
XRP/BTC – BRebounds At 2525 SAT – Where To Next?
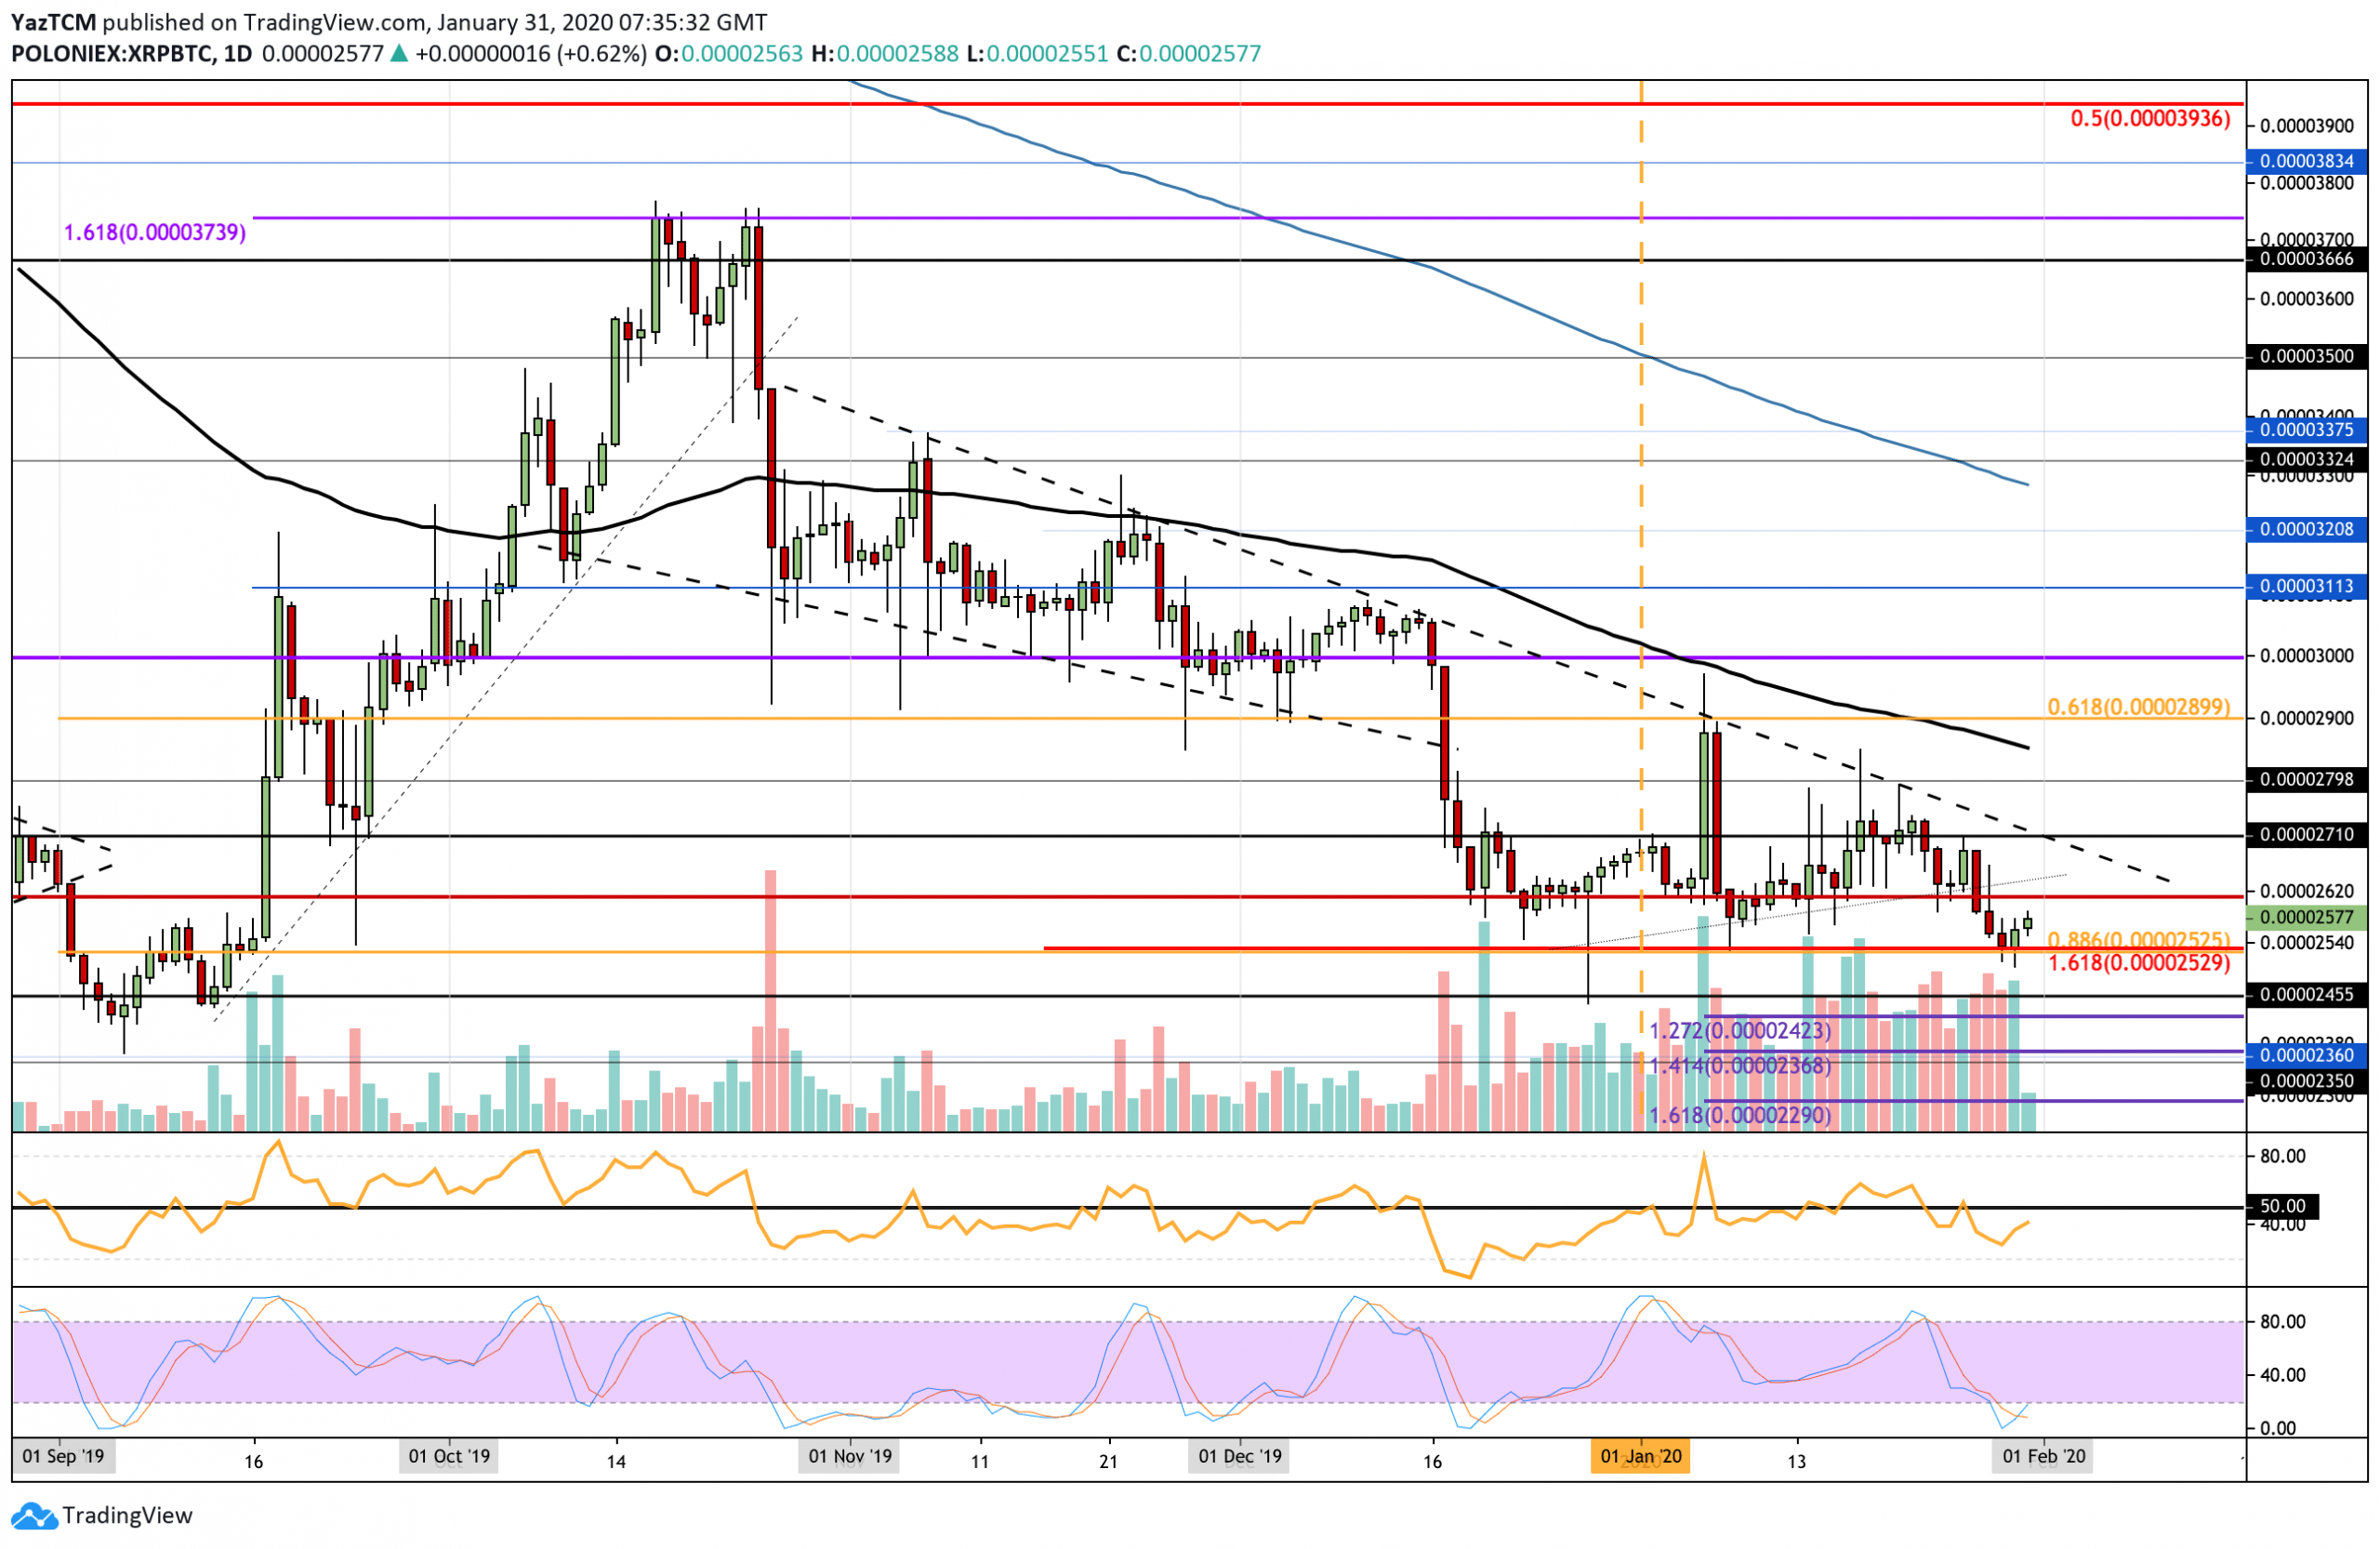
Against Bitcoin, XRP rebounded from the support at 2525 SAT, which is provided by the 0.886 Fibonacci Retracement level. It did declined to lower areas, forming a new January low at 2500 SAT; however, XRP managed to rebound and close above the support mentioned above.
The coin remains neutral following the rebound back above the 2525 SAT. If XRP were to close beneath this support, it’s likely to turn short-term bearish. To become bullish against BTC, XRP must form a higher high above 2900 SAT and break above the 100-days EMA.
XRP Short Term Price Prediction
If the bulls continue to push higher, the first level of resistance is expected at 2600 SAT. The next resistance lies at 2710 SAT, 2800 SAT, and 2850 SAT (100-days EMA).
On the other hand, if the sellers regroup and push XRP lower, the first level of support lies at 2525 SAT. Beneath this, additional support lies at 2455 SAT, 2423 SAT, and 2368 SAT.
The RSI is still beneath the 50 levels; however, it is slowly rising, which shows that the previous bearish pressure is showing signs of fading. Additionally, the Stochastic RSI has recently produced a bullish crossover signal, which is a secure bullish sign for XRP.


