XRP has moved sideways over the last few days as the bulls battle to defend %excerpt%.175.A break beneath %excerpt%.175 could result in XRP unwinding toward %excerpt%.15.Against Bitcoin, XRP continues to make lower lows as the sellers flirt with breaking beneath 1900 SAT.Key Support & Resistance LevelsXRP/USD:Support: %excerpt%.175, %excerpt%.171, %excerpt%.157.Resistance: %excerpt%.185, %excerpt%.192, %excerpt%.20.XRP/BTC:Support: 1900 SAT, 1890 SAT, 1873 SATResistance: 1950 SAT, 2000 SAT, 2070 SAT.XRP/USD: Bulls Continue Defence of .5 Fib RetracementAfter falling beneath the descending triangle pattern last week, XRP has continuously dropped lower until the support was found at %excerpt%.175 (.5 Fib Retracement). The price has spiked beneath this support, but the buyers managed to keep it above %excerpt%.175 for the closing price of each day.A break beneath the
Topics:
Yaz Sheikh considers the following as important: Ripple (XRP) Price, XRP Analysis, xrpbtc, xrpusd
This could be interesting, too:
Jordan Lyanchev writes Ripple’s (XRP) Surge to Triggers Over Million in Short Liquidations
Jordan Lyanchev writes Trump Confirms Work on Strategic Crypto Reserve: XRP, ADA, SOL Included
Dimitar Dzhondzhorov writes Is a Major Ripple v. SEC Lawsuit Development Expected This Week? Here’s Why
Mandy Williams writes Ripple Releases Institutional DeFi Roadmap for XRP Ledger in 2025
- XRP has moved sideways over the last few days as the bulls battle to defend $0.175.
- A break beneath $0.175 could result in XRP unwinding toward $0.15.
- Against Bitcoin, XRP continues to make lower lows as the sellers flirt with breaking beneath 1900 SAT.
Key Support & Resistance Levels
XRP/USD:
Support: $0.175, $0.171, $0.157.
Resistance: $0.185, $0.192, $0.20.
XRP/BTC:
Support: 1900 SAT, 1890 SAT, 1873 SAT
Resistance: 1950 SAT, 2000 SAT, 2070 SAT.
XRP/USD: Bulls Continue Defence of .5 Fib Retracement
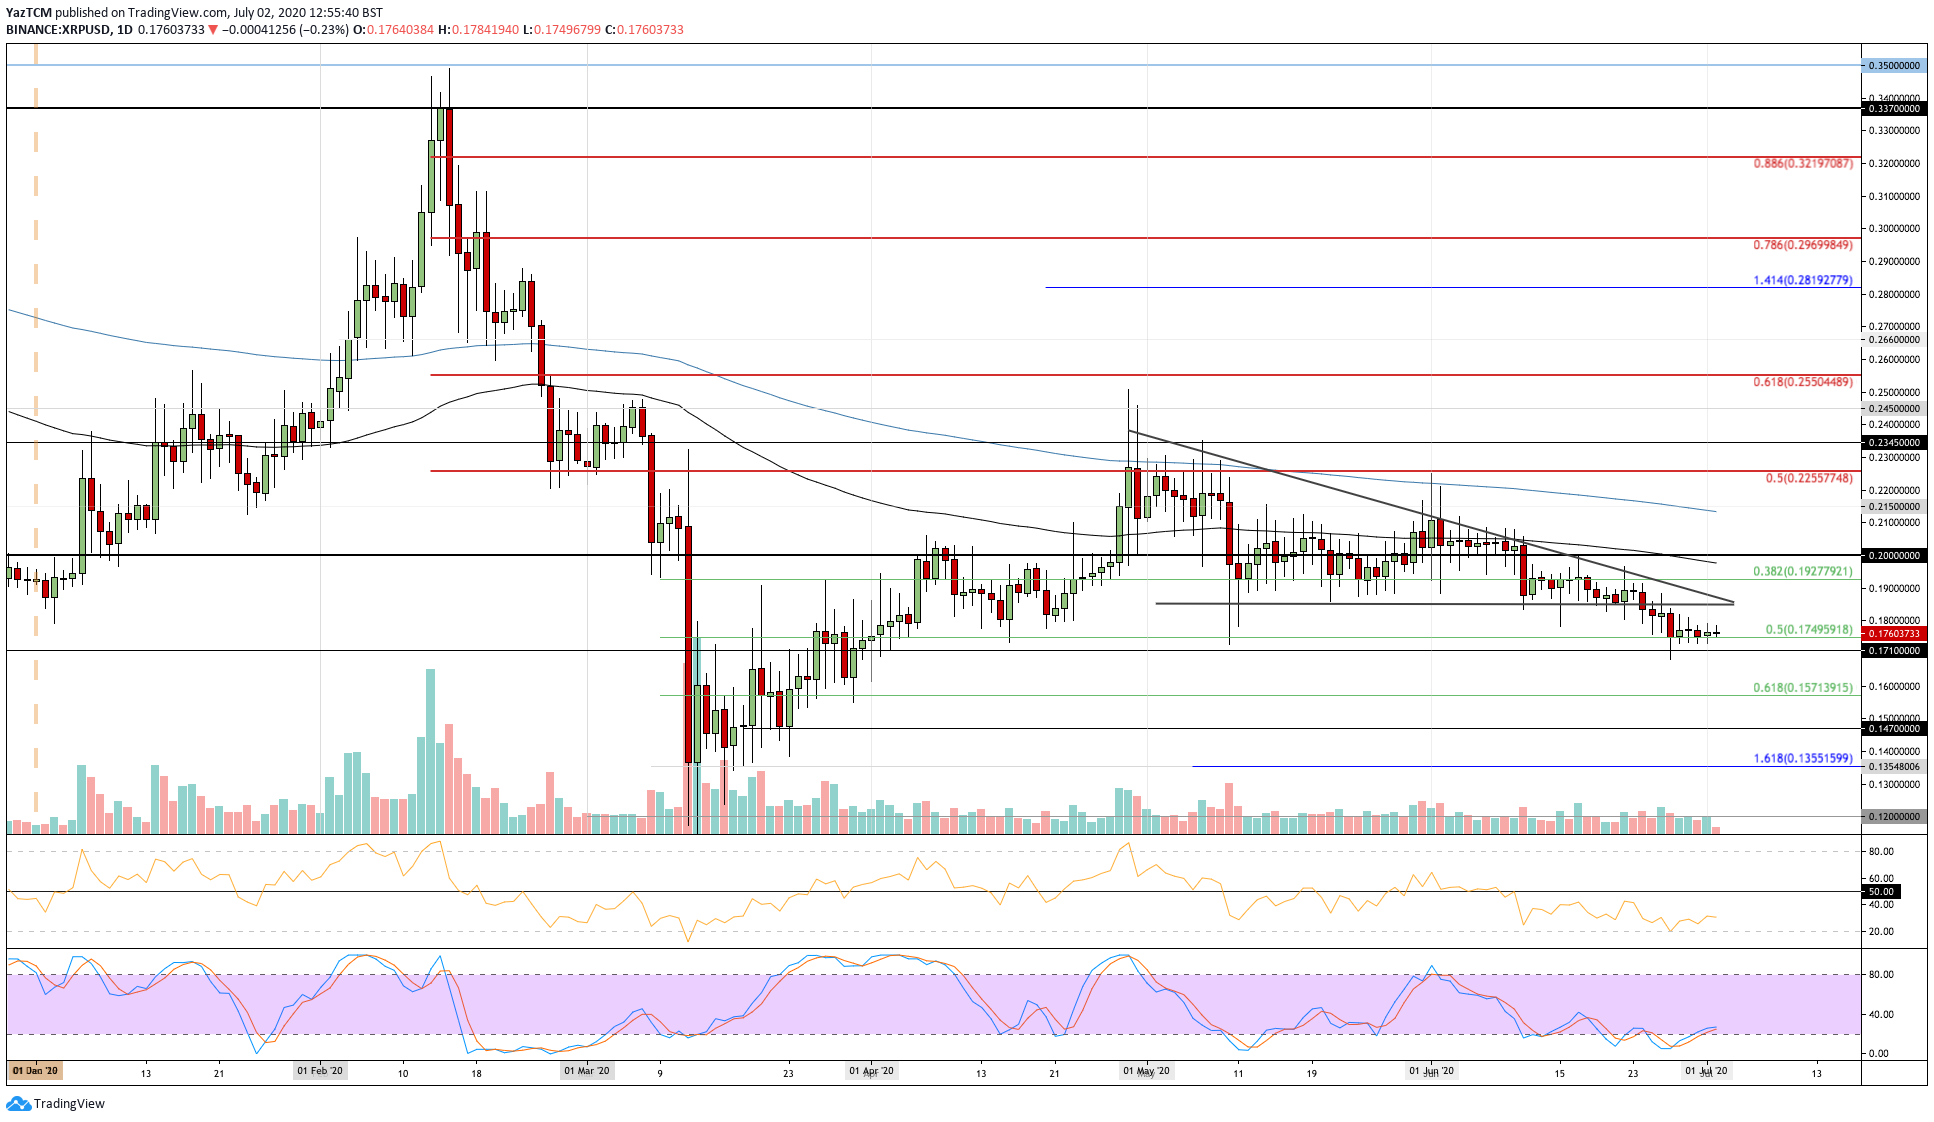
After falling beneath the descending triangle pattern last week, XRP has continuously dropped lower until the support was found at $0.175 (.5 Fib Retracement). The price has spiked beneath this support, but the buyers managed to keep it above $0.175 for the closing price of each day.
A break beneath the support at $0.175 would create a fresh 3-month low price for XRP and would likely cause it to unwind toward $0.15.

XRP-USD Short Term Price Prediction
Looking ahead, if the bulls can defend $0.175 and rebound from here, the first level of resistance lies at $0.185. Above this, added resistance is located at $0.192 and $0.20 (100-day EMA).
On the other side, if the sellers break beneath $0.175, the first level of support lies at $0.171. Below this, added support is found at $0.157 (.618 Fib Retracement) and $0.15.
The RSI is well beneath the 50 line as the bears dominate the market momentum. For a sign of XRP recovering, look for the RSI to start to rise toward the 50 line to indicate decreasing bearish momentum.
XRP/BTC: XRP Set To Push Beneath 1900 SAT
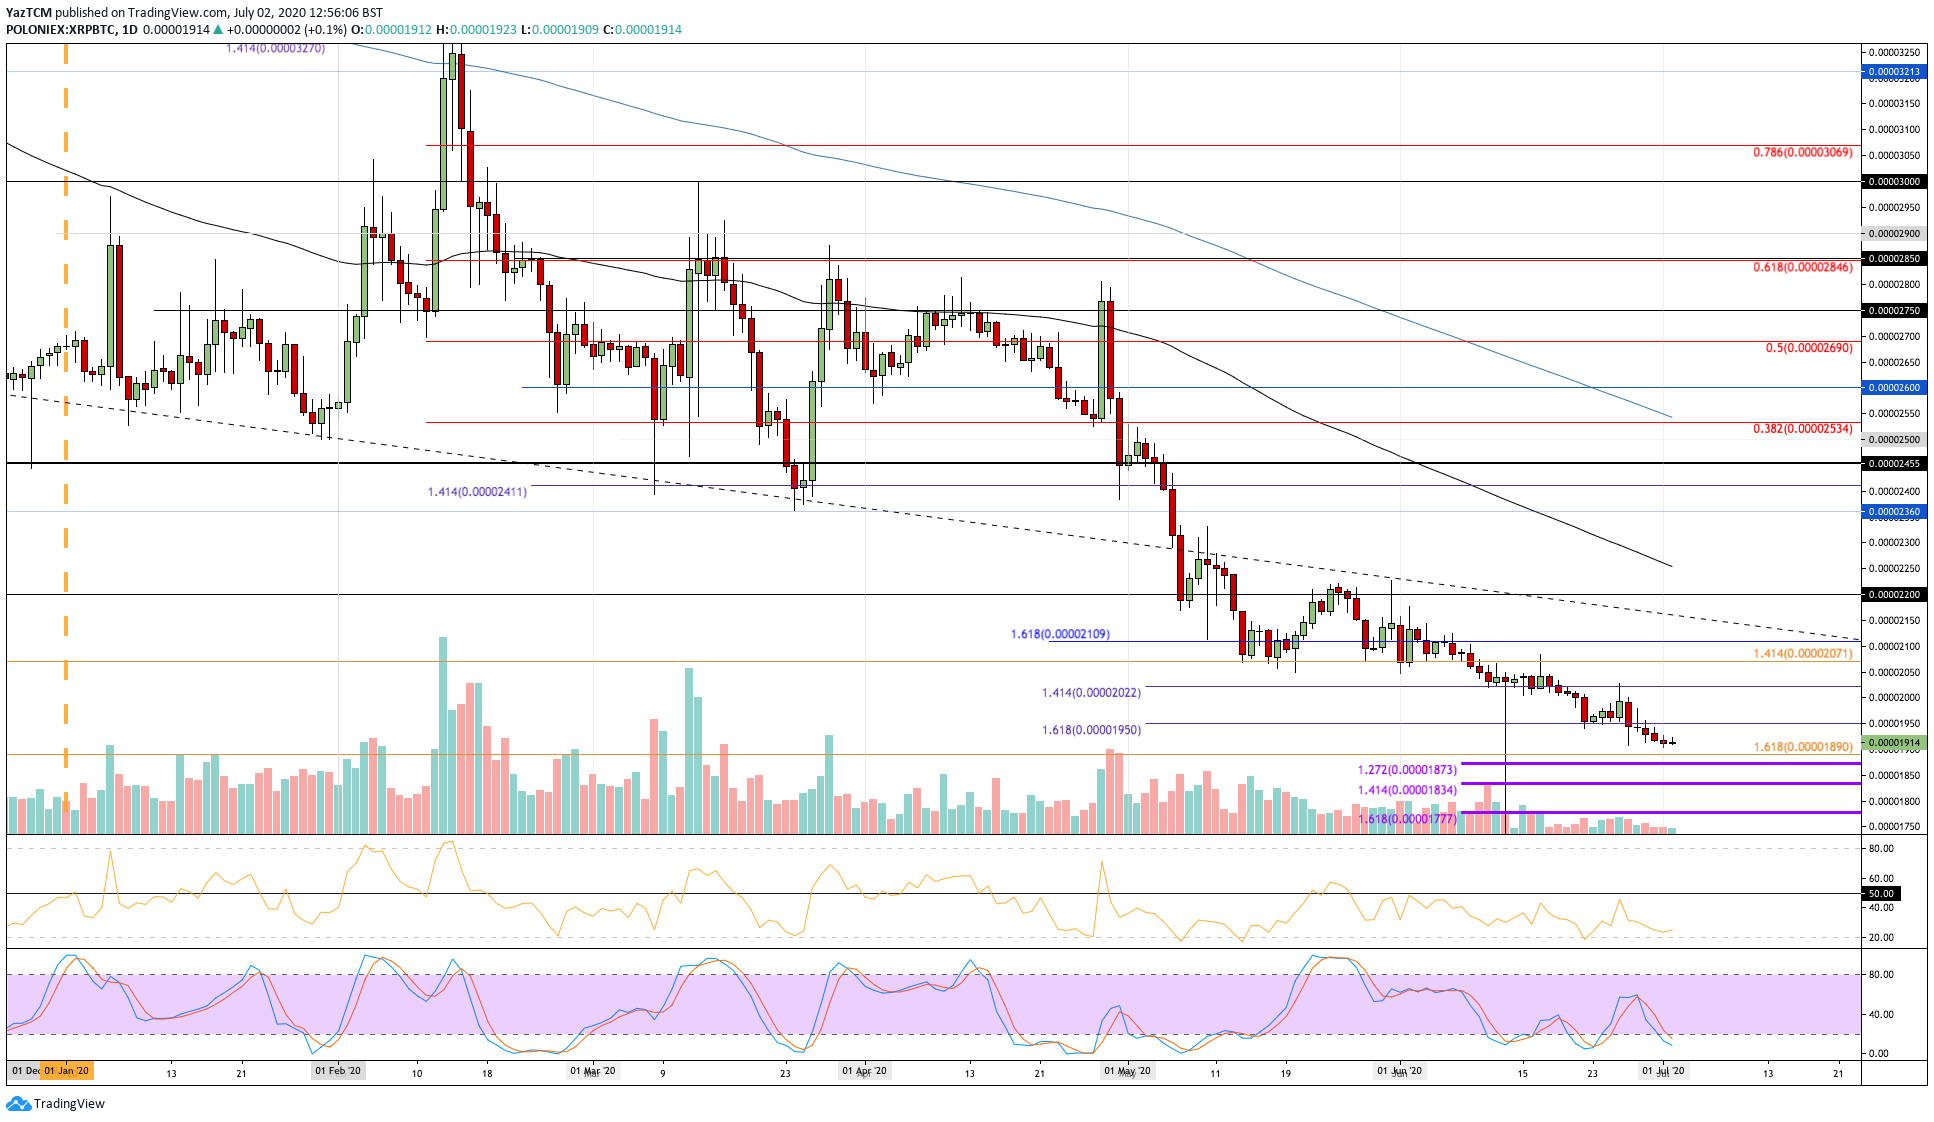
Against Bitcoin, XRP continues to create fresh lows as the sellers attempt to push the market beneath the 1900 SAT support. It has been falling continuously against BTC over the past three months and has dropped by a total of 33% during the period.
A break beneath 1900 SAT would shift the sentiment into an extremely bearish outlook for XRP as fresh multi-year lows will be created.

XRP-BTC Short Term Price Prediction
If the sellers do push beneath 1900 SAT, the first level of support lies at 1890 SAT. After that, added support is found at 1873 SAT and 1834 SAT.
On the other side, the first level of resistance lies at 1950 SAT. Above this, added resistance is found at 2000 SAT and 2070 SAT.
The RIS is in oversold conditions as the bears dominate the market momentum. However, the Stochastic RSI is primed for a bullish crossover signal that would send the market higher.
