XRP dropped by a total of 8% over the past week as the coin fell to the %excerpt%.183 level.This weekly price decrease has caused XRP to plunge beneath the descending triangle pattern that it was trading within.Against Bitcoin, XRP penetrated beneath the 2070 SAT support as the buyers battle to defend 2022 SAT.Key Support & Resistance LevelsXRP/USD:Support: %excerpt%.175, %excerpt%.171, %excerpt%.157.Resistance: %excerpt%.187, %excerpt%.192, %excerpt%.2.XRP/BTC:Support: 2022 SAT, 2000 SAT, 1950 SAT.Resistance: 2071 SAT, 2100 SAT, 2200 SAT.XRP/USD: A Decrease Below The Base Of TriangleXRP was trading within a descending triangle over the past six weeks, with the base at %excerpt%.192. The 8% price drop seen this week allowed XRP to fall beneath this support as it dropped into %excerpt%.187 throughout the week.It decreased by a further 3% today, and
Topics:
Yaz Sheikh considers the following as important: Ripple (XRP) Price, XRP Analysis, xrpbtc, xrpusd
This could be interesting, too:
Jordan Lyanchev writes Ripple’s (XRP) Surge to Triggers Over Million in Short Liquidations
Jordan Lyanchev writes Trump Confirms Work on Strategic Crypto Reserve: XRP, ADA, SOL Included
Dimitar Dzhondzhorov writes Is a Major Ripple v. SEC Lawsuit Development Expected This Week? Here’s Why
Mandy Williams writes Ripple Releases Institutional DeFi Roadmap for XRP Ledger in 2025
- XRP dropped by a total of 8% over the past week as the coin fell to the $0.183 level.
- This weekly price decrease has caused XRP to plunge beneath the descending triangle pattern that it was trading within.
- Against Bitcoin, XRP penetrated beneath the 2070 SAT support as the buyers battle to defend 2022 SAT.
Key Support & Resistance Levels
XRP/USD:
Support: $0.175, $0.171, $0.157.
Resistance: $0.187, $0.192, $0.2.
XRP/BTC:
Support: 2022 SAT, 2000 SAT, 1950 SAT.
Resistance: 2071 SAT, 2100 SAT, 2200 SAT.
XRP/USD: A Decrease Below The Base Of Triangle
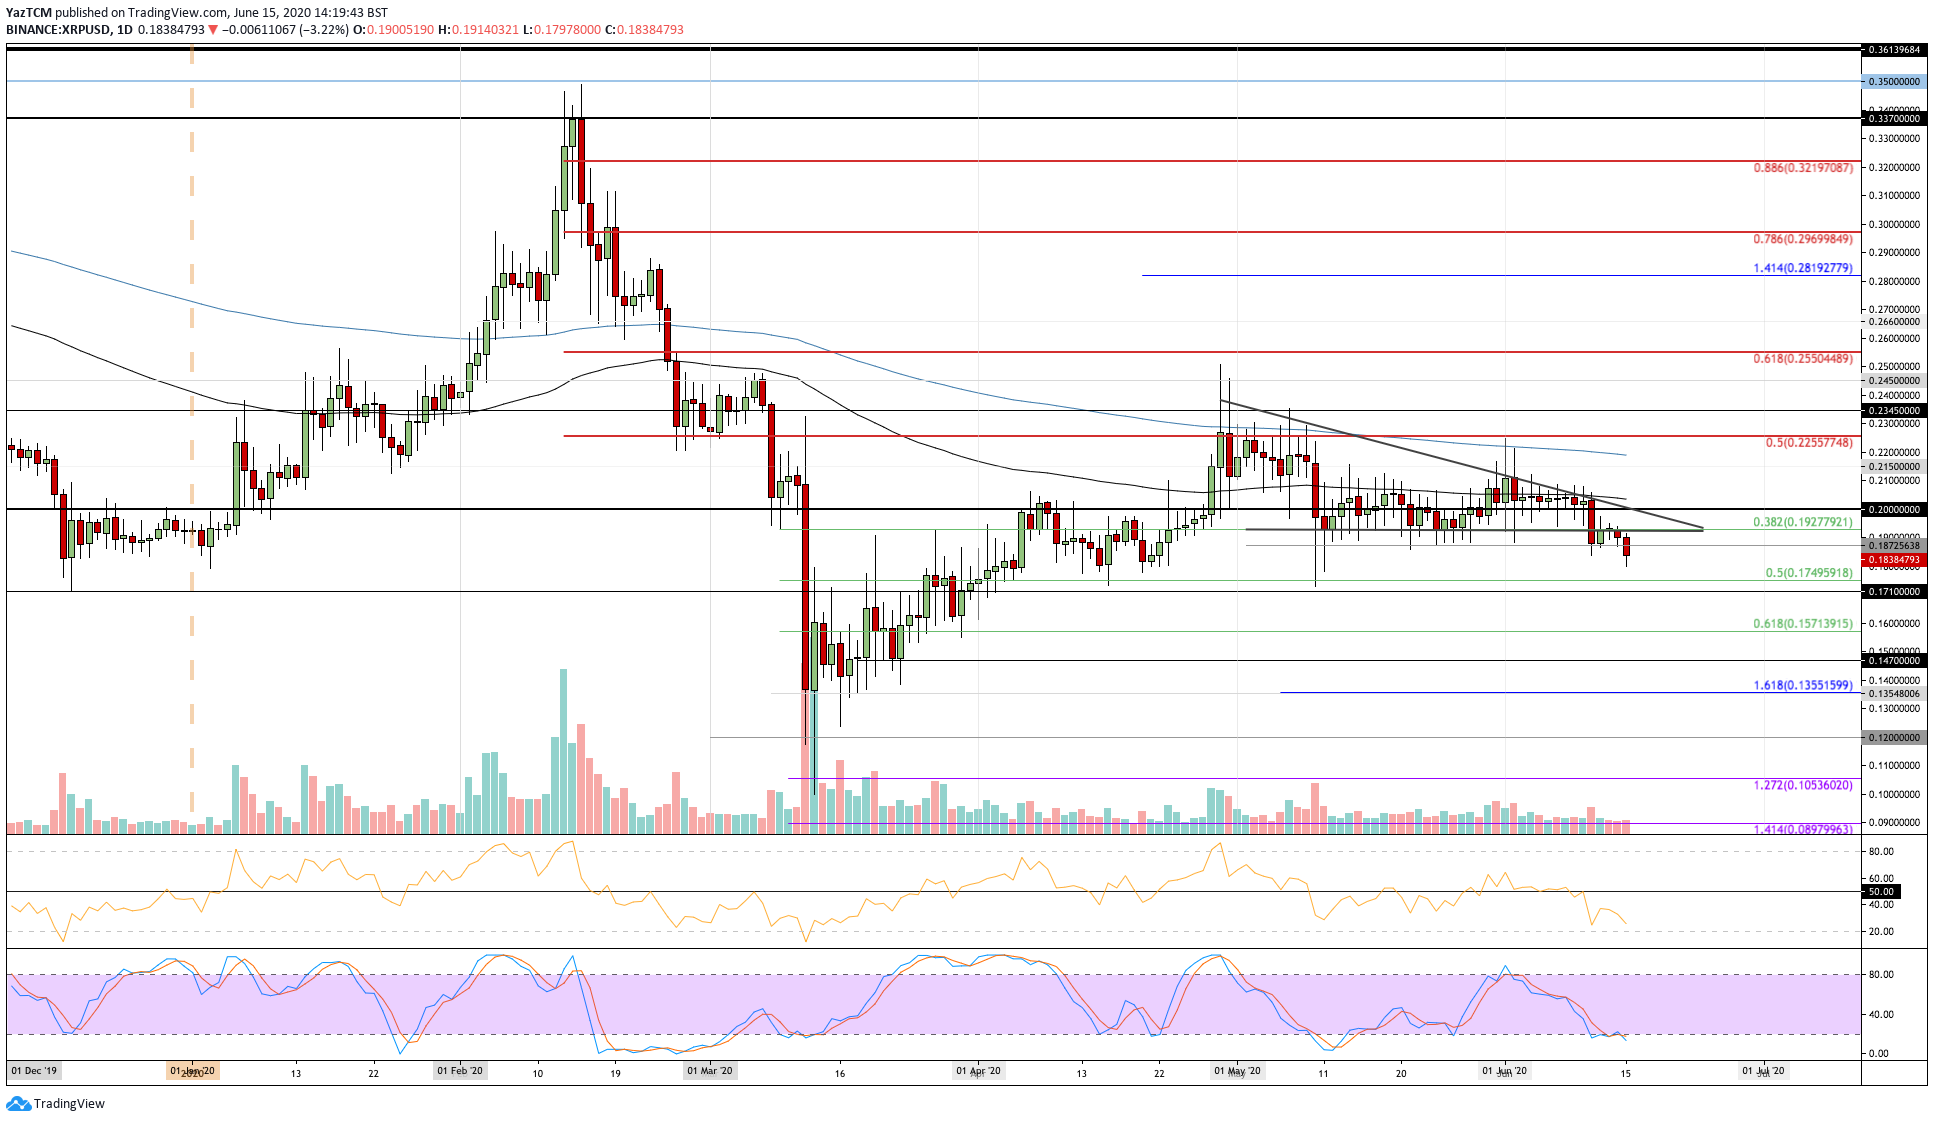
XRP was trading within a descending triangle over the past six weeks, with the base at $0.192. The 8% price drop seen this week allowed XRP to fall beneath this support as it dropped into $0.187 throughout the week.
It decreased by a further 3% today, and this caused the cryptocurrency to fall beneath the $0.187 support as it reaches $0.183. This break beneath the previous consolidation pattern could be signaling a torrential couple of weeks ahead for XRP.

XRP-USD Short Term Price Prediction
Looking ahead, if the sellers continue to drive XRP lower, the first level of support lies at $0.175 (.5 Fib Retracement). Beneath this, support is found at $0.171, $0.157 (.618 Fib Retracement), and $0.15.
On the other side, resistance can be expected at $0.187, $0.192, and $0.20. Added resistance lies at $0.215 and $0.225.
The RSI is well beneath the 50 line to indicate increasing bearish momentum within the market. The RSI will need to head back toward 50 for any recovery to occur. Additionally, the Stochastic RSI is in oversold conditions, and a bullish crossover signal could spark the recovery process.
XRP/BTC: About To Create Further Multi-Year Lows
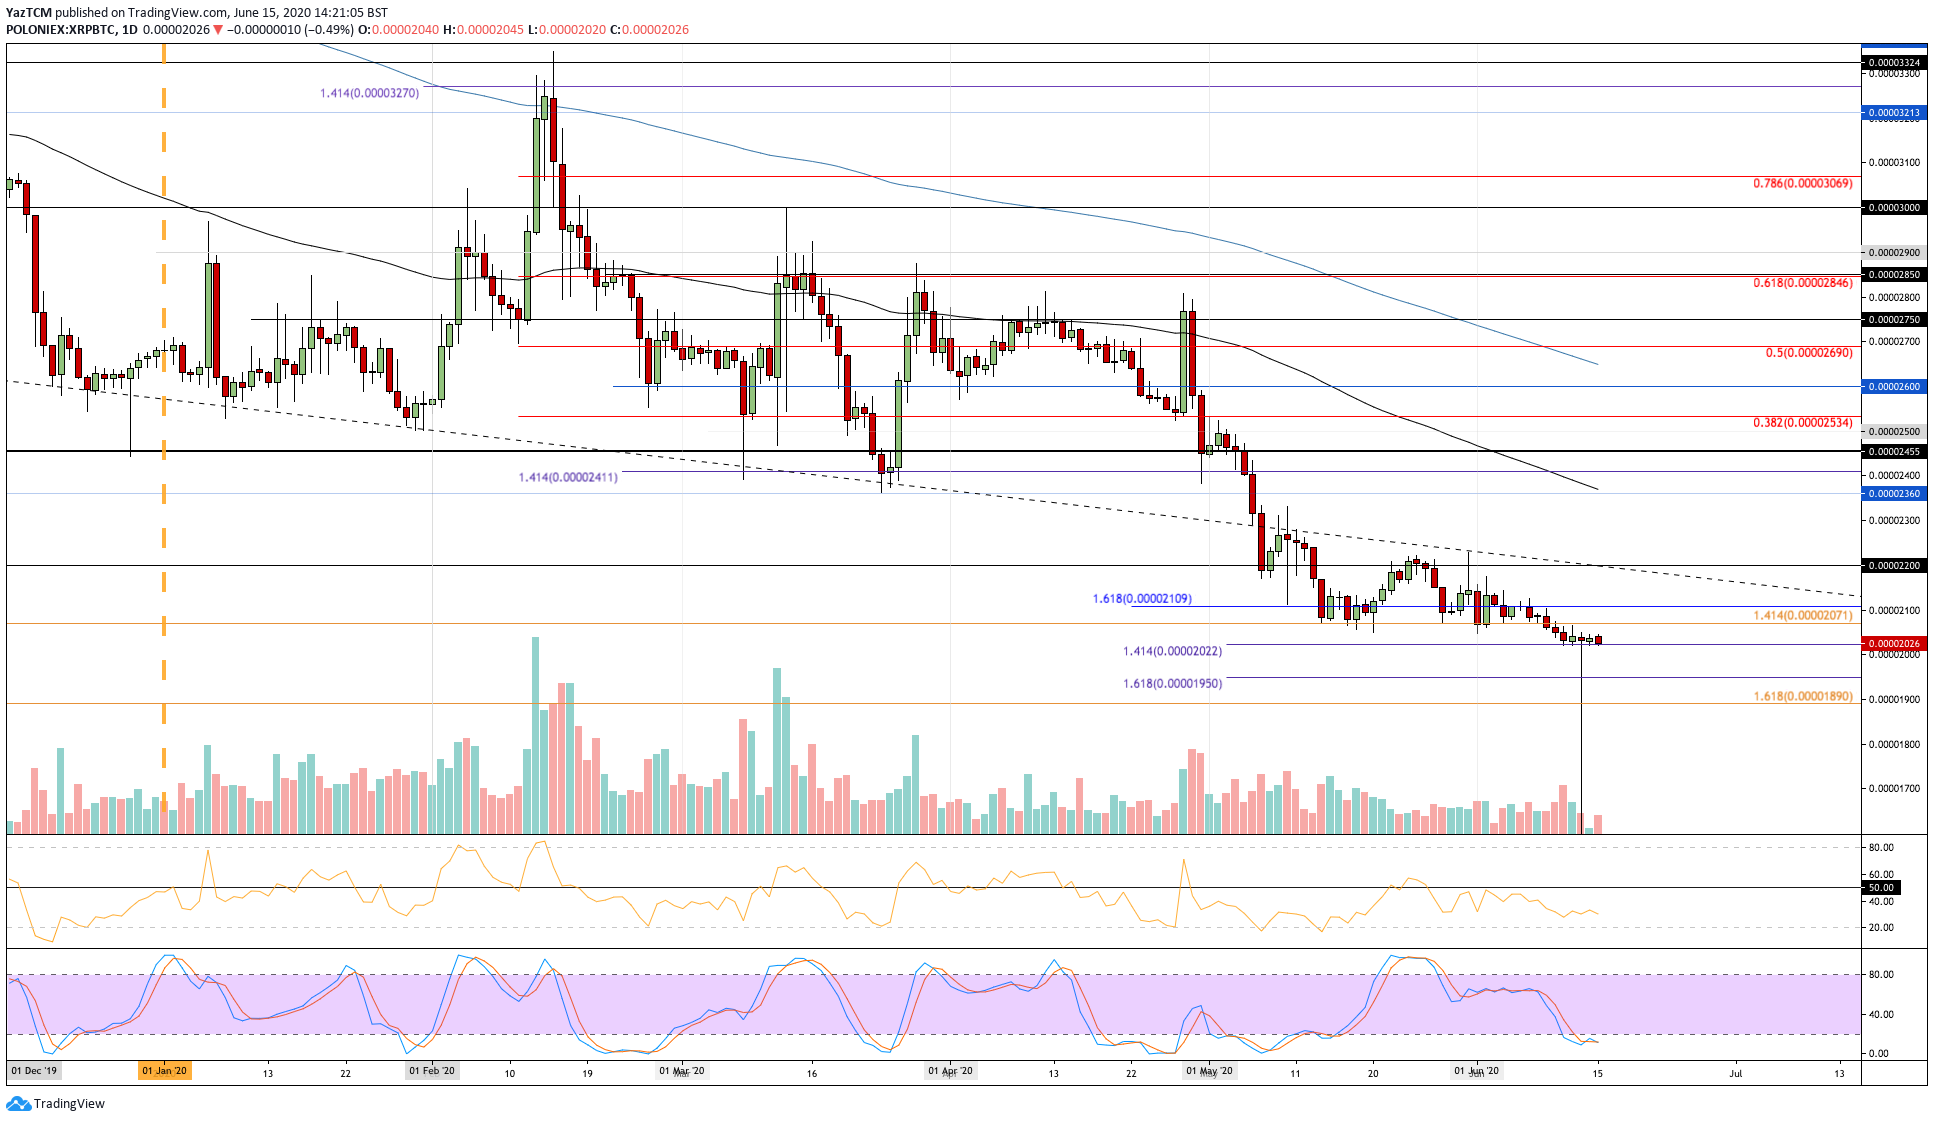
Things are starting to take a turn for the worse against Bitcoin as XRP dropped beneath the strong support at 2071 SAT this week. 2071 SAT had provided ample support for XRP during both May and June, and this break below signals the increasing struggle that the cryptocurrency has been under.
After dropping beneath 2071 SAT, XRP continued to the 2022 SAT support provided by a downside 1.414 Fibonacci Extension level.

XRP-BTC Short Term Price Prediction
If the sellers drive XRP beneath 2022 SAT, the first level of support is expected at 2000 SAT. Beneath this, added support lies at 1950 SAT (downside 1.618 Fib Extension) and 1890 SAT.
On the other side, the first level of resistance is found at 2071 SAT. This is followed by resistance at 2100 SAT and 2200 SAT.
The RSI is beneath the 50 line but is not oversold. The Stochastic RSI is also in oversold conditions and is primed for a bullish crossover signal.
