XRP concludes the week with a minor 2.3% price increase, while Bitcoin increased 5% and Ethereum 7.7%.The cryptocurrency has failed to break above the current range as it faces resistance at %excerpt%.245Against Bitcoin, XRP continues to trade sideways between 2710 SAT and 2640 SAT.Key Support & Resistance LevelsXRP/USD:Support: %excerpt%.235, %excerpt%.227, %excerpt%.22.Resistance: %excerpt%.245, %excerpt%.25, %excerpt%.26.XRP/BTC:Support: 2640 SAT, 2595 SAT, 2550 SAT.Resistance: 2710 SAT, 2750 SAT, 2800 SAT.XRP/USD – Ripple Fails To Break %excerpt%.245Since our last analysis, XRP climbed higher from the marked support at %excerpt%.235; however, it failed to overcome the resistance provided by the upper boundary of the current trading range at %excerpt%.245.XRP has been recently trading between resistance at %excerpt%.245 and support at %excerpt%.22. This has been for
Topics:
Yaz Sheikh considers the following as important: Ripple (XRP) Price, XRP Analysis
This could be interesting, too:
Mandy Williams writes Ripple Releases Institutional DeFi Roadmap for XRP Ledger in 2025
Jordan Lyanchev writes ChatGPT and DeepSeek Analyze Ripple’s (XRP) Price Potential for 2025
CryptoVizArt writes XRP Breakout Imminent? Ripple Price Analysis Suggests a Decisive Move
Dimitar Dzhondzhorov writes 6 Reasons Why This Finance Expert Dumped His Ripple (XRP) Holdings
- XRP concludes the week with a minor 2.3% price increase, while Bitcoin increased 5% and Ethereum 7.7%.
- The cryptocurrency has failed to break above the current range as it faces resistance at $0.245
- Against Bitcoin, XRP continues to trade sideways between 2710 SAT and 2640 SAT.
Key Support & Resistance Levels
XRP/USD:
Support: $0.235, $0.227, $0.22.
Resistance: $0.245, $0.25, $0.26.
XRP/BTC:
Support: 2640 SAT, 2595 SAT, 2550 SAT.
Resistance: 2710 SAT, 2750 SAT, 2800 SAT.
XRP/USD – Ripple Fails To Break $0.245
Since our last analysis, XRP climbed higher from the marked support at $0.235; however, it failed to overcome the resistance provided by the upper boundary of the current trading range at $0.245.
XRP has been recently trading between resistance at $0.245 and support at $0.22. This has been for over 10-days. Just like Bitcoin, XRP is waiting for a decision in the short-term.
The trading volume has been very stagnant and has shown no increase at all during the first week of March, but this could be a sign that a strong move is imminent.

XRP-USD Short Term Price Prediction
If the bulls break $0.245, there will be significant resistance at $0.25 due to the 100-day EMA and a bearish .236 Fib Retracement located at the current level. Above this, resistance lies at $0.26 (200-days EMA) and $0.267 (bearish .382 Fib Retracement).
From below, the first level of support lies at $0.235. Beneath this, support is found at the rising trend line, $0.227, and the lower boundary of the range at $0.22.
The RSI rose higher from oversold conditions but has stalled at the 50 level as indecision mounts within the market. If the RSI turns lower, XRP is likely to drop back toward $0.22 as the sellers increase their momentum.
XRP/BTC – Ripple Trading Sideways Against Bitcoin
XRP is also trading sideways against Bitcoin: between 2710 SAT and 2640 SAT. A breakout is likely to point out the next short-term direction.
The cryptocurrency remains supported by a 5-week ascending trend line. The trading volume is showing some signs of rising here; however, it is still significantly lower than the average volume of past February.
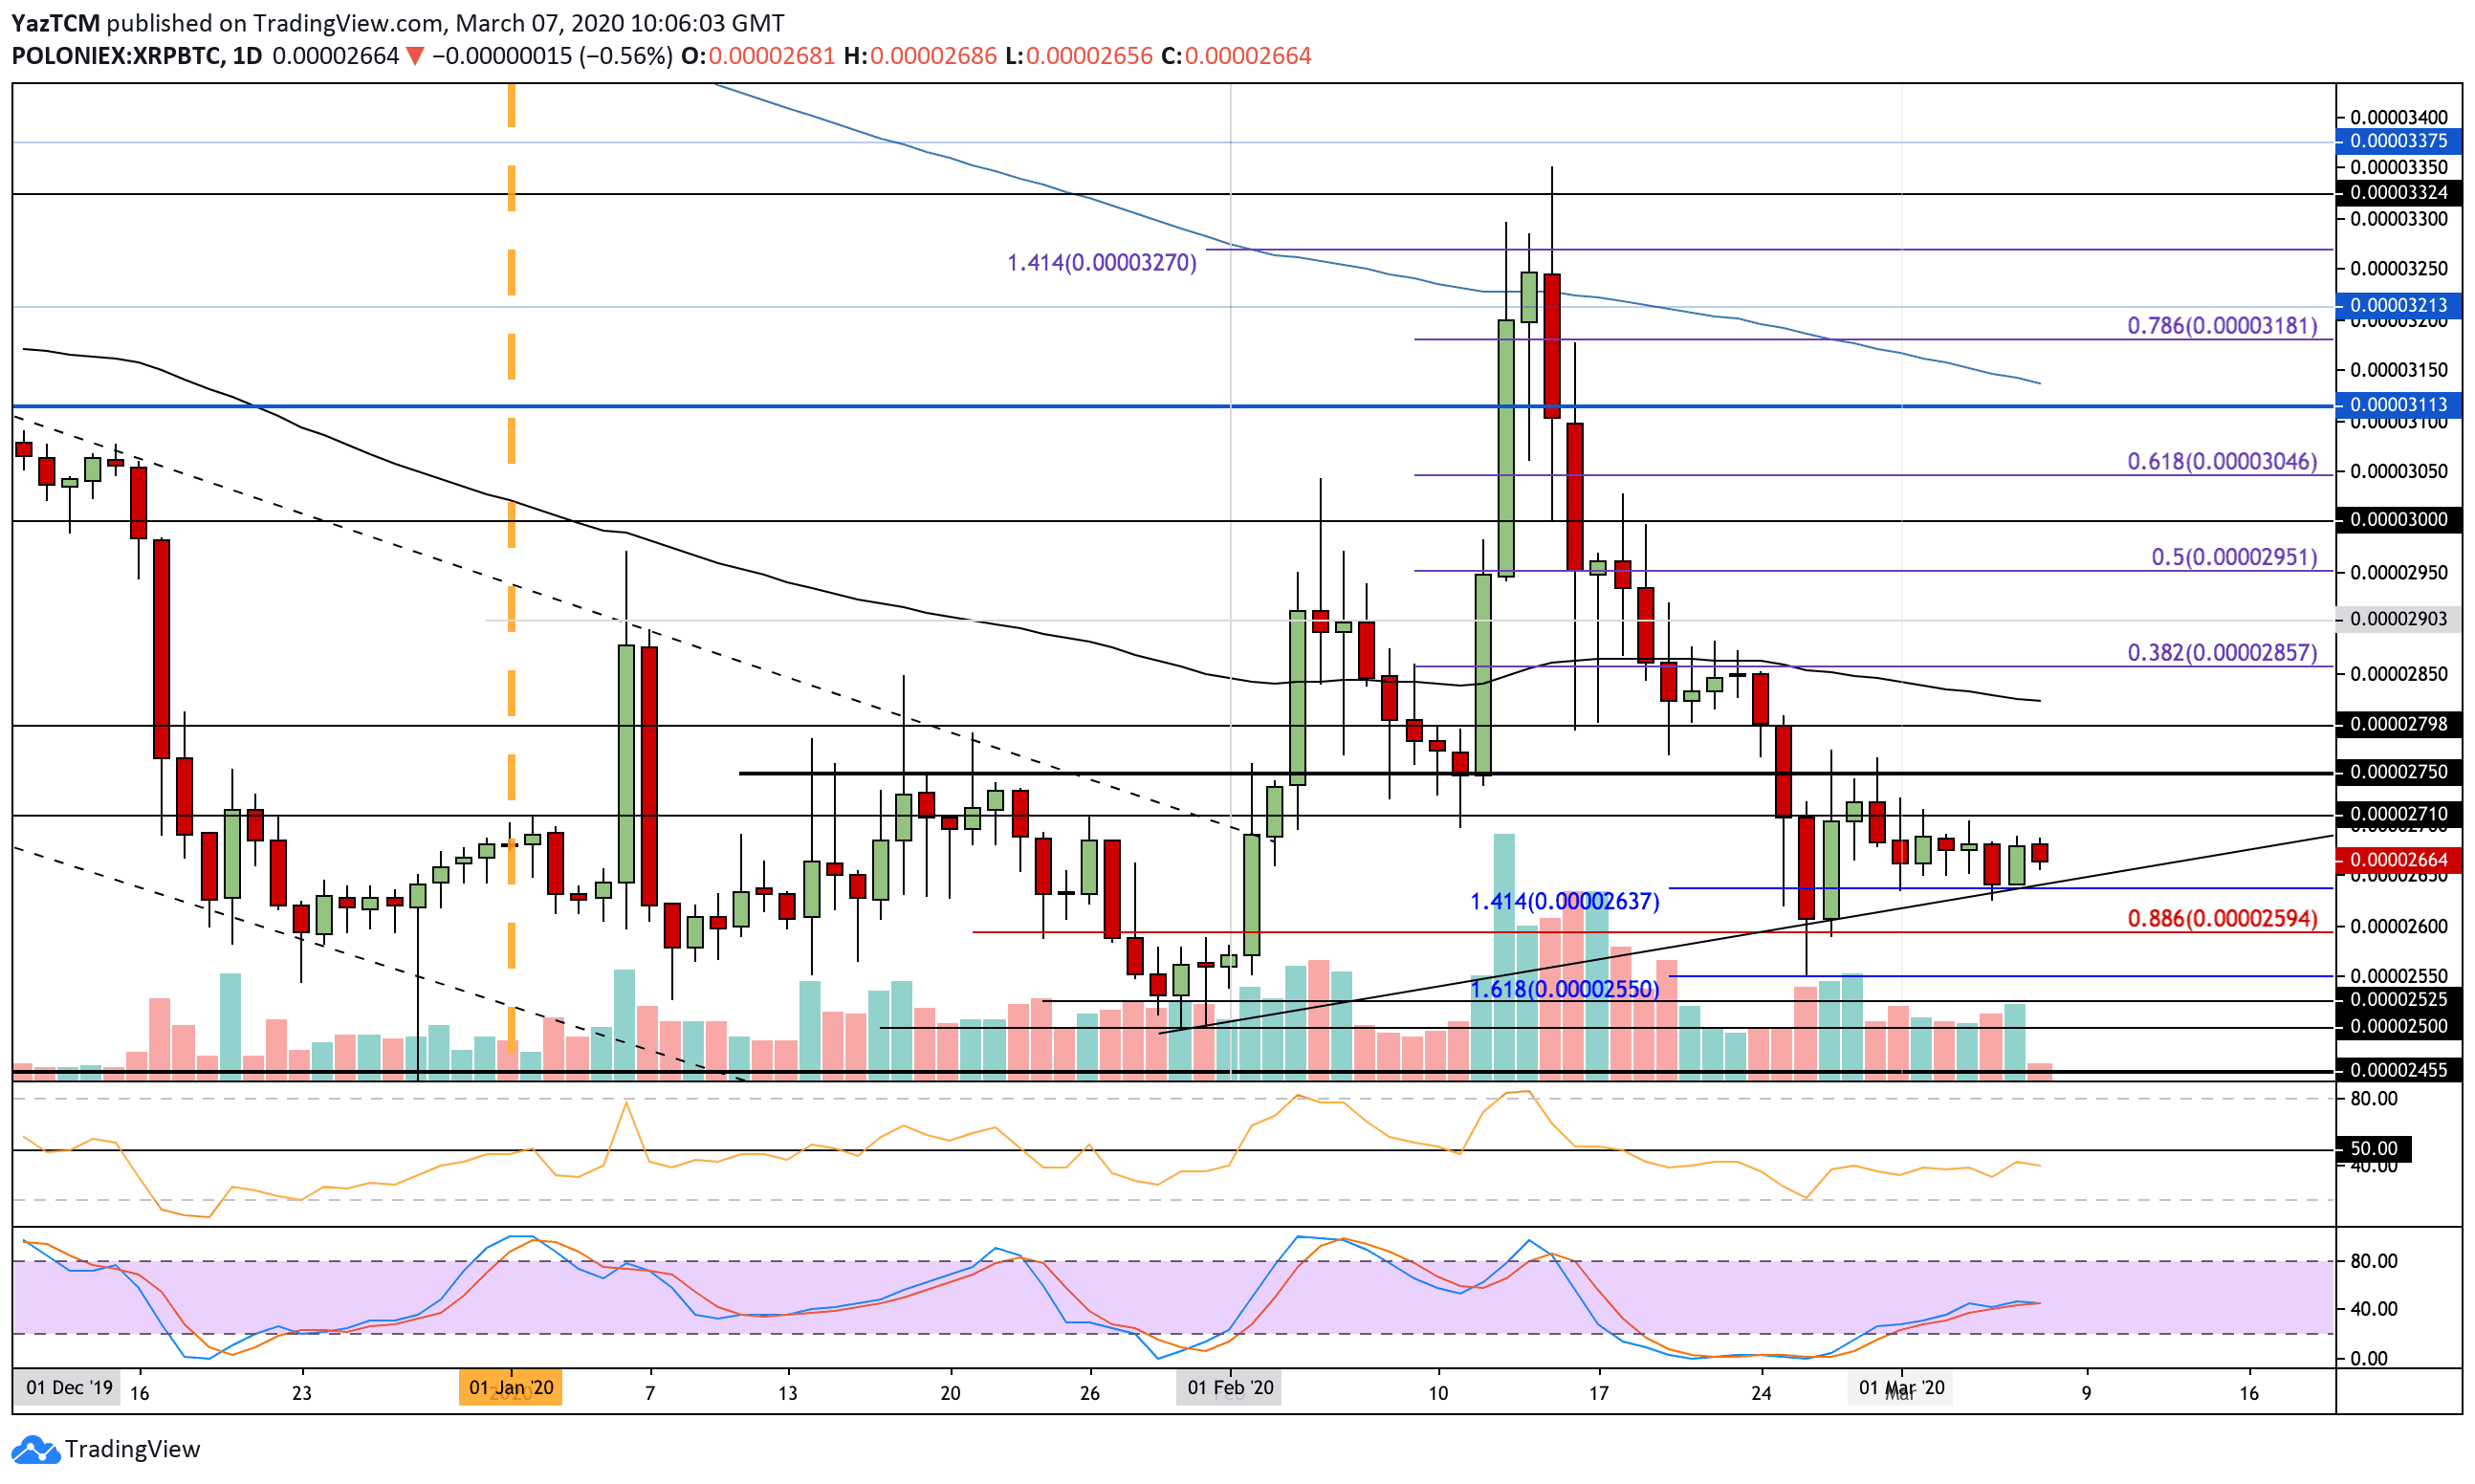
XRP-BTC Short Term Price Prediction
If the bears push lower, support is located at the ascending trend line at 2640 SAT (downside 1.414 Fib Extension). Beneath this, further support lies at 2595 SAT (.886 Fib Retracement) and 2550 SAT (downside 1.618 Fib Extension).
From above, resistance lies at 2710 SAT and 2750 SAT. Further resistance lies at 2800 SAT and 2825 SAT (100-days EMA). The RSI is still beneath the 50 level.