XRP has traded sideways today as it rises by a small 0.15% to reach %excerpt%.1985.The coin is currently battling to climb back above the %excerpt%.20 level.Against Bitcoin, XRP is starting to grind lower after reaching 2200 SAT last week.XRP/USD: XRP Bulls Defending 100-day EMAKey Support Levels: %excerpt%.192, %excerpt%.18, %excerpt%.175.Key Resistance Levels: %excerpt%.20, %excerpt%.21, %excerpt%.215.XRP managed to reach as high as the 200-days EMA last week, as the coin hit the %excerpt%.21 level. From there, XRP started to slowly grind lower over the course of the week and recently fell beneath the %excerpt%.2 level.Luckily, XRP is being supported by the 100-days EMA at %excerpt%.198, which has prevented it from sliding lower. A drop beneath %excerpt%.19 would see XRP headed back to the July lows at %excerpt%.175.XRP/USD. Source: TradingViewXRP-USD Short Term Price
Topics:
Yaz Sheikh considers the following as important: Ripple (XRP) Price, XRP Analysis, xrpbtc, xrpusd
This could be interesting, too:
Jordan Lyanchev writes Ripple’s (XRP) Surge to Triggers Over Million in Short Liquidations
Jordan Lyanchev writes Trump Confirms Work on Strategic Crypto Reserve: XRP, ADA, SOL Included
Dimitar Dzhondzhorov writes Is a Major Ripple v. SEC Lawsuit Development Expected This Week? Here’s Why
Mandy Williams writes Ripple Releases Institutional DeFi Roadmap for XRP Ledger in 2025
- XRP has traded sideways today as it rises by a small 0.15% to reach $0.1985.
- The coin is currently battling to climb back above the $0.20 level.
- Against Bitcoin, XRP is starting to grind lower after reaching 2200 SAT last week.
XRP/USD: XRP Bulls Defending 100-day EMA
Key Support Levels: $0.192, $0.18, $0.175.
Key Resistance Levels: $0.20, $0.21, $0.215.
XRP managed to reach as high as the 200-days EMA last week, as the coin hit the $0.21 level. From there, XRP started to slowly grind lower over the course of the week and recently fell beneath the $0.2 level.
Luckily, XRP is being supported by the 100-days EMA at $0.198, which has prevented it from sliding lower. A drop beneath $0.19 would see XRP headed back to the July lows at $0.175.
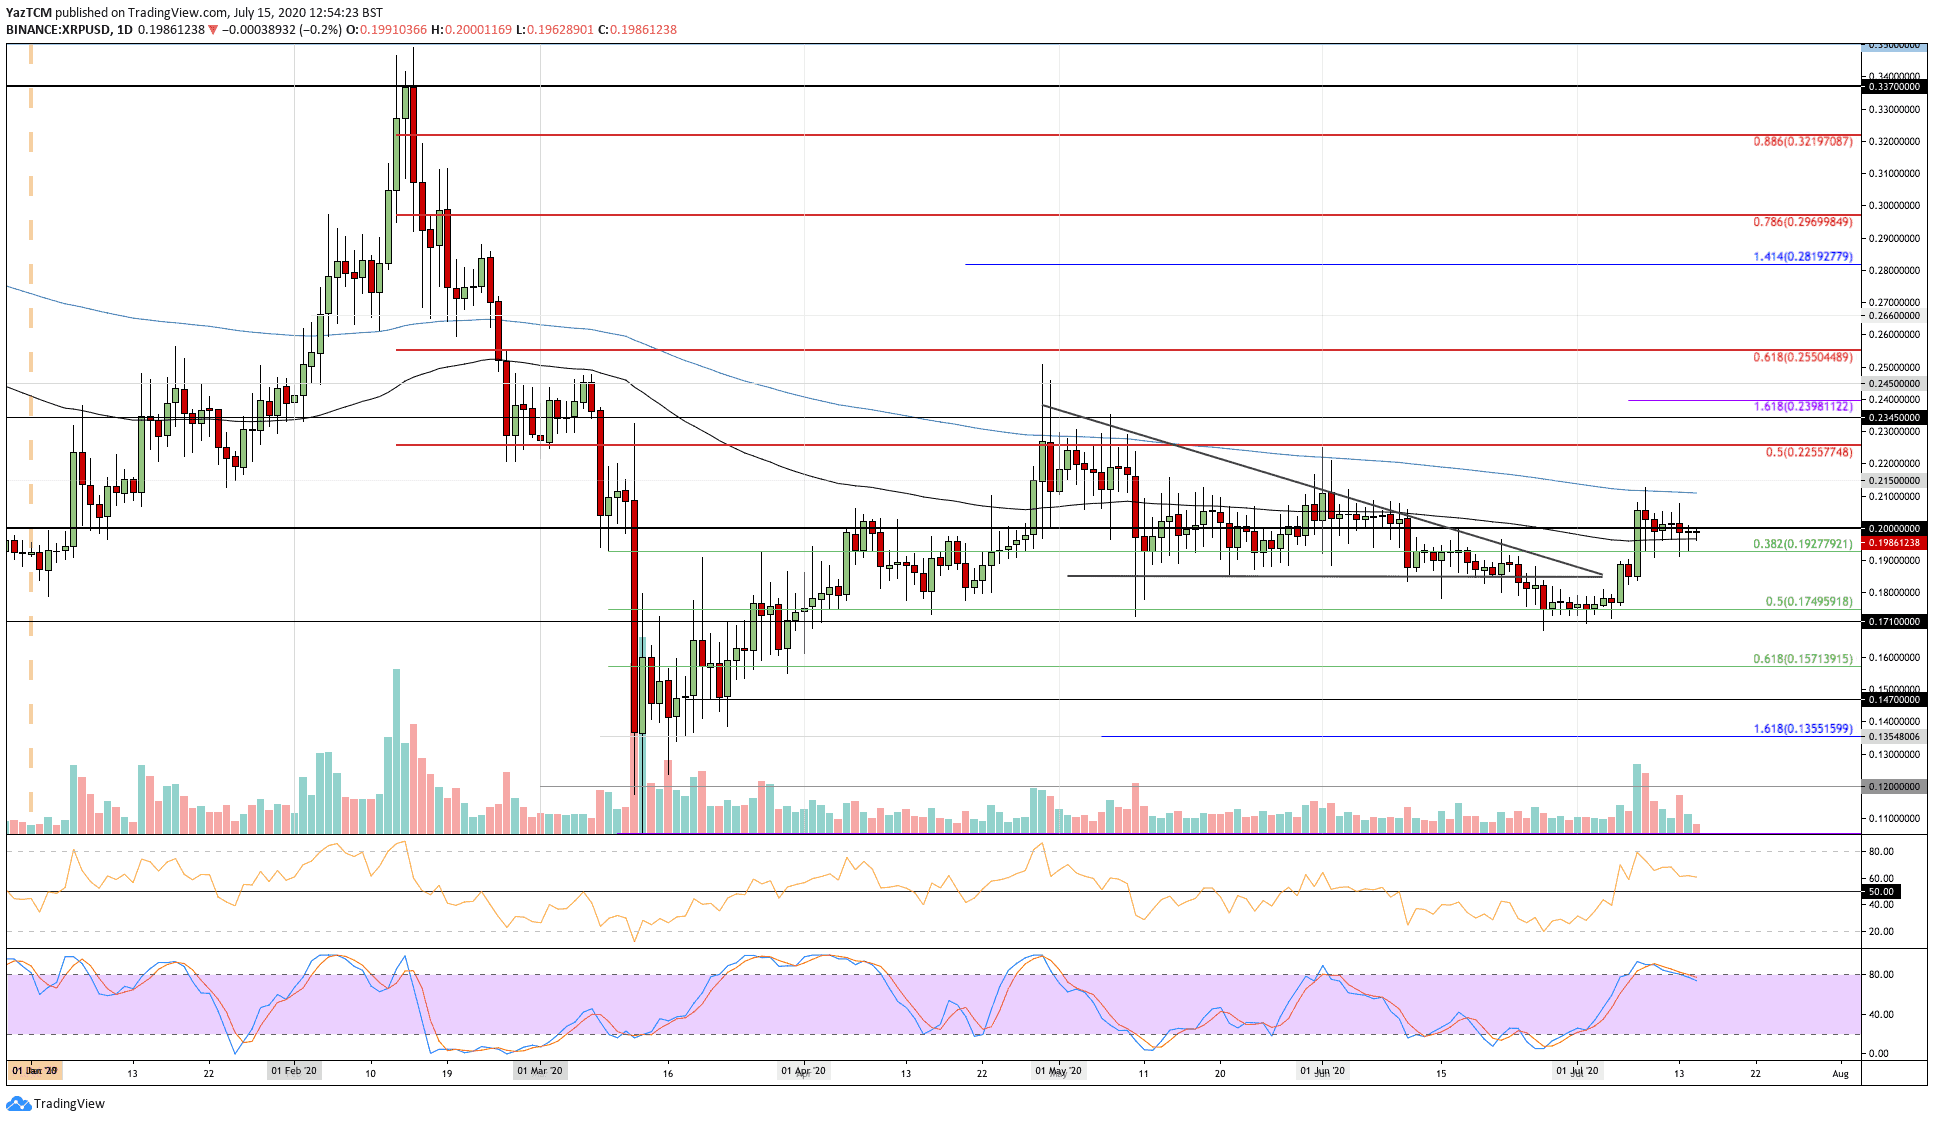
XRP-USD Short Term Price Prediction
Moving forward, if the sellers do push beneath the 100-days EMA level, immediate support is found at $0.192 (.382 Fib Retracement). Beneath this, support lies at $0.18, $0.175 (.5 Fib Retracement), and $0.171.
On the other side, initial resistance lies at $0.2. Above this, resistance is found at $0.21 (200-days EMA), $0.215, and $0.225 (bearish .5 FIb Retracement).
The RSI is above the 50 line to indicate that the bulls are still in charge of the market momentum. However, the Stochastic RSI did produce a bearish crossover signal that will help to send the market lower.
XRP/BTC – XRP Struggle At 2200 SAT Resistance
Key Support Levels: 2100 SAT, 2070 SAT, 2022 SAT.
Key Resistance Levels: 2150 SAT, 2200 SAT, 2250 SAT.
Against Bitcoin, XRP managed to rebound from the 1900 SAT level at the start of the month to push higher into 2200 SAT. XRP did spike as high as 2251 SAT (bearish .236 Fib Retracement), but the coin was unable to hold at this level.
XRP reversed at 2200 SAT and has been slowly pushing lower as it reached 2150 SAT today.

XRP-BTC Short Term Price Prediction
Moving forward, if the buyers can rebound from 2150 SAT, resistance is first located at 2200 SAT. Above this, resistance lies at the 100-days EMA, 2250 SAT (bearish .236 Fib Retracement), and 2300 SAT.
Alternatively, the first level of support is expected at 2100 SAT. Beneath this, support is found at 2070 SAT, 2022 SAT, and 2000 SAT.
The RSI is above the 50 line to indicate bullish momentum. However, the Stochastic RSI has also produced a bearish crossover signal recently.