XRP dropped by 7% over the past 24 hours to bring the price for the coin down to %excerpt%.273.The latest decrease is largely driven by Bitcoin dipping back beneath the ,000 level.Against Bitcoin, XRP fell into support at the 100-days EMA as it battles to remain above.Key Support & Resistance LevelsXRP/USD:Support: %excerpt%.264, %excerpt%.26, 5.Resistance: %excerpt%.289, %excerpt%.3, %excerpt%.31.XRP/BTC:Support: 2800 SAT, 2710 SAT, 2650 SAT.Resistance: 2900 SAT, 3000 SAT, 3115 SAT.XRP/USD: Ripple Remains Above 200-Days EMASince our last analysis, XRP attempted to bounce back above %excerpt%.30 but failed to do so. Instead, it dropped into support at %excerpt%.273 after Bitcoiin tumbled beneath the ,000 level again in yesterday’s trading session.The cryptocurrency manages to stay above the 200-days EMA, which is a strong positive
Topics:
Yaz Sheikh considers the following as important: Ripple (XRP) Price, XRP Analysis
This could be interesting, too:
Jordan Lyanchev writes Ripple’s (XRP) Surge to Triggers Over Million in Short Liquidations
Jordan Lyanchev writes Trump Confirms Work on Strategic Crypto Reserve: XRP, ADA, SOL Included
Mandy Williams writes Ripple Releases Institutional DeFi Roadmap for XRP Ledger in 2025
Jordan Lyanchev writes ChatGPT and DeepSeek Analyze Ripple’s (XRP) Price Potential for 2025
- XRP dropped by 7% over the past 24 hours to bring the price for the coin down to $0.273.
- The latest decrease is largely driven by Bitcoin dipping back beneath the $10,000 level.
- Against Bitcoin, XRP fell into support at the 100-days EMA as it battles to remain above.
Key Support & Resistance Levels
XRP/USD:
Support: $0.264, $0.26, $025.
Resistance: $0.289, $0.3, $0.31.
XRP/BTC:
Support: 2800 SAT, 2710 SAT, 2650 SAT.
Resistance: 2900 SAT, 3000 SAT, 3115 SAT.
XRP/USD: Ripple Remains Above 200-Days EMA
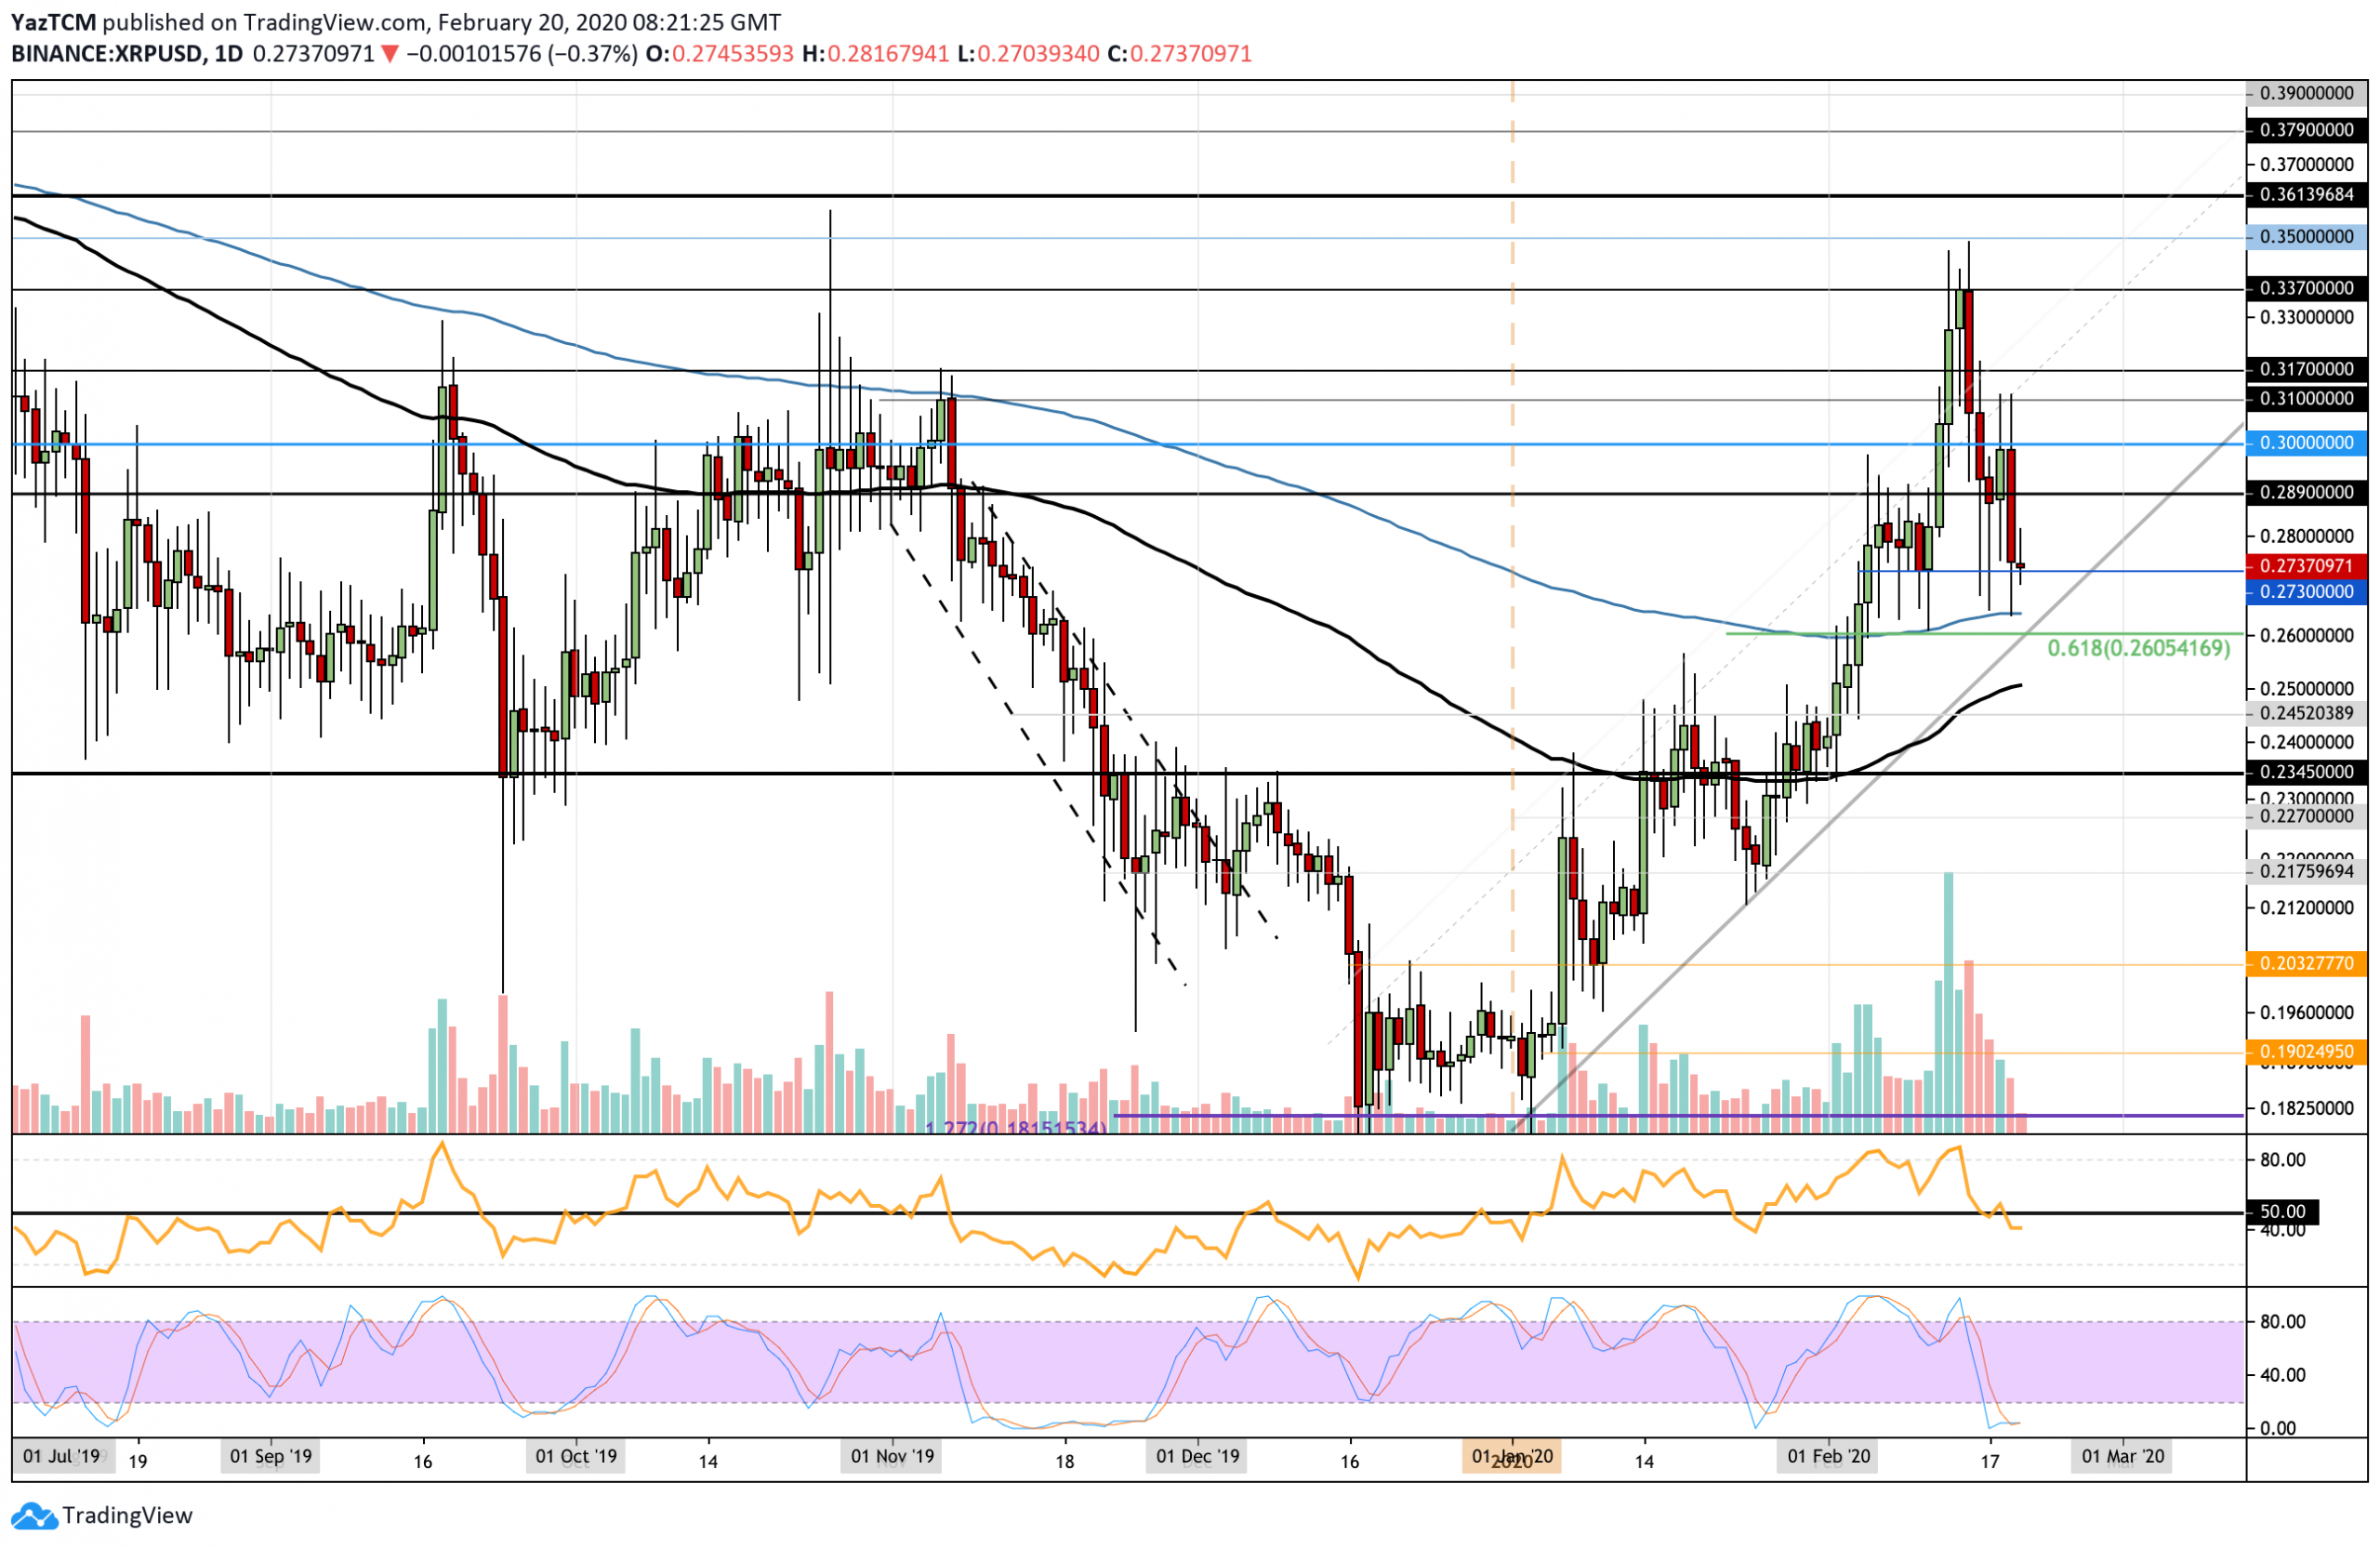
Since our last analysis, XRP attempted to bounce back above $0.30 but failed to do so. Instead, it dropped into support at $0.273 after Bitcoiin tumbled beneath the $10,000 level again in yesterday’s trading session.
The cryptocurrency manages to stay above the 200-days EMA, which is a strong positive sign. However, the bearish pressure has now been prevalent throughout the past week.
XRP is trading in a neutral condition and would need to break $0.30 to begin turning bullish again. A drop beneath $0.26 would put XRP in danger of becoming bearish.

XRP Short Term Price Prediction
If the buyers manage to defend $0.273 and rebound higher, the first level of resistance lies at $0.289. This is followed by resistance at $0.30 and $0.31.
On the other side, if the sellers push below $0.273, the first level of support lies at the 200-days EMA at $0.264. This is followed with additional support at $0.26 (.618 Fib Retracement) and $0.25 (100-days EMA).
The RSI recently broke beneath the 50 level to indicate that the sellers are in control over the market momentum. The Stochastic RSI would need to produce a bullish crossover signal to indicate the bullish pressure is resurging.
XRP/BTC: XRP Battling To Stay Above 100-Days EMA
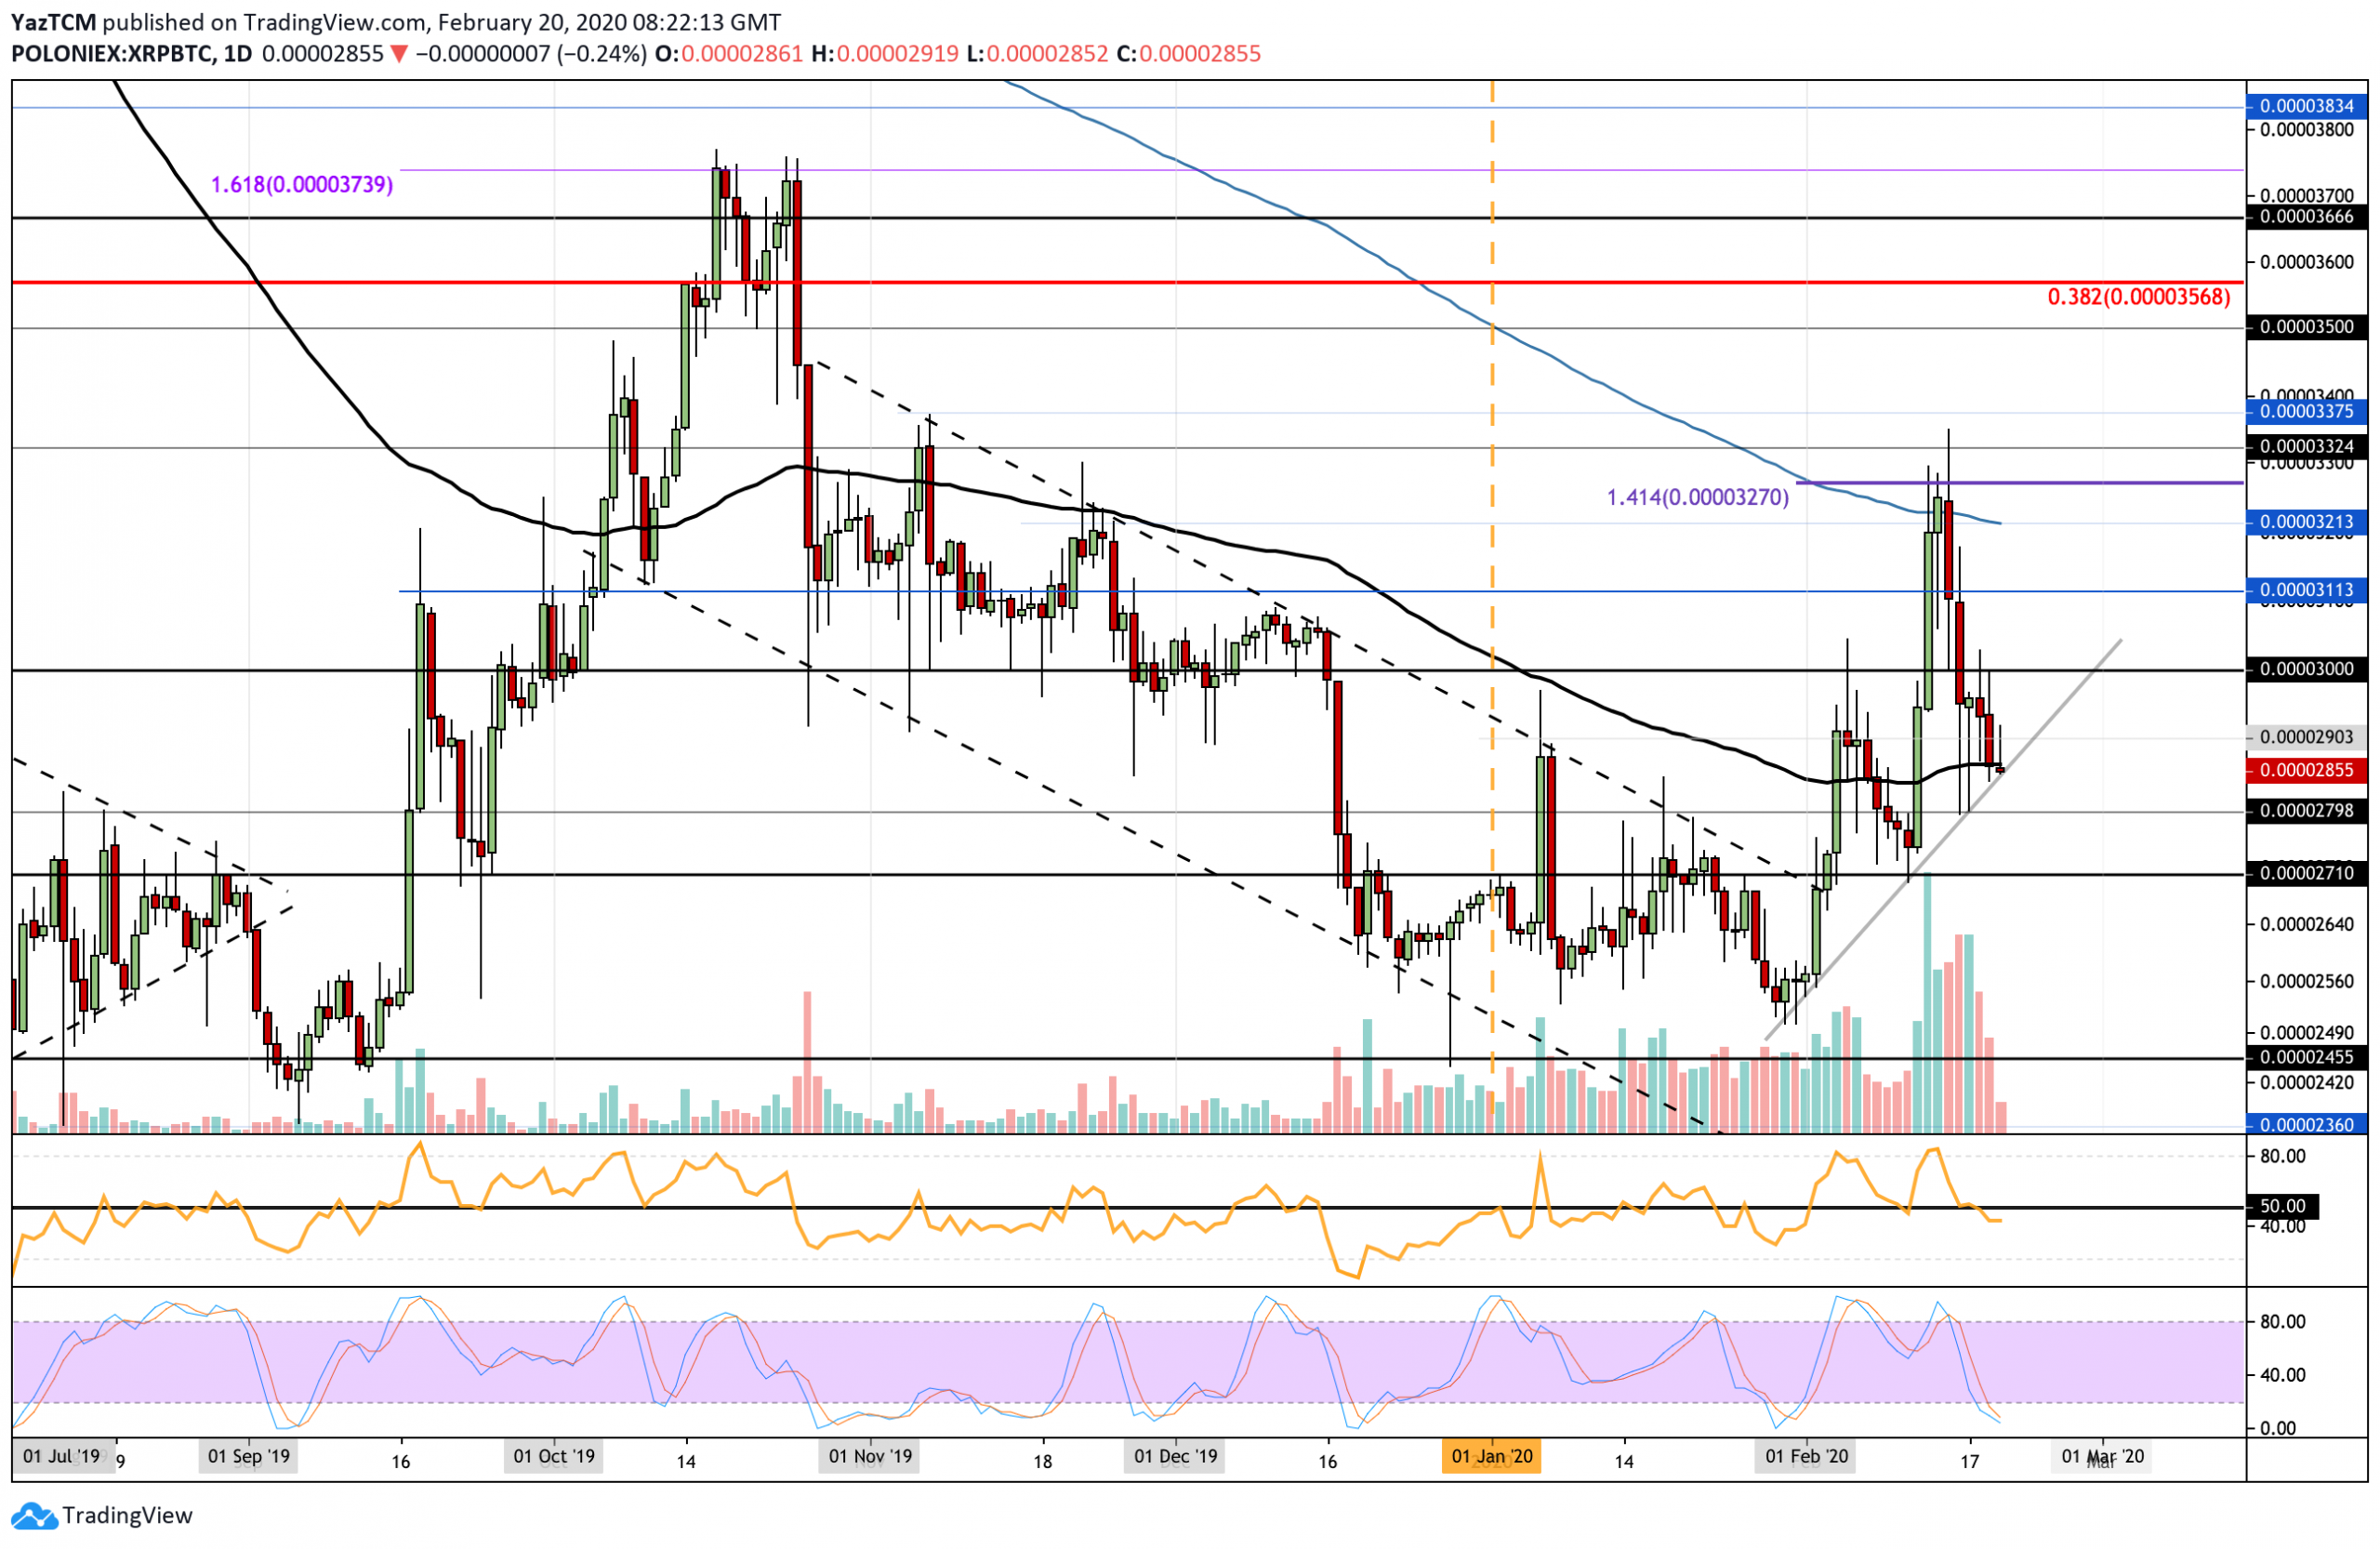
Against Bitcoin, XRP continued to fall beneath the 2900 SAT and dipped below the 100-days EMA as it attempts to remain above a rising trend line.
The momentum is certainly in favor of the bears. XRP is now in danger of turning bearish against Bitcoin, and a drop beneath 2700 SAT could be the catalyst to drive it lower.

XRP Short Term Price Prediction
If the sellers push further lower from 2850 SAT, the first level of support lies at 2800 SAT. Beneath this, additional support is found at 2710 SAT and 2650 SAT. Beneath 2600 SAT, support can be found at 2550 SAT and 2455 SAT.
On the other hand, if the bulls can bounce higher, resistance lies at 2900 SAT, 3000 SAT, and 3115 SAT.
Similarly, the RSI has dipped beneath the 50 level as the bears take control over the market momentum. It would need to break back above 50 for any form of market recovery.
