XRP/USD – Bulls Battling To Defend 100-days EMA Key Support Levels: %excerpt%.24, %excerpt%.23, %excerpt%.228.Key Resistance Levels: %excerpt%.251, %excerpt%.261, %excerpt%.271. XRP struggled to break a falling resistance trend line at the start of the week – close to %excerpt%.26. As a result, the coin started to decline in the past few days. Although it has spiked lower, the buyers have defended the 100-days EMA at the closing price every day this week. The previous triangle has been re-adjusted for the continued sideways movement and XRP is still trading within the boundaries. A break beneath this triangle is likely to send XRP back toward the September lows at %excerpt%.22. XRP/USD Daily Chart. Source: TradingViewXRP-USD Short Term Price Prediction Looking ahead, if the sellers push beneath the 100-days EMA and the lower
Topics:
Yaz Sheikh considers the following as important: Ripple (XRP) Price, XRP Analysis, xrpbtc, xrpusd
This could be interesting, too:
Jordan Lyanchev writes Ripple’s (XRP) Surge to Triggers Over Million in Short Liquidations
Jordan Lyanchev writes Trump Confirms Work on Strategic Crypto Reserve: XRP, ADA, SOL Included
Dimitar Dzhondzhorov writes Is a Major Ripple v. SEC Lawsuit Development Expected This Week? Here’s Why
Mandy Williams writes Ripple Releases Institutional DeFi Roadmap for XRP Ledger in 2025
XRP/USD – Bulls Battling To Defend 100-days EMA
Key Support Levels: $0.24, $0.23, $0.228.
Key Resistance Levels: $0.251, $0.261, $0.271.
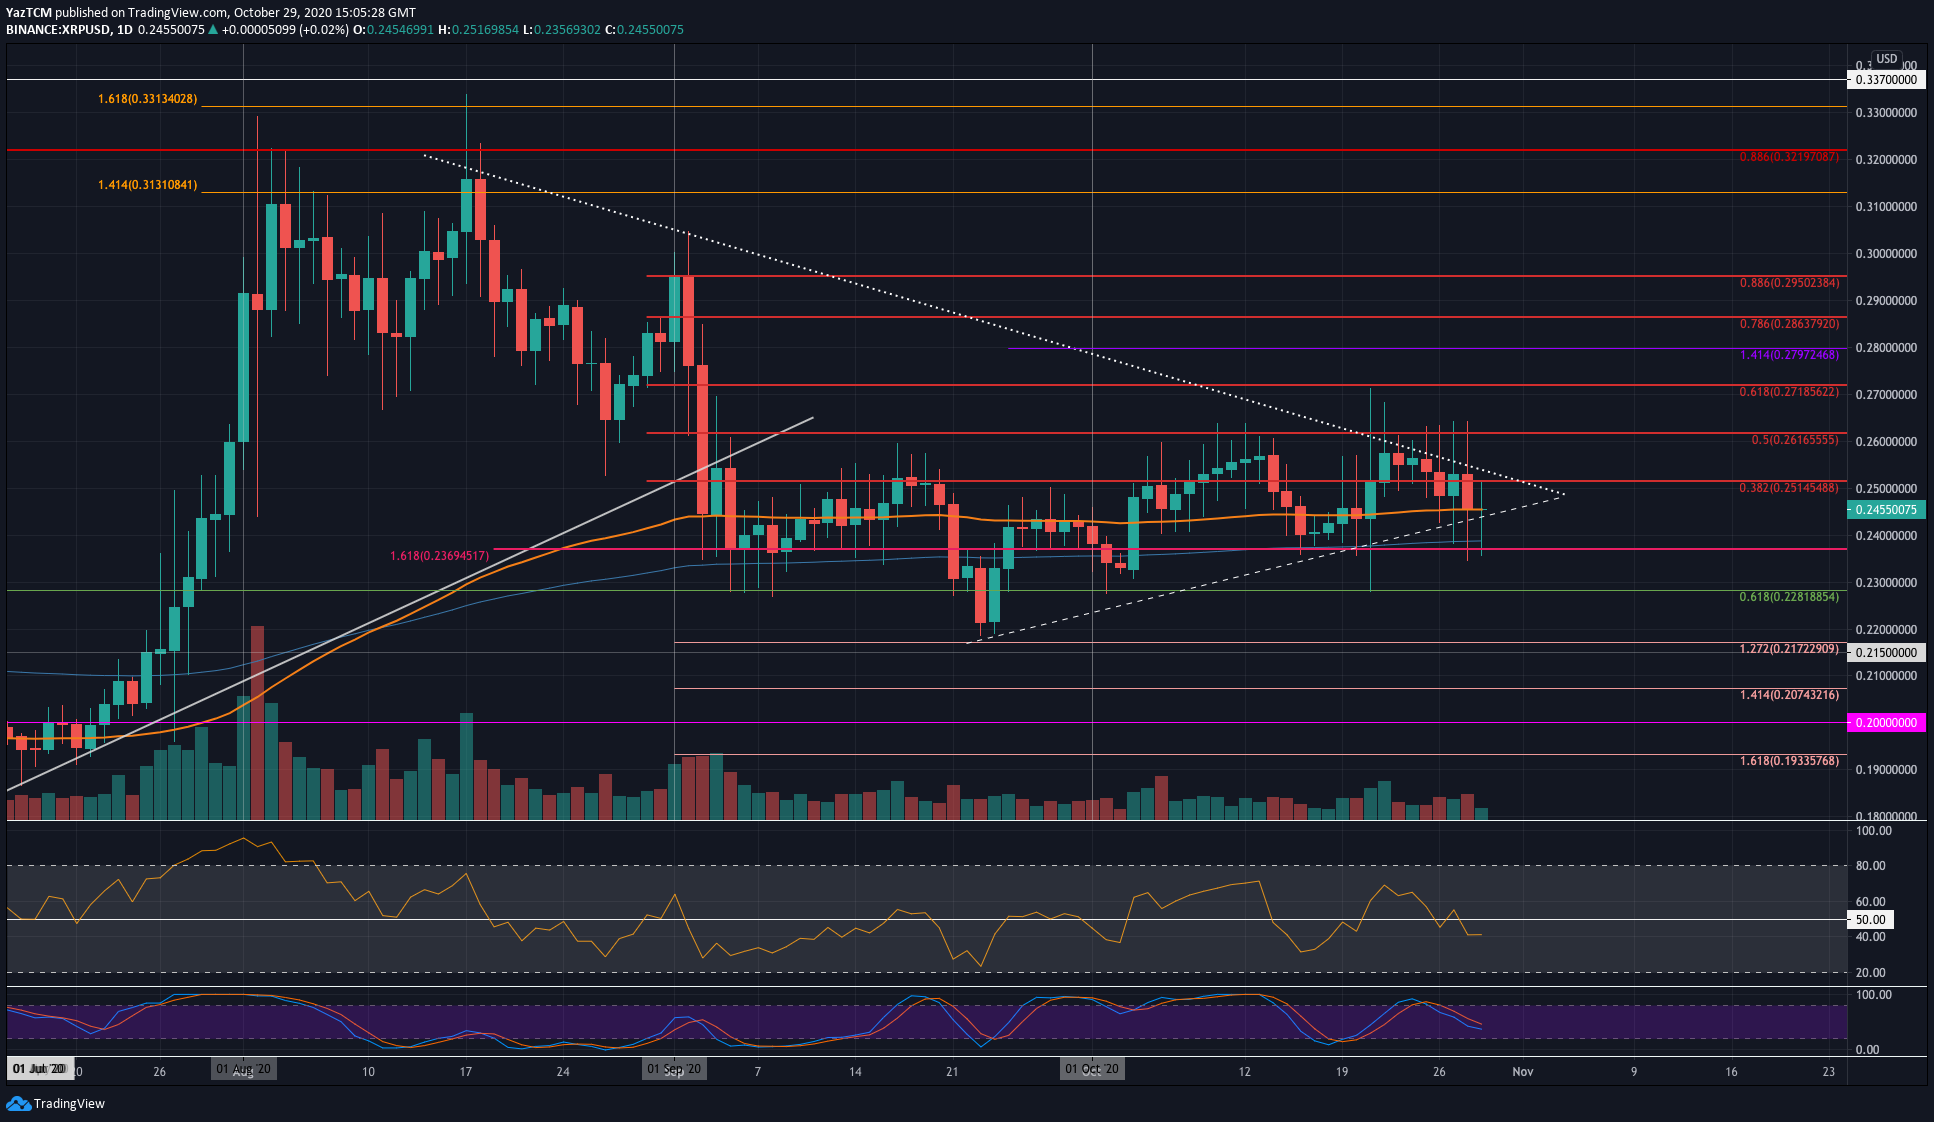
XRP struggled to break a falling resistance trend line at the start of the week – close to $0.26. As a result, the coin started to decline in the past few days. Although it has spiked lower, the buyers have defended the 100-days EMA at the closing price every day this week.
The previous triangle has been re-adjusted for the continued sideways movement and XRP is still trading within the boundaries. A break beneath this triangle is likely to send XRP back toward the September lows at $0.22.

XRP-USD Short Term Price Prediction
Looking ahead, if the sellers push beneath the 100-days EMA and the lower boundary of the triangle, the first level of support lies at $0.24 (200-days EMA). Beneath this, support lies at $0.23, $0.228 (.618 Fib), and $0.22 (September lows).
On the other side, the first level of resistance lies at $0.251 (bearish .382 Fib). Above this, resistance lies at the upper boundary of the triangle, $0.261 (bearish .5 Fib), and $0.271 (bearish .618 Fib).
The RSI has now dipped beneath the mid-line to indicate that the sellers have taken charge of the market momentum. If it continues to fall, the selling momentum will increase and push XRP beneath the 100-days EMA.
XRP/BTC – XRP Hits 34-Month Low Against Bitcoin
Key Support Levels: 1800 SAT, 1780 SAT, 1755 SAT.
Key Resistance Levels: 1865 SAT, 1900 SAT, 1950 SAT.
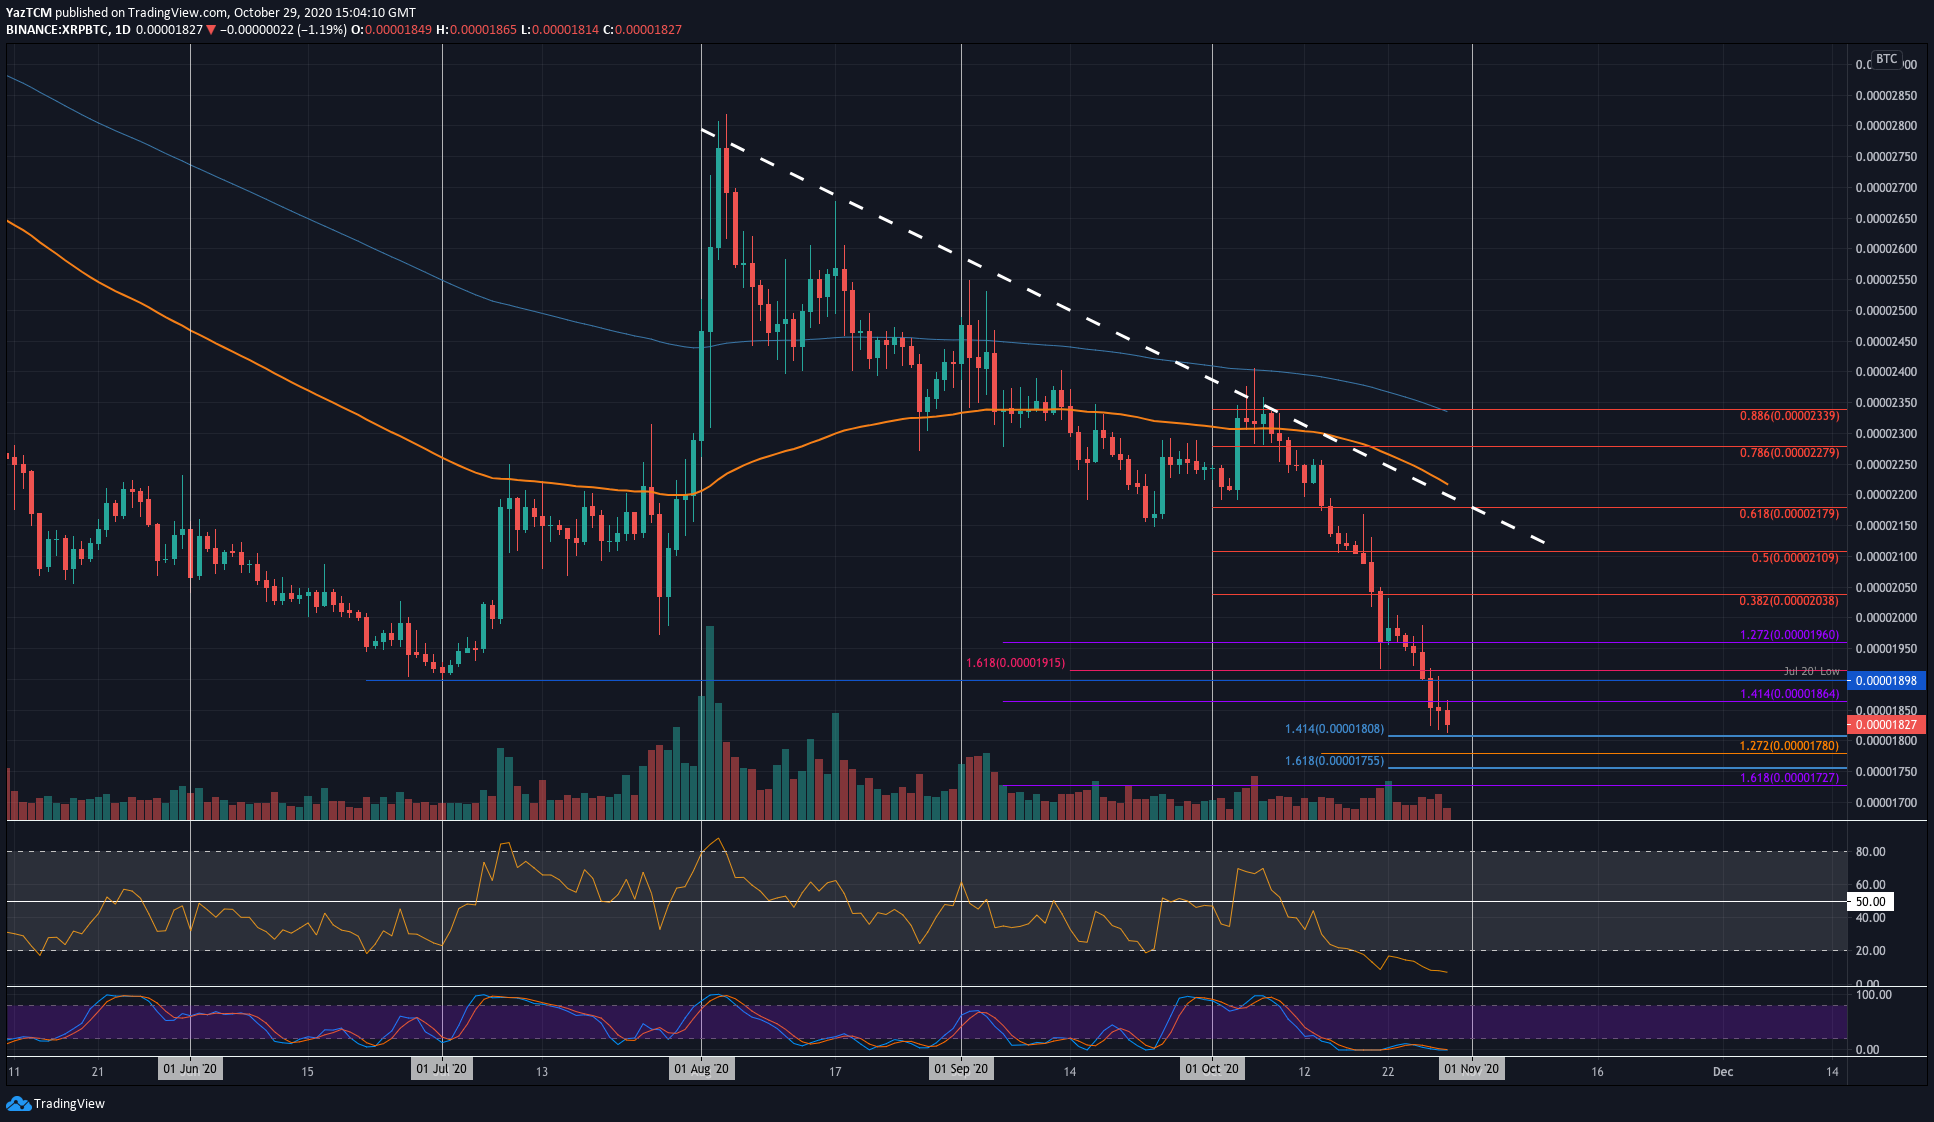
The situation for XRP against BTC is in a totally different scenario. The coin dropped beneath the support at 1950 SAT a couple of days ago and headed toward the 1810 SAT level today. In doing so, XRP has now reached lows that have not been seen since December 2017.
With the coin looking so bearish, it is unlikely that the downtrend will stop here, and we are likely to see it heading toward 1700 SAT over the coming days.

XRP-BTC Short Term Price Prediction
Looking ahead, once the sellers push past 1810 SAT and break beneath 1800 SAT, the first level of support lies at 1780 SAT. Beneath this, added support lies at 1755 SAT, 1730 SAT, and 1700 SAT.
On the other side, the first level of resistance lies at 1865 SAT. This is followed by resistance at 1900 SAT (July 20’ Low), 1950 SAT, and 2000 SAT.
Both the RSI and Stochastic RSI are incredibly oversold. A bullish crossover on the Stochastic RSI would be the first signal that the coin is ready to rebound.
