XRP/USD – Bulls Remain Inside Symmetrical Triangle Pattern Key Support Levels: %excerpt%.237, %excerpt%.23, %excerpt%.228. Key Resistance Levels: %excerpt%.251, %excerpt%.261, %excerpt%.271. XRP has not been outperforming over the past seven days, but it remains inside the boundaries of a symmetrical triangle. The coin failed to break the upper boundary last week, which caused it to head into the support at the lower boundary. It rebounded at the lower boundary but has struggled to remain above the 100-days EMA at around %excerpt%.243. XRP spiked higher yesterday and over the past hours, but the bears have banded together to suppress the price beneath the 100-days EMA. The next direction for XRP will be dictated by the direction in which price breaks the symmetrical triangle, as shown in the following chart. A break
Topics:
Yaz Sheikh considers the following as important: Ripple (XRP) Price, XRP Analysis, xrpbtc, xrpusd
This could be interesting, too:
Jordan Lyanchev writes Ripple’s (XRP) Surge to Triggers Over Million in Short Liquidations
Jordan Lyanchev writes Trump Confirms Work on Strategic Crypto Reserve: XRP, ADA, SOL Included
Dimitar Dzhondzhorov writes Is a Major Ripple v. SEC Lawsuit Development Expected This Week? Here’s Why
Mandy Williams writes Ripple Releases Institutional DeFi Roadmap for XRP Ledger in 2025
XRP/USD – Bulls Remain Inside Symmetrical Triangle Pattern
Key Support Levels: $0.237, $0.23, $0.228.
Key Resistance Levels: $0.251, $0.261, $0.271.
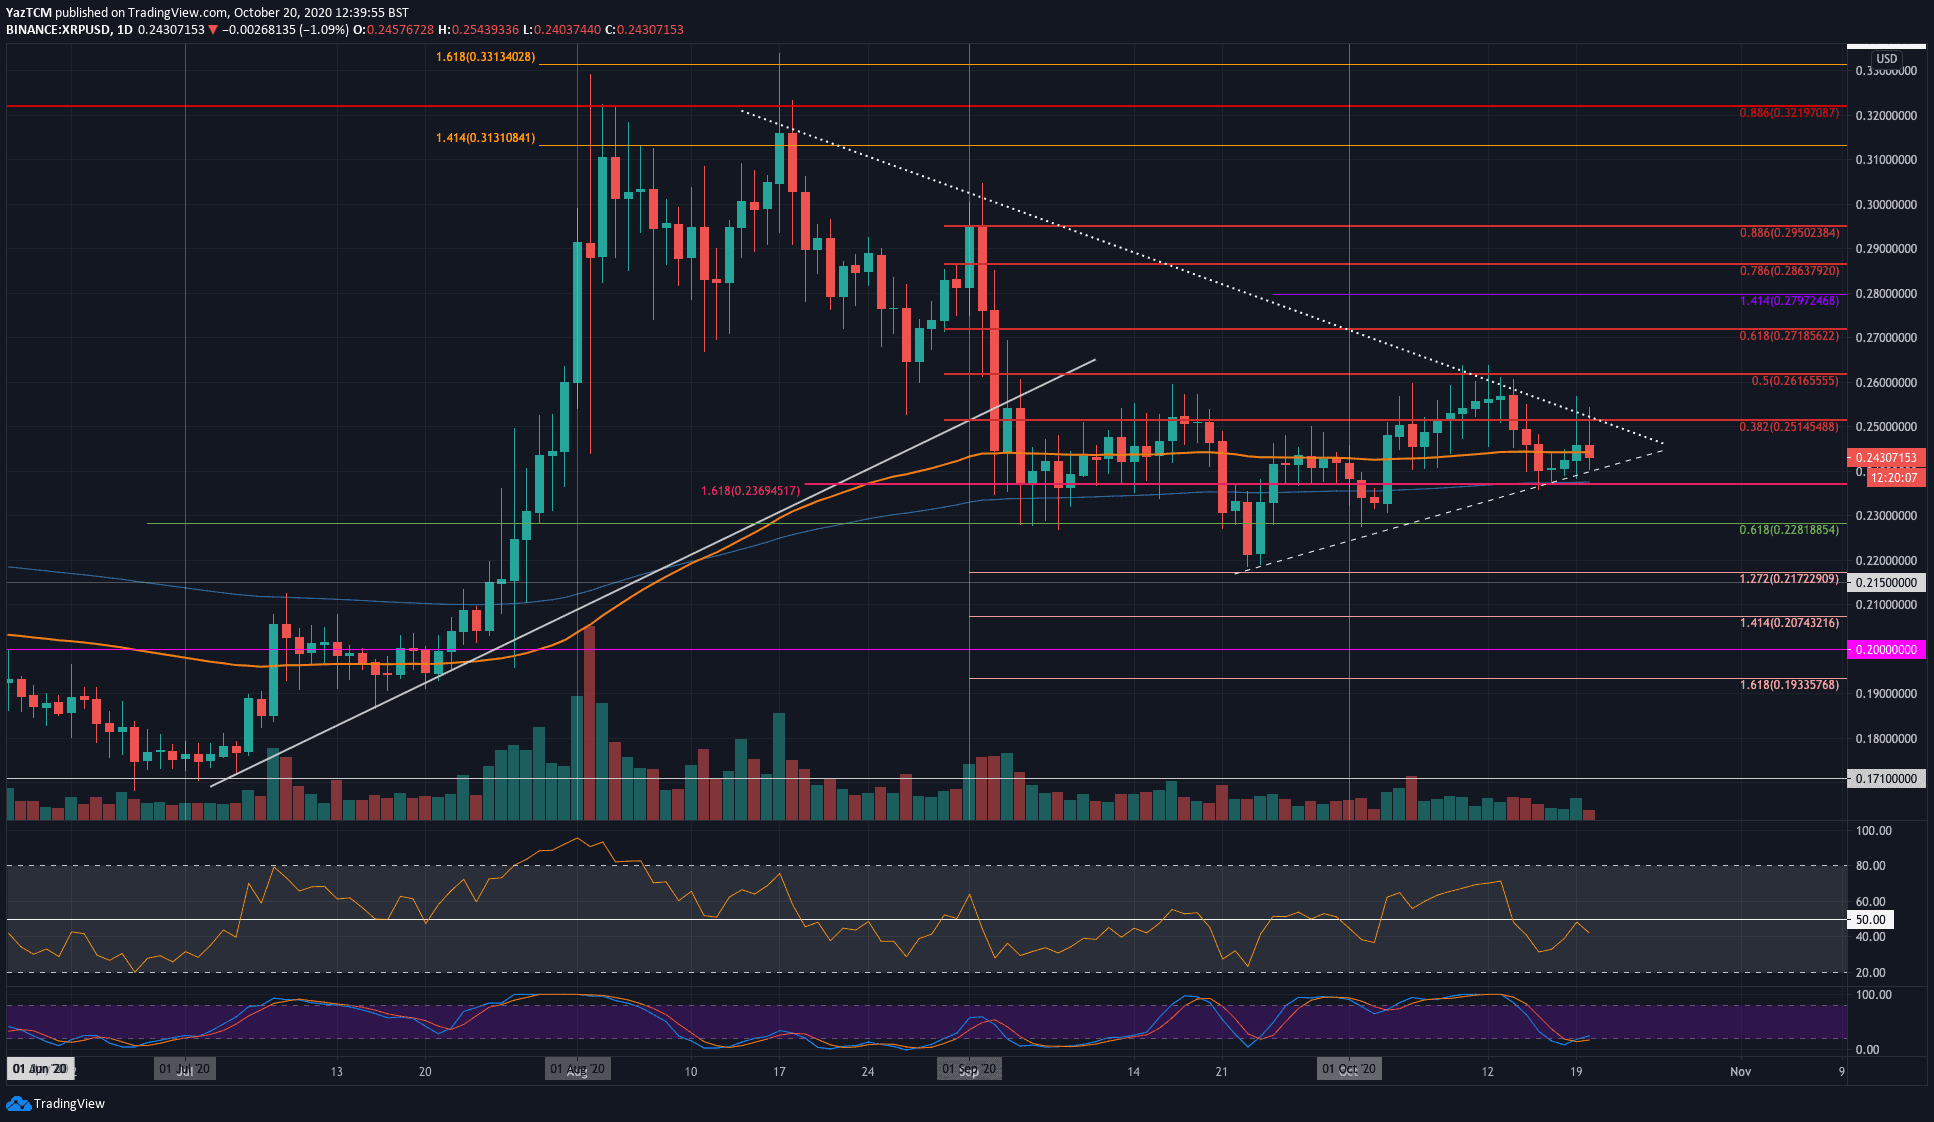
XRP has not been outperforming over the past seven days, but it remains inside the boundaries of a symmetrical triangle. The coin failed to break the upper boundary last week, which caused it to head into the support at the lower boundary.
It rebounded at the lower boundary but has struggled to remain above the 100-days EMA at around $0.243. XRP spiked higher yesterday and over the past hours, but the bears have banded together to suppress the price beneath the 100-days EMA.
The next direction for XRP will be dictated by the direction in which price breaks the symmetrical triangle, as shown in the following chart. A break toward the upside would result in XRP heading higher toward $0.26, but a break to the downside could see XRP heading back toward $0.215.
XRP-USD Short Term Price Prediction
Looking ahead, the first level of resistance is located at the 100-days EMA. Above this, resistance lies at the upper boundary of the triangle, at around $0.251, where the bearish .382 Fib Retracement level lies.
Above this, resistance is located at $0.261 (bearish .5 Fib Retracement), $0.271 (bearish .618 Fib Retracement), and $0.28 (1.414 Fib Extension).
On the other side, the first level of support lies at the lower boundary of the triangle. Beneath this, support lies at $0.237 (200-days EMA), $0.23, and $0.228 (.618 Fib Retracement).
From a technical standpoint, the Stochastic RSI has produced a bullish crossover signal in oversold territory, which could lead to some positive momentum.
XRP/BTC – Is XRP Heading Beneath 2000 SAT?
Key Support Levels: 2050 SAT, 2022 SAT, 2000 SAT.
Key Resistance Levels: 2100 SAT, 2142 SAT, 2200 SAT.
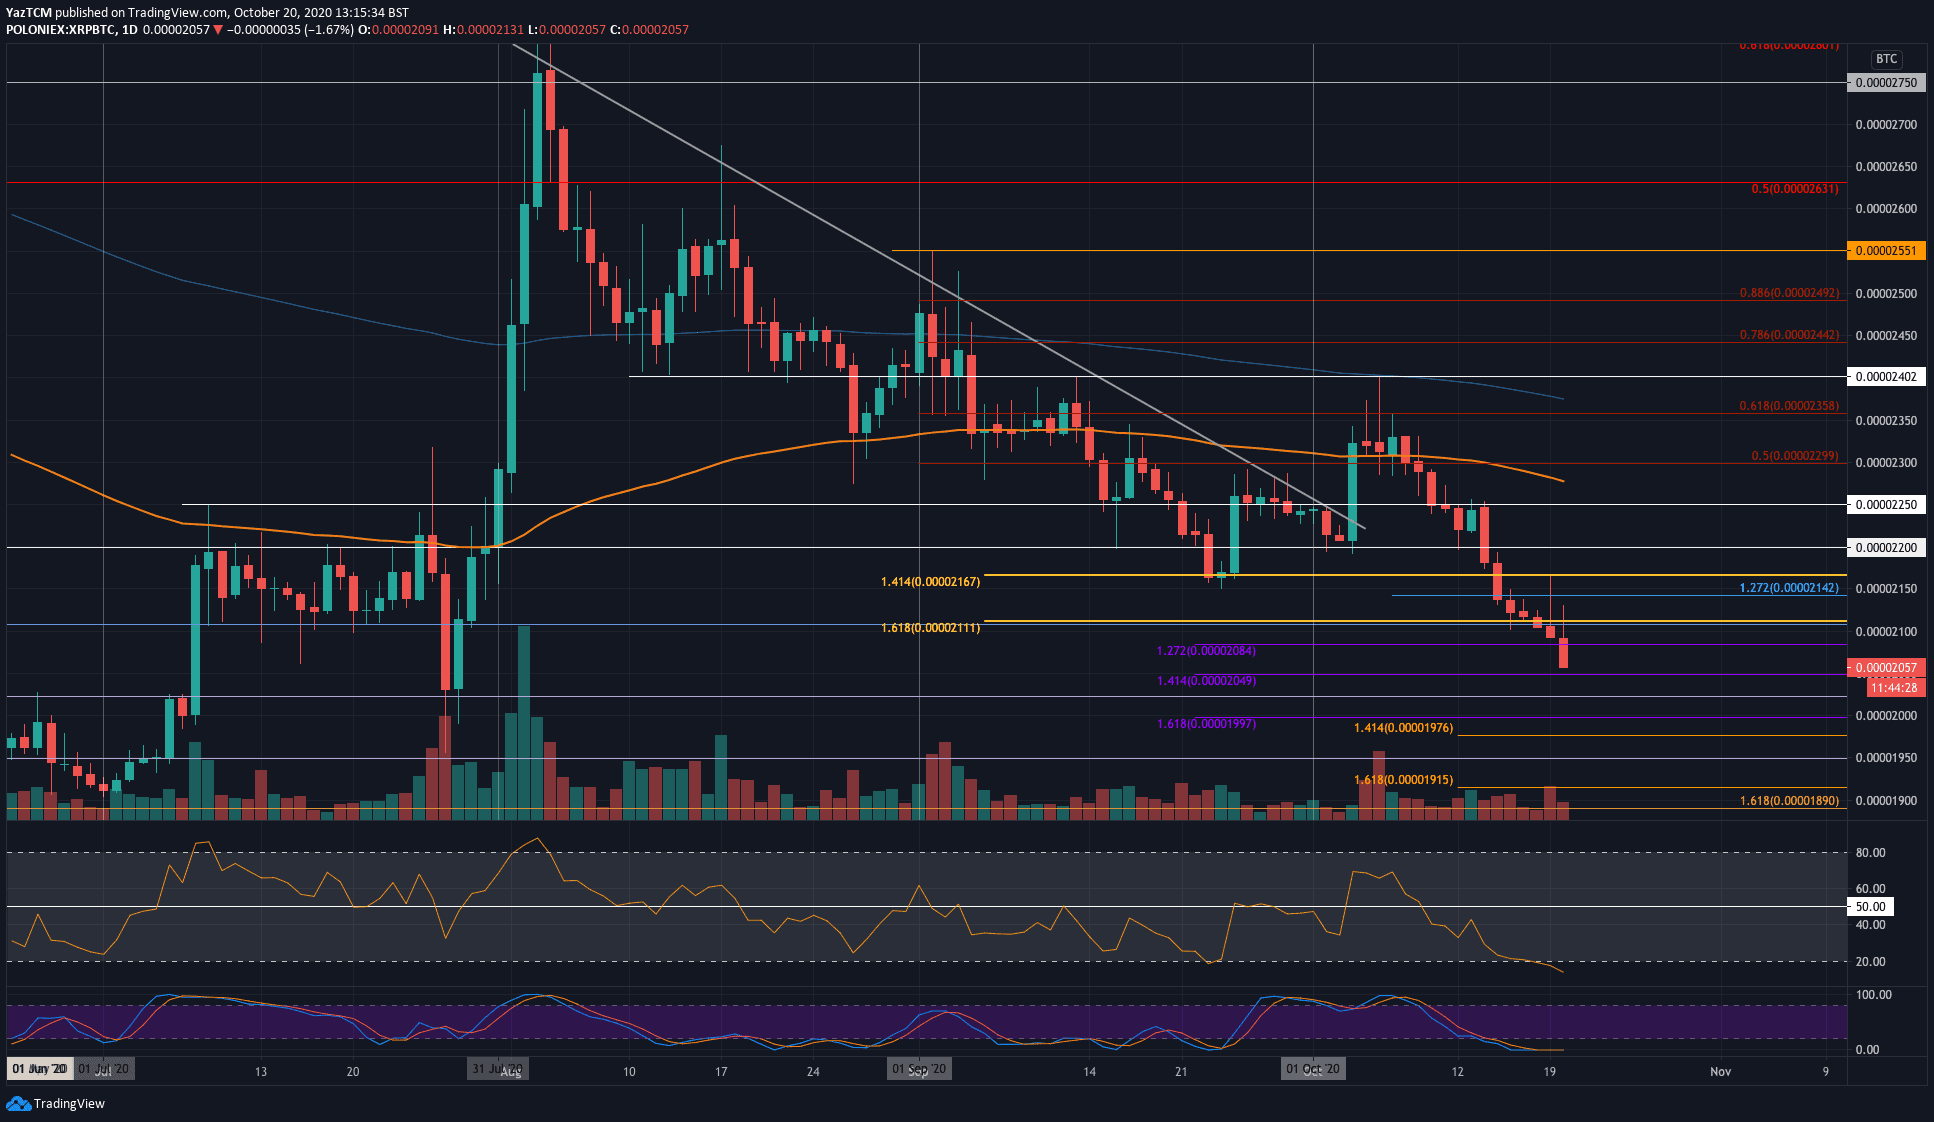
XRP struggles heavily against Bitcoin after it dropped beneath the 2100 SAT level today to create a fresh 3-month low at the 2057 SAT level. The last time XRP/BTC was at that low was on July 28, 2020.
At the start of October, XRP attempted to push higher against BTC but was stalled by the 200-days EMA at around 2400 SAT.
From there, XRP headed lower throughout the month to reach 2057 SAT today, and it is likely to head further still.
XRP-BTC Short Term Price Prediction
Looking ahead, the first level of support lies in the 2050 SAT area (downside 1.414 Fib Extension). Following this, support lies at 2022 SAT, 2000 SAT, and 1975 SAT.
On the other side, the first level of resistance now lies at 2100 SAT. Above this, resistance is expected at 2142 SAT, 2200 SAT, and 2250 SAT.
Both the RSI and Stochastic RSI are in extremely oversold territory, suggesting that the sellers are slightly overextended at this point.