XRP dropped by a total of 3% today as the cryptocurrency falls beneath the %excerpt%.17 level.The coin managed to break above the previous ascending triangle but fell from resistance at %excerpt%.191.Against Bitcoin, XRP increased by 13% over the past 2-days as it trades at 2710 SAT.Key Support & Resistance LevelsXRP/USD:Support: %excerpt%.156, %excerpt%.147, %excerpt%.136.Resistance: %excerpt%.182, %excerpt%.191, %excerpt%.20.XRP/BTC:Support: 2650 SAT, 2600 SAT, 2525 SAT.Resistance: 2760 SAT, 2800 SAT, 2850 SAT.XRP/USD – Ripple Rise Stalled By Bearish .618 Fib Retracement.XRP managed to break above the previous ascending triangle over the past 2-days but failed to climb above resistance at %excerpt%.191, which is provided by a bearish .618 Fib Retracement. At the time of this writing, XRP trades at %excerpt%.169.The cryptocurrency is back beneath the
Topics:
Yaz Sheikh considers the following as important: Ripple (XRP) Price, XRP Analysis
This could be interesting, too:
Mandy Williams writes Ripple Releases Institutional DeFi Roadmap for XRP Ledger in 2025
Jordan Lyanchev writes ChatGPT and DeepSeek Analyze Ripple’s (XRP) Price Potential for 2025
CryptoVizArt writes XRP Breakout Imminent? Ripple Price Analysis Suggests a Decisive Move
Dimitar Dzhondzhorov writes 6 Reasons Why This Finance Expert Dumped His Ripple (XRP) Holdings
- XRP dropped by a total of 3% today as the cryptocurrency falls beneath the $0.17 level.
- The coin managed to break above the previous ascending triangle but fell from resistance at $0.191.
- Against Bitcoin, XRP increased by 13% over the past 2-days as it trades at 2710 SAT.
Key Support & Resistance Levels
XRP/USD:
Support: $0.156, $0.147, $0.136.
Resistance: $0.182, $0.191, $0.20.
XRP/BTC:
Support: 2650 SAT, 2600 SAT, 2525 SAT.
Resistance: 2760 SAT, 2800 SAT, 2850 SAT.
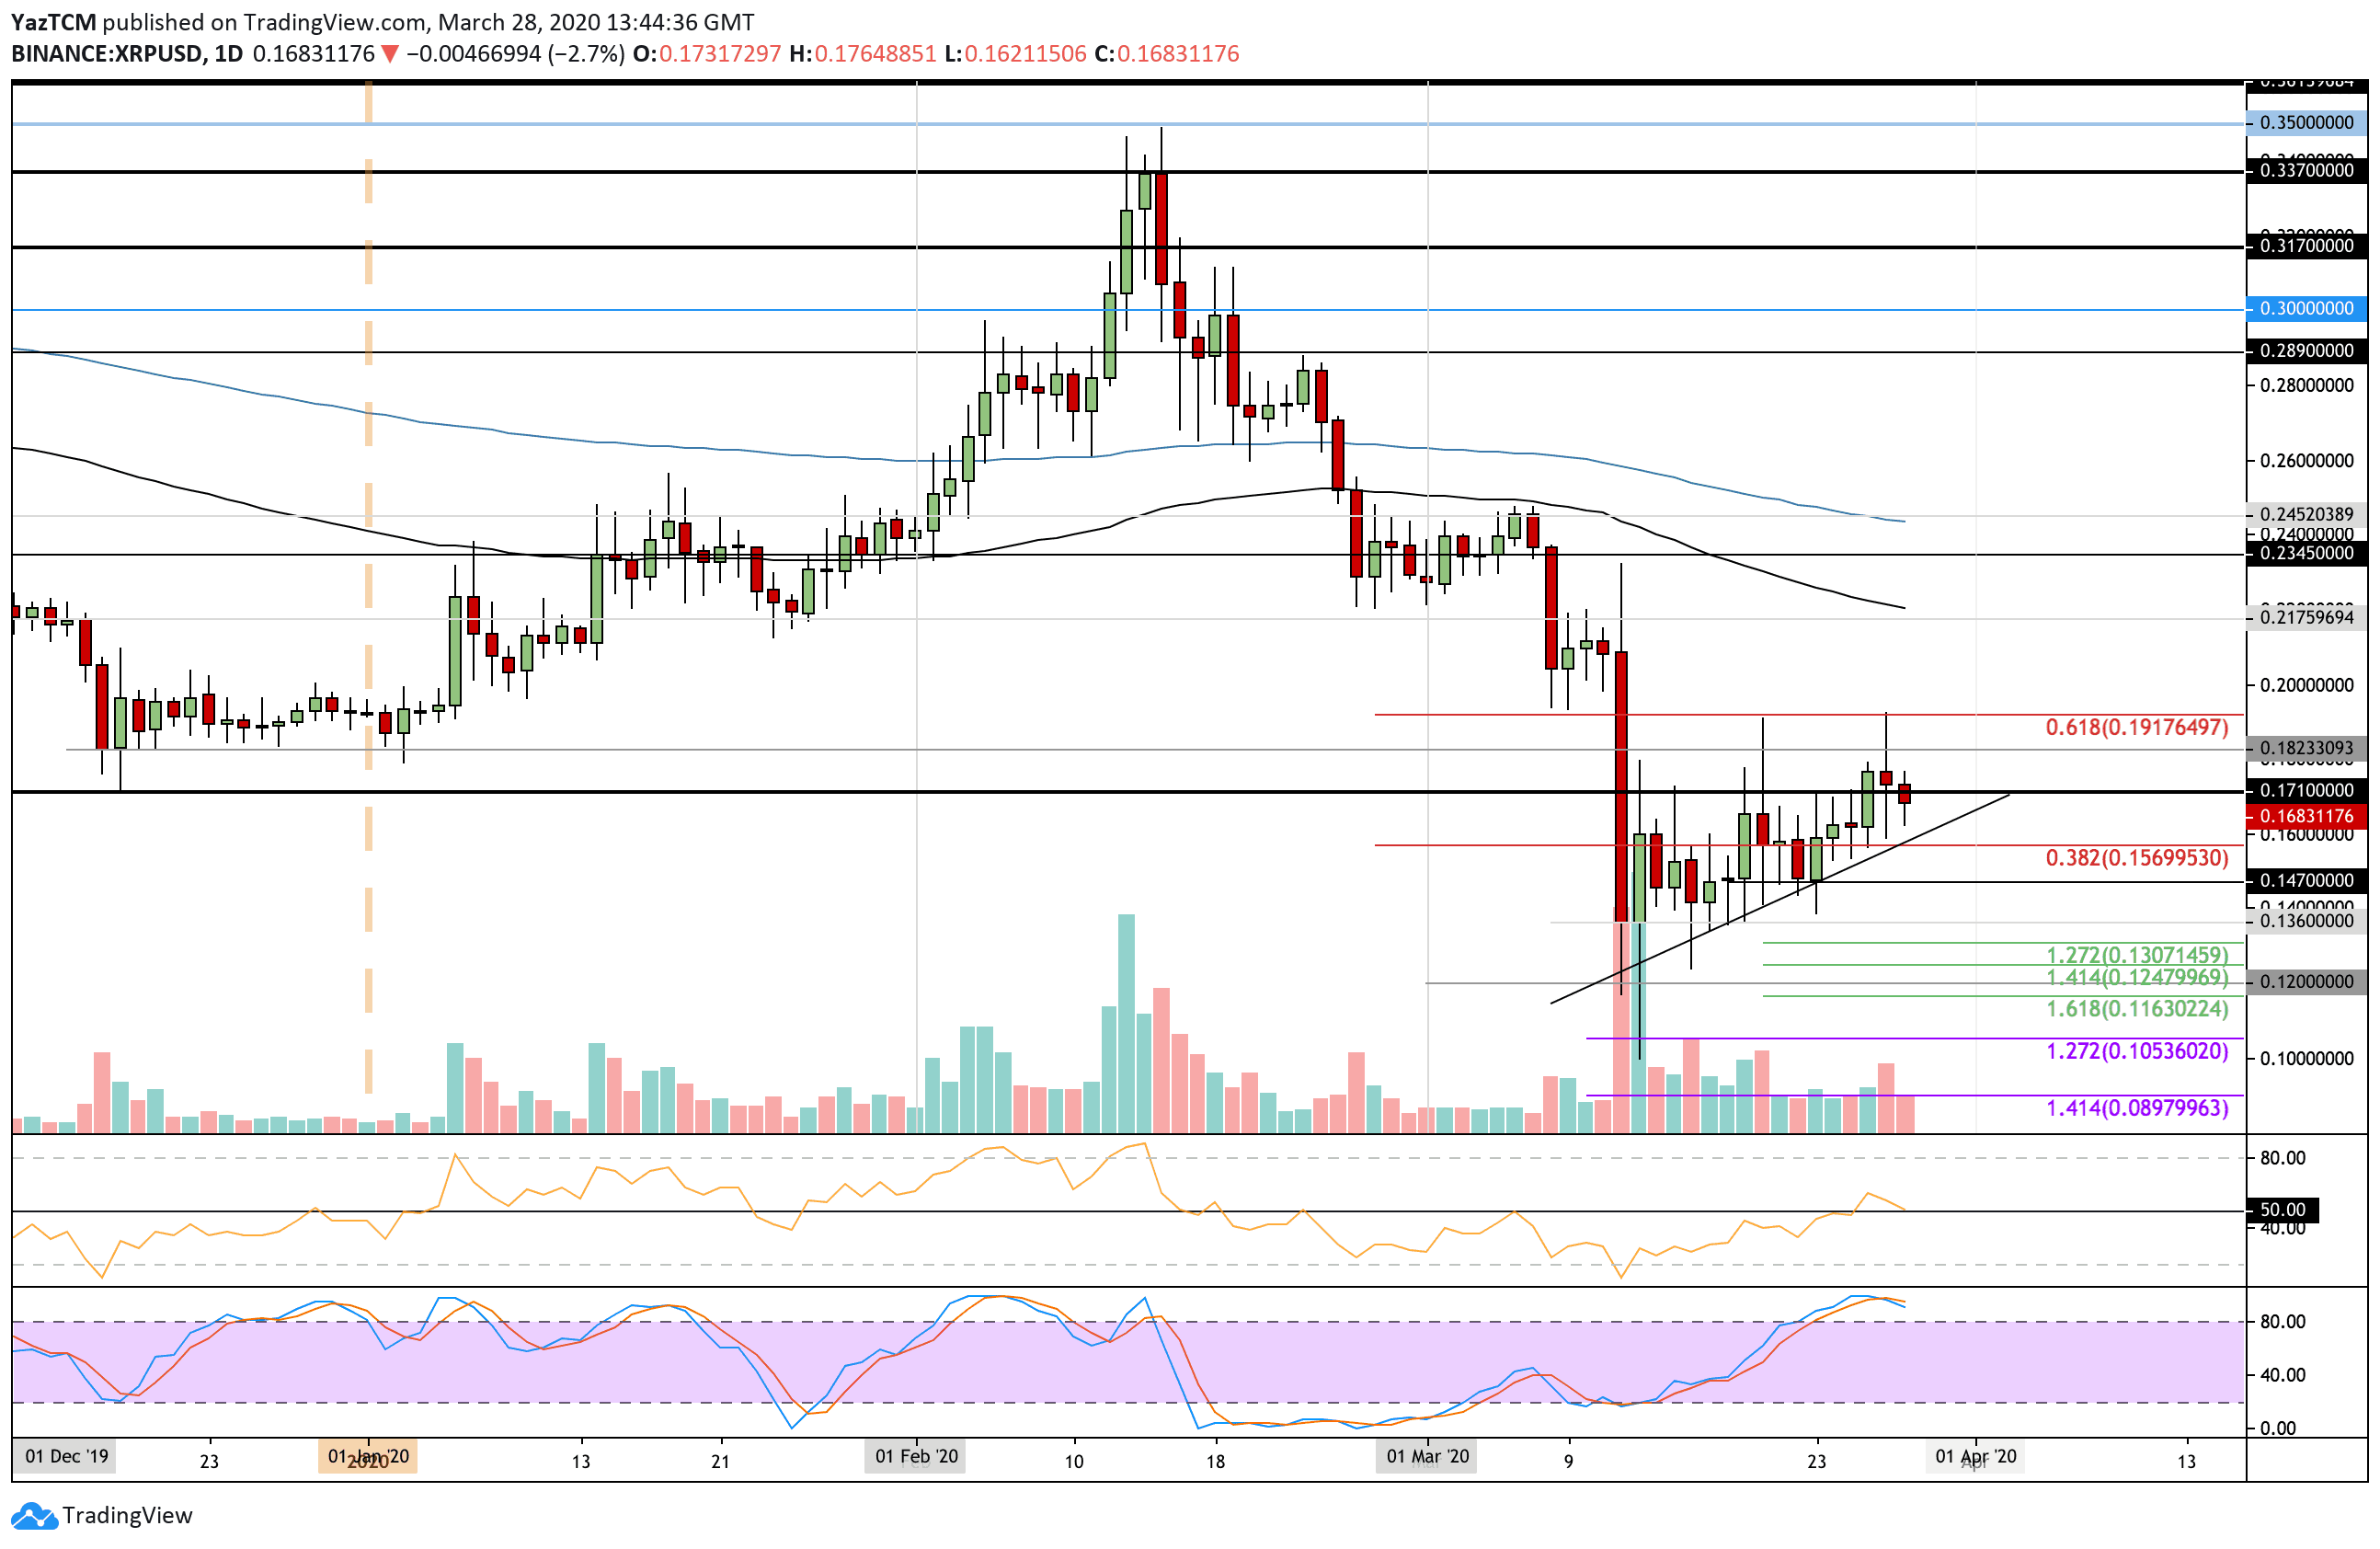
XRP/USD – Ripple Rise Stalled By Bearish .618 Fib Retracement.
XRP managed to break above the previous ascending triangle over the past 2-days but failed to climb above resistance at $0.191, which is provided by a bearish .618 Fib Retracement. At the time of this writing, XRP trades at $0.169.
The cryptocurrency is back beneath the previous strong resistance at $0.171 that it struggled with throughout the last fortnight.
XRP-USD Short Term Price Prediction
From above, the first level of strong resistance lies at $0.182. Above this, resistance lies at $0.191 (bearish .618 Fib Retracement), $0.20, and $0.218 (100-days EMA).
On the other side, the first level of support lies at the previous rising trend line. This is followed by support at $0.156, $0.147, and $0.136.
The RSI climbed above 50 but since dropped back to the mid-level. This shows that the bulls are still struggling to maintain any form of momentum within the market. A drop beneath 50 would show that the sellers have regained control and will likely send XRP beneath the trend line.
Additionally, the Stochastic RSI produced a bearish crossover signal that could potentially aid the selling scenario.
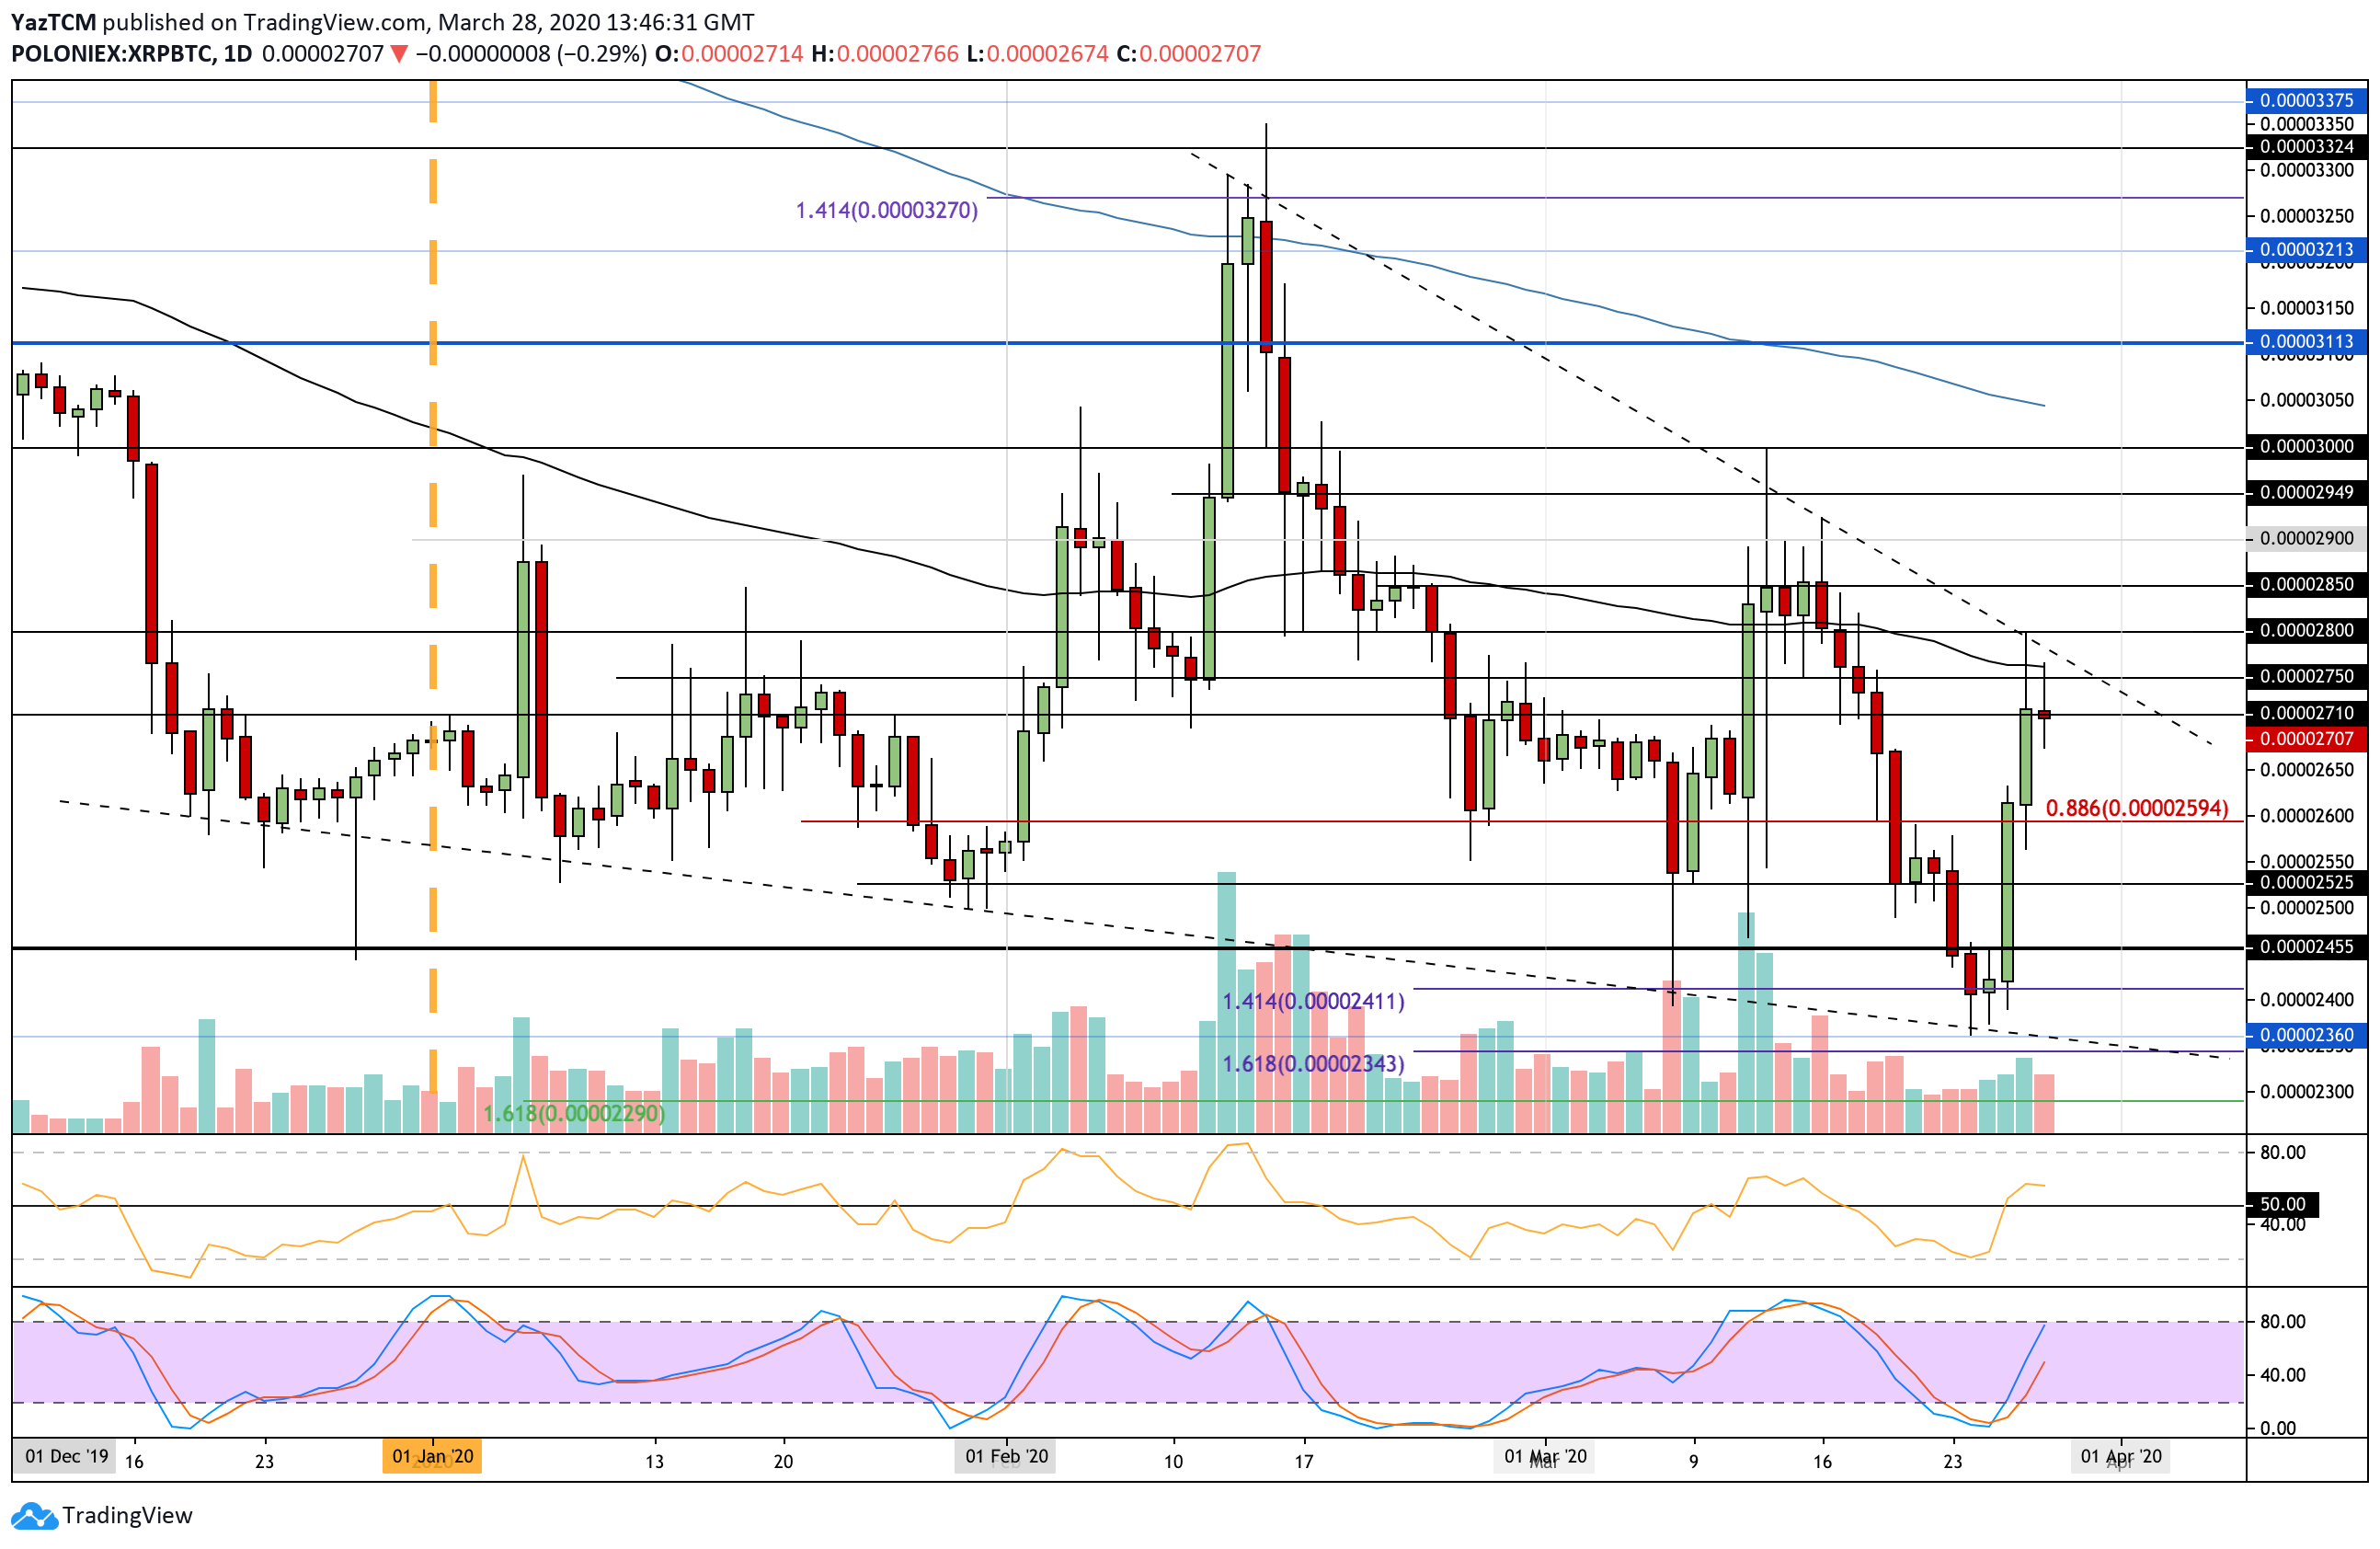
XRP/BTC: Ripple Rebounds Aggressively From 2020 Lows.
Against Bitcoin, XRP rebounded from the 2020 lows by 13% over the past 3-days to reach as high as 2800 SAT. It since fell lower as it trades at 2710 SAT resistance.
This bullish surge is what allowed XRP to rise against the USD to reach as high as $0.191. XRP will need to break and close above the 100-days EMA at 2760 SAT to allow the surge to continue.
XRP-BTC Short Term Price Prediction
From above, the first level of resistance is located at the 100-days EMA at around 2760 SAT. This is followed by resistance at the 2-month old falling trend line and 2800 SAT. Beyond this, resistance is expected at 2850 SAT and 2900 SAT.
Toward the downside, support is first located at 2650 SAT. Beneath this, support lies at 2600 SAT, 2525 SAT, and 2455 SAT.
The RSI recently broke above the 50 level to show that the buyers are starting to take control over the market momentum. It might dip a little lower, but if it can remain above 50, we can expect XRP to be headed back toward the 2850 SAT level.