XRP saw a 1% price increase today as it attempts to reclaim the %excerpt%.20 level.The cryptocurrency broke beneath the rising trend line but found support at a .382 Fib Retracement (%excerpt%.192).Against Bitcoin, XRP continues to struggle as it trades at just 2250 SAT, down from the 2750 SAT April high.Key Support & Resistance LevelsXRP/USD:Support: %excerpt%.192, %excerpt%.18, %excerpt%.175.Resistance: %excerpt%.20, %excerpt%.21, %excerpt%.215.XRP/BTC:Support: 2225 SAT, 2220 SAT, 2190 SAT.Resistance: 2260 SAT, 2300 SAT, 2360 SAT.XRP/USD: Ripple Attempts To Reclaim the %excerpt%.2 Level.For the first week of May, XRP was trading at resistance provided by the 200-day EMA at around %excerpt%.225. The coin was unable to break above this level and went on to roll over during the weekend when BTC dropped from ,600 to reach ,600.While falling, XRP broke
Topics:
Yaz Sheikh considers the following as important: Ripple (XRP) Price, XRP Analysis, xrpbtc, xrpusd
This could be interesting, too:
Jordan Lyanchev writes Ripple’s (XRP) Surge to Triggers Over Million in Short Liquidations
Jordan Lyanchev writes Trump Confirms Work on Strategic Crypto Reserve: XRP, ADA, SOL Included
Dimitar Dzhondzhorov writes Is a Major Ripple v. SEC Lawsuit Development Expected This Week? Here’s Why
Mandy Williams writes Ripple Releases Institutional DeFi Roadmap for XRP Ledger in 2025
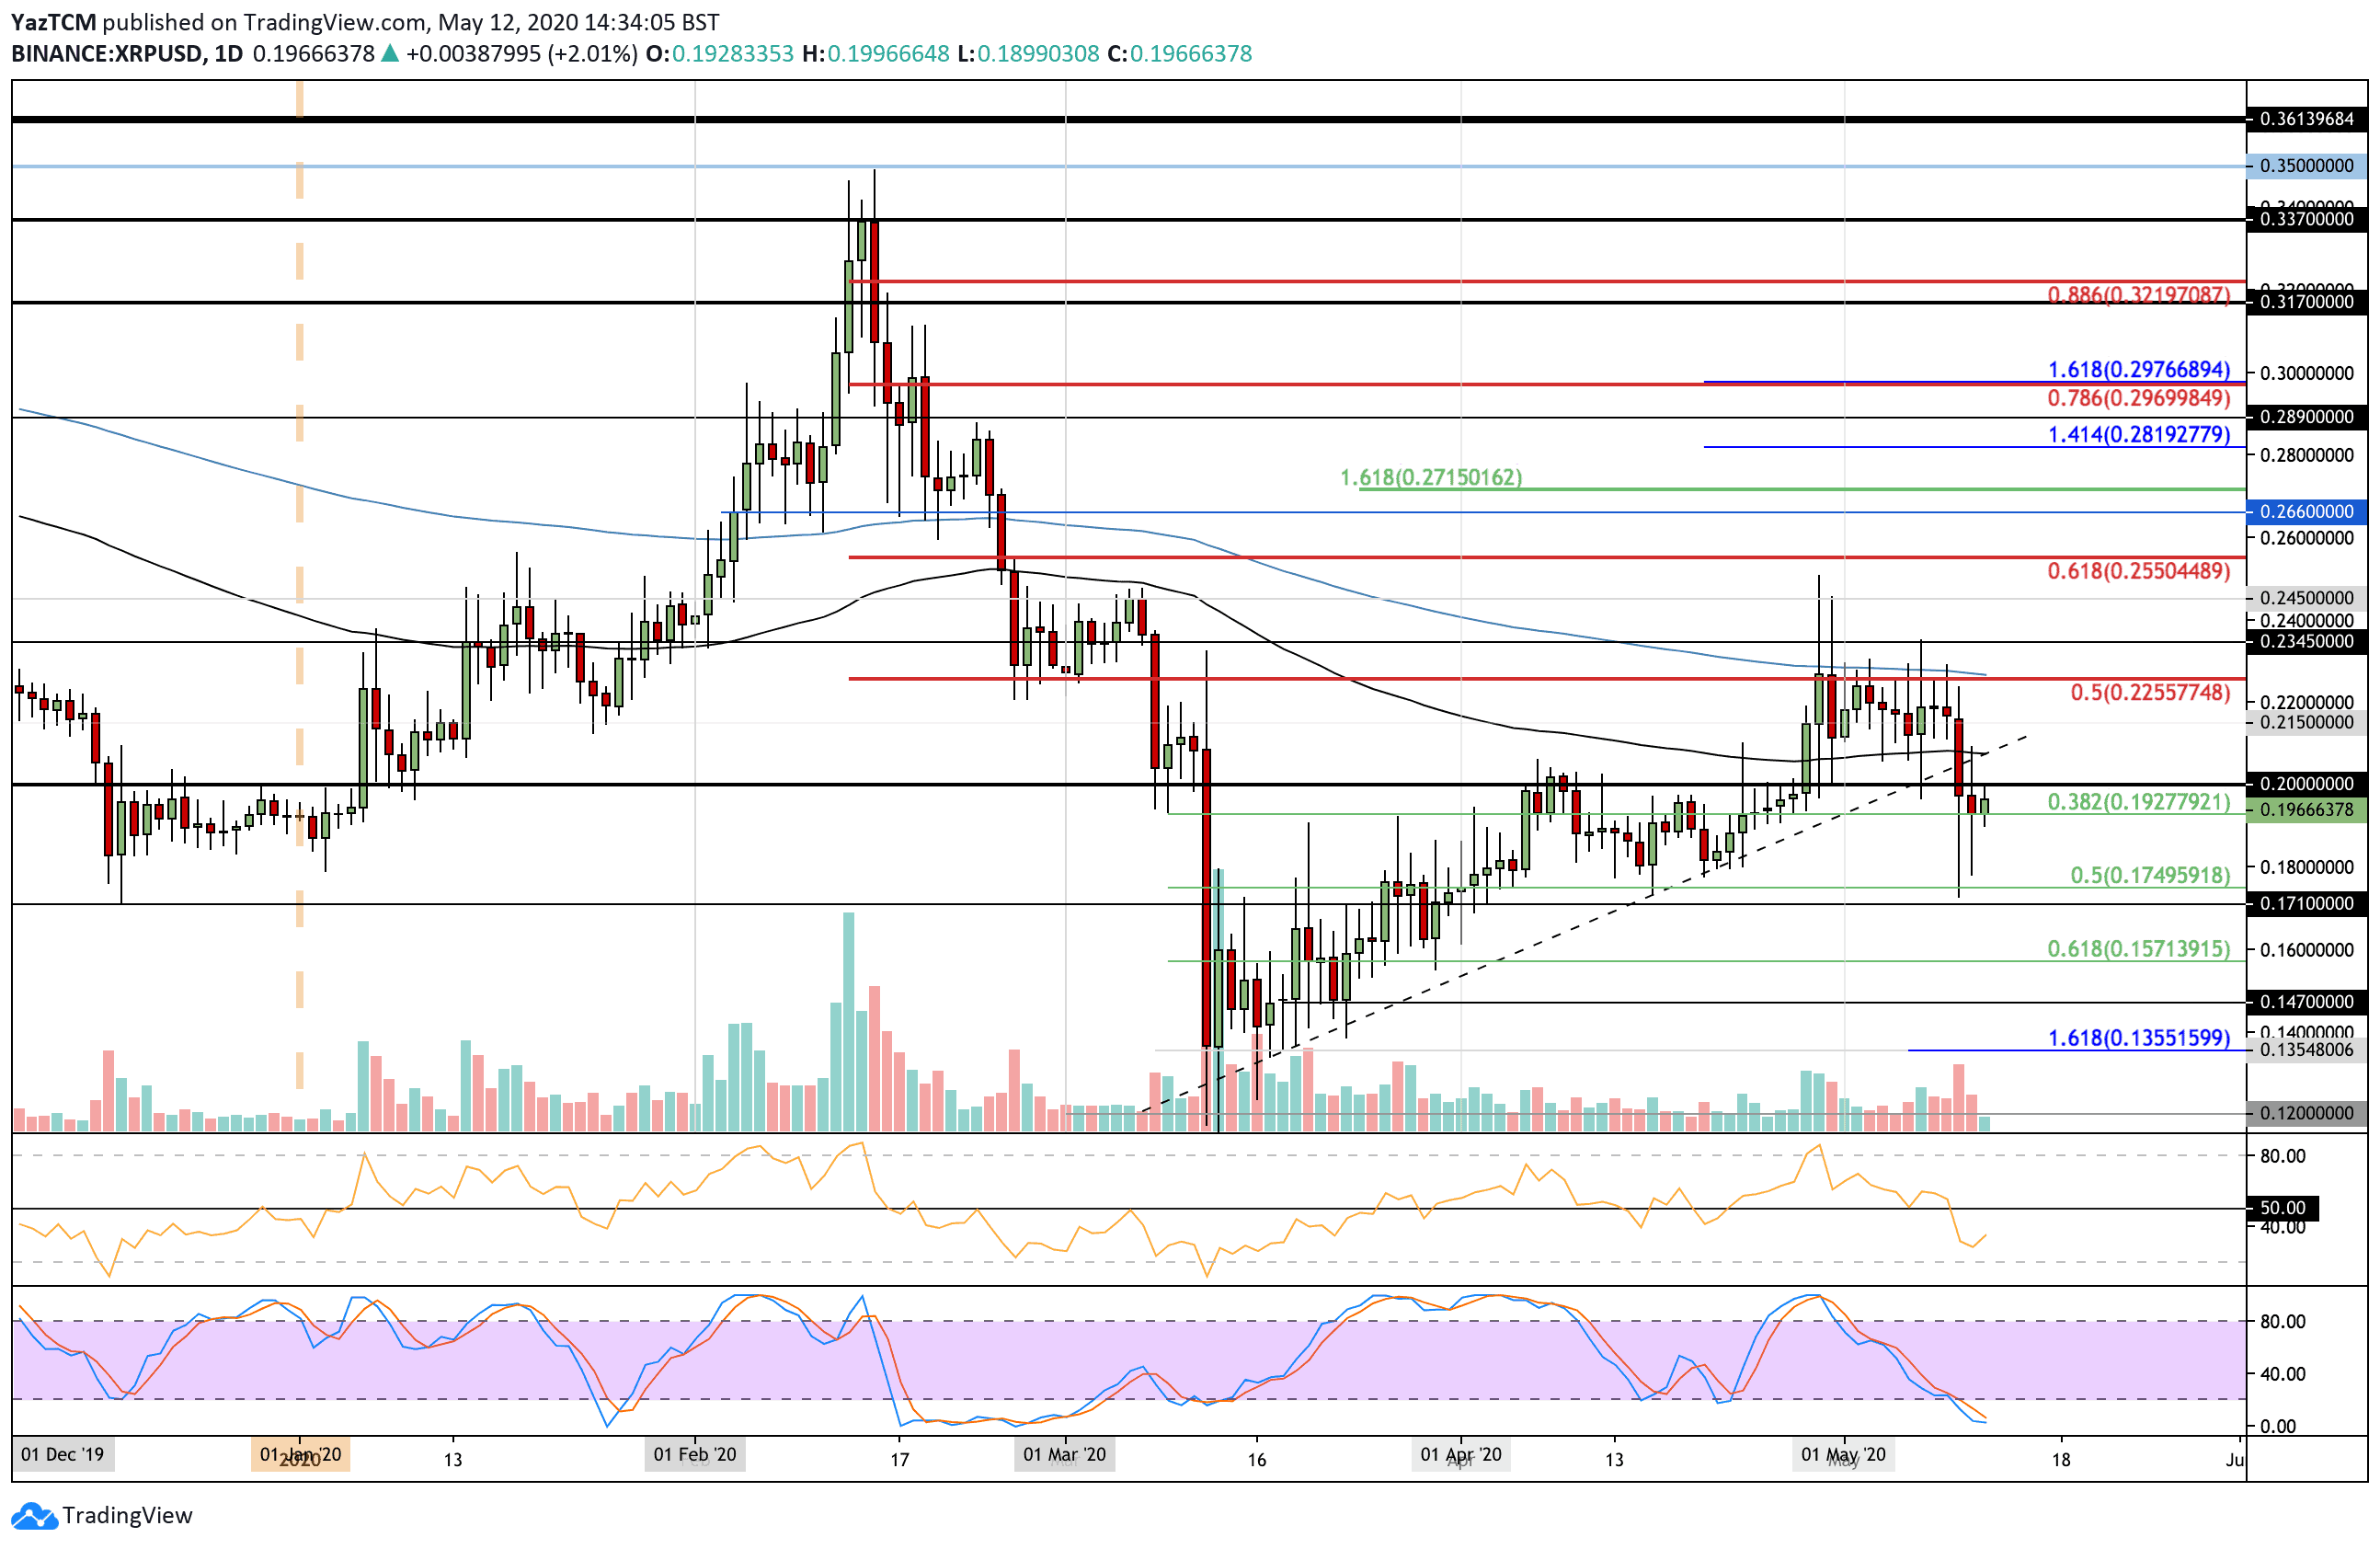
- XRP saw a 1% price increase today as it attempts to reclaim the $0.20 level.
- The cryptocurrency broke beneath the rising trend line but found support at a .382 Fib Retracement ($0.192).
- Against Bitcoin, XRP continues to struggle as it trades at just 2250 SAT, down from the 2750 SAT April high.
Key Support & Resistance Levels
XRP/USD:
Support: $0.192, $0.18, $0.175.
Resistance: $0.20, $0.21, $0.215.
XRP/BTC:
Support: 2225 SAT, 2220 SAT, 2190 SAT.
Resistance: 2260 SAT, 2300 SAT, 2360 SAT.
XRP/USD: Ripple Attempts To Reclaim the $0.2 Level.
For the first week of May, XRP was trading at resistance provided by the 200-day EMA at around $0.225. The coin was unable to break above this level and went on to roll over during the weekend when BTC dropped from $9,600 to reach $8,600.
While falling, XRP broke beneath the rising trend line that was in play since the March market collapse. Luckily, XRP found support at the .382 Fib Retracement level at $0.192. It did spike lower from there, but the bulls managed to regroup and pushed XRP higher to close above the aforementioned support.
It is now attempting to break back above the $0.2 level.
XRP-USD Short Term Price Prediction
If the bulls can reclaim $0.2 and push higher, the first level of resistance lies at $0.21 (100-days EMA). Above this, resistance lies at $0.215 and $0.225 (bearish .5 Fib Retracement & 200-days EMA). This is followed by added resistance at $0.234 and $0.24.
Alternatively, if the sellers push beneath $0.192, support lies at $0.18, $0.175 (.5 Fib Retracement), and $0.171.
The RSI dipped beneath the 50 line as the sellers took charge of the market momentum. To recover, the RSI must break back above 50. Additionally, the Stochastic RSI is in extremely oversold conditions and is primed for a bullish crossover signal.
XRP/BTC: Ripple Attempting To Recover From 2-Year Lows
Against Bitcoin, things have been pretty disastrous for XRP. Last week, the coin slipped beneath the 2020 support at 2360 SAT and dropped as low as 2191 SAT to create a new two year low against BTC.
XRP has attempted to recover from here over the past few days but seems to be struggling at the 2260 SAT level.

XRP-BTC Short Term Price Prediction
If the sellers start to push lower again, the first level of support lies at 2225 SAT (downside 1.272 Fib Extension). This is followed by support at 2200 SAT, 2190 SAT (downside 1.414 Fib Extension), and 2143 SAT (downside 1.618 Fib Extension).
On the other side, the first level of resistance lies at 2260 SAT. Above 2300 SAT, added resistance is located at 2360 SAT, 2400 SAT, and 2455 SAT.
The RSI has bounced from oversold conditions, which indicate that the bearish momentum may be fading. It would still need to rise above 50 to show the bulls are in charge. The Stochastic RSI produced a bullish crossover signal and, if it can follow through, this should push XRP/BTC higher.