XRP sees a 5% price increase today, bringing the cryptocurrency back above the %excerpt%.22 level.Against BTC, XRP has dipped lower as it breaks through the 2600 SAT support.The latest price increase is largely due to the fact that Bitcoin surged by over 6% in today’s trading session.Key Support & Resistance LevelsXRP/USDSupport: %excerpt%.21, %excerpt%.20, %excerpt%.1850 Resistance: %excerpt%.2283, %excerpt%.2345, %excerpt%.25.XRP/BTC:Support: 2600 SAT, 2350 SAT, 2455 SAT.Resistance: 2710 SAT, 2800 SAT, 2900 SAT.XRP/USD: XRP Bounces From %excerpt%.212, Can It Continue Above The 100-Days EMA?The daily chart above shows XRP bouncing at the %excerpt%.21 support level to climb higher above %excerpt%.22. It now faces resistance at the %excerpt%.228 level, which is provided by the bearish .382 Fibonacci Retracement.The market is still considered to be neutral until a
Topics:
Yaz Sheikh considers the following as important: Ripple (XRP) Price, XRP Analysis
This could be interesting, too:
Jordan Lyanchev writes Ripple’s (XRP) Surge to Triggers Over Million in Short Liquidations
Jordan Lyanchev writes Trump Confirms Work on Strategic Crypto Reserve: XRP, ADA, SOL Included
Mandy Williams writes Ripple Releases Institutional DeFi Roadmap for XRP Ledger in 2025
Jordan Lyanchev writes ChatGPT and DeepSeek Analyze Ripple’s (XRP) Price Potential for 2025
- XRP sees a 5% price increase today, bringing the cryptocurrency back above the $0.22 level.
- Against BTC, XRP has dipped lower as it breaks through the 2600 SAT support.
- The latest price increase is largely due to the fact that Bitcoin surged by over 6% in today’s trading session.
Key Support & Resistance Levels
XRP/USD
Support: $0.21, $0.20, $0.1850
Resistance: $0.2283, $0.2345, $0.25.
XRP/BTC:
Support: 2600 SAT, 2350 SAT, 2455 SAT.
Resistance: 2710 SAT, 2800 SAT, 2900 SAT.
XRP/USD: XRP Bounces From $0.212, Can It Continue Above The 100-Days EMA?
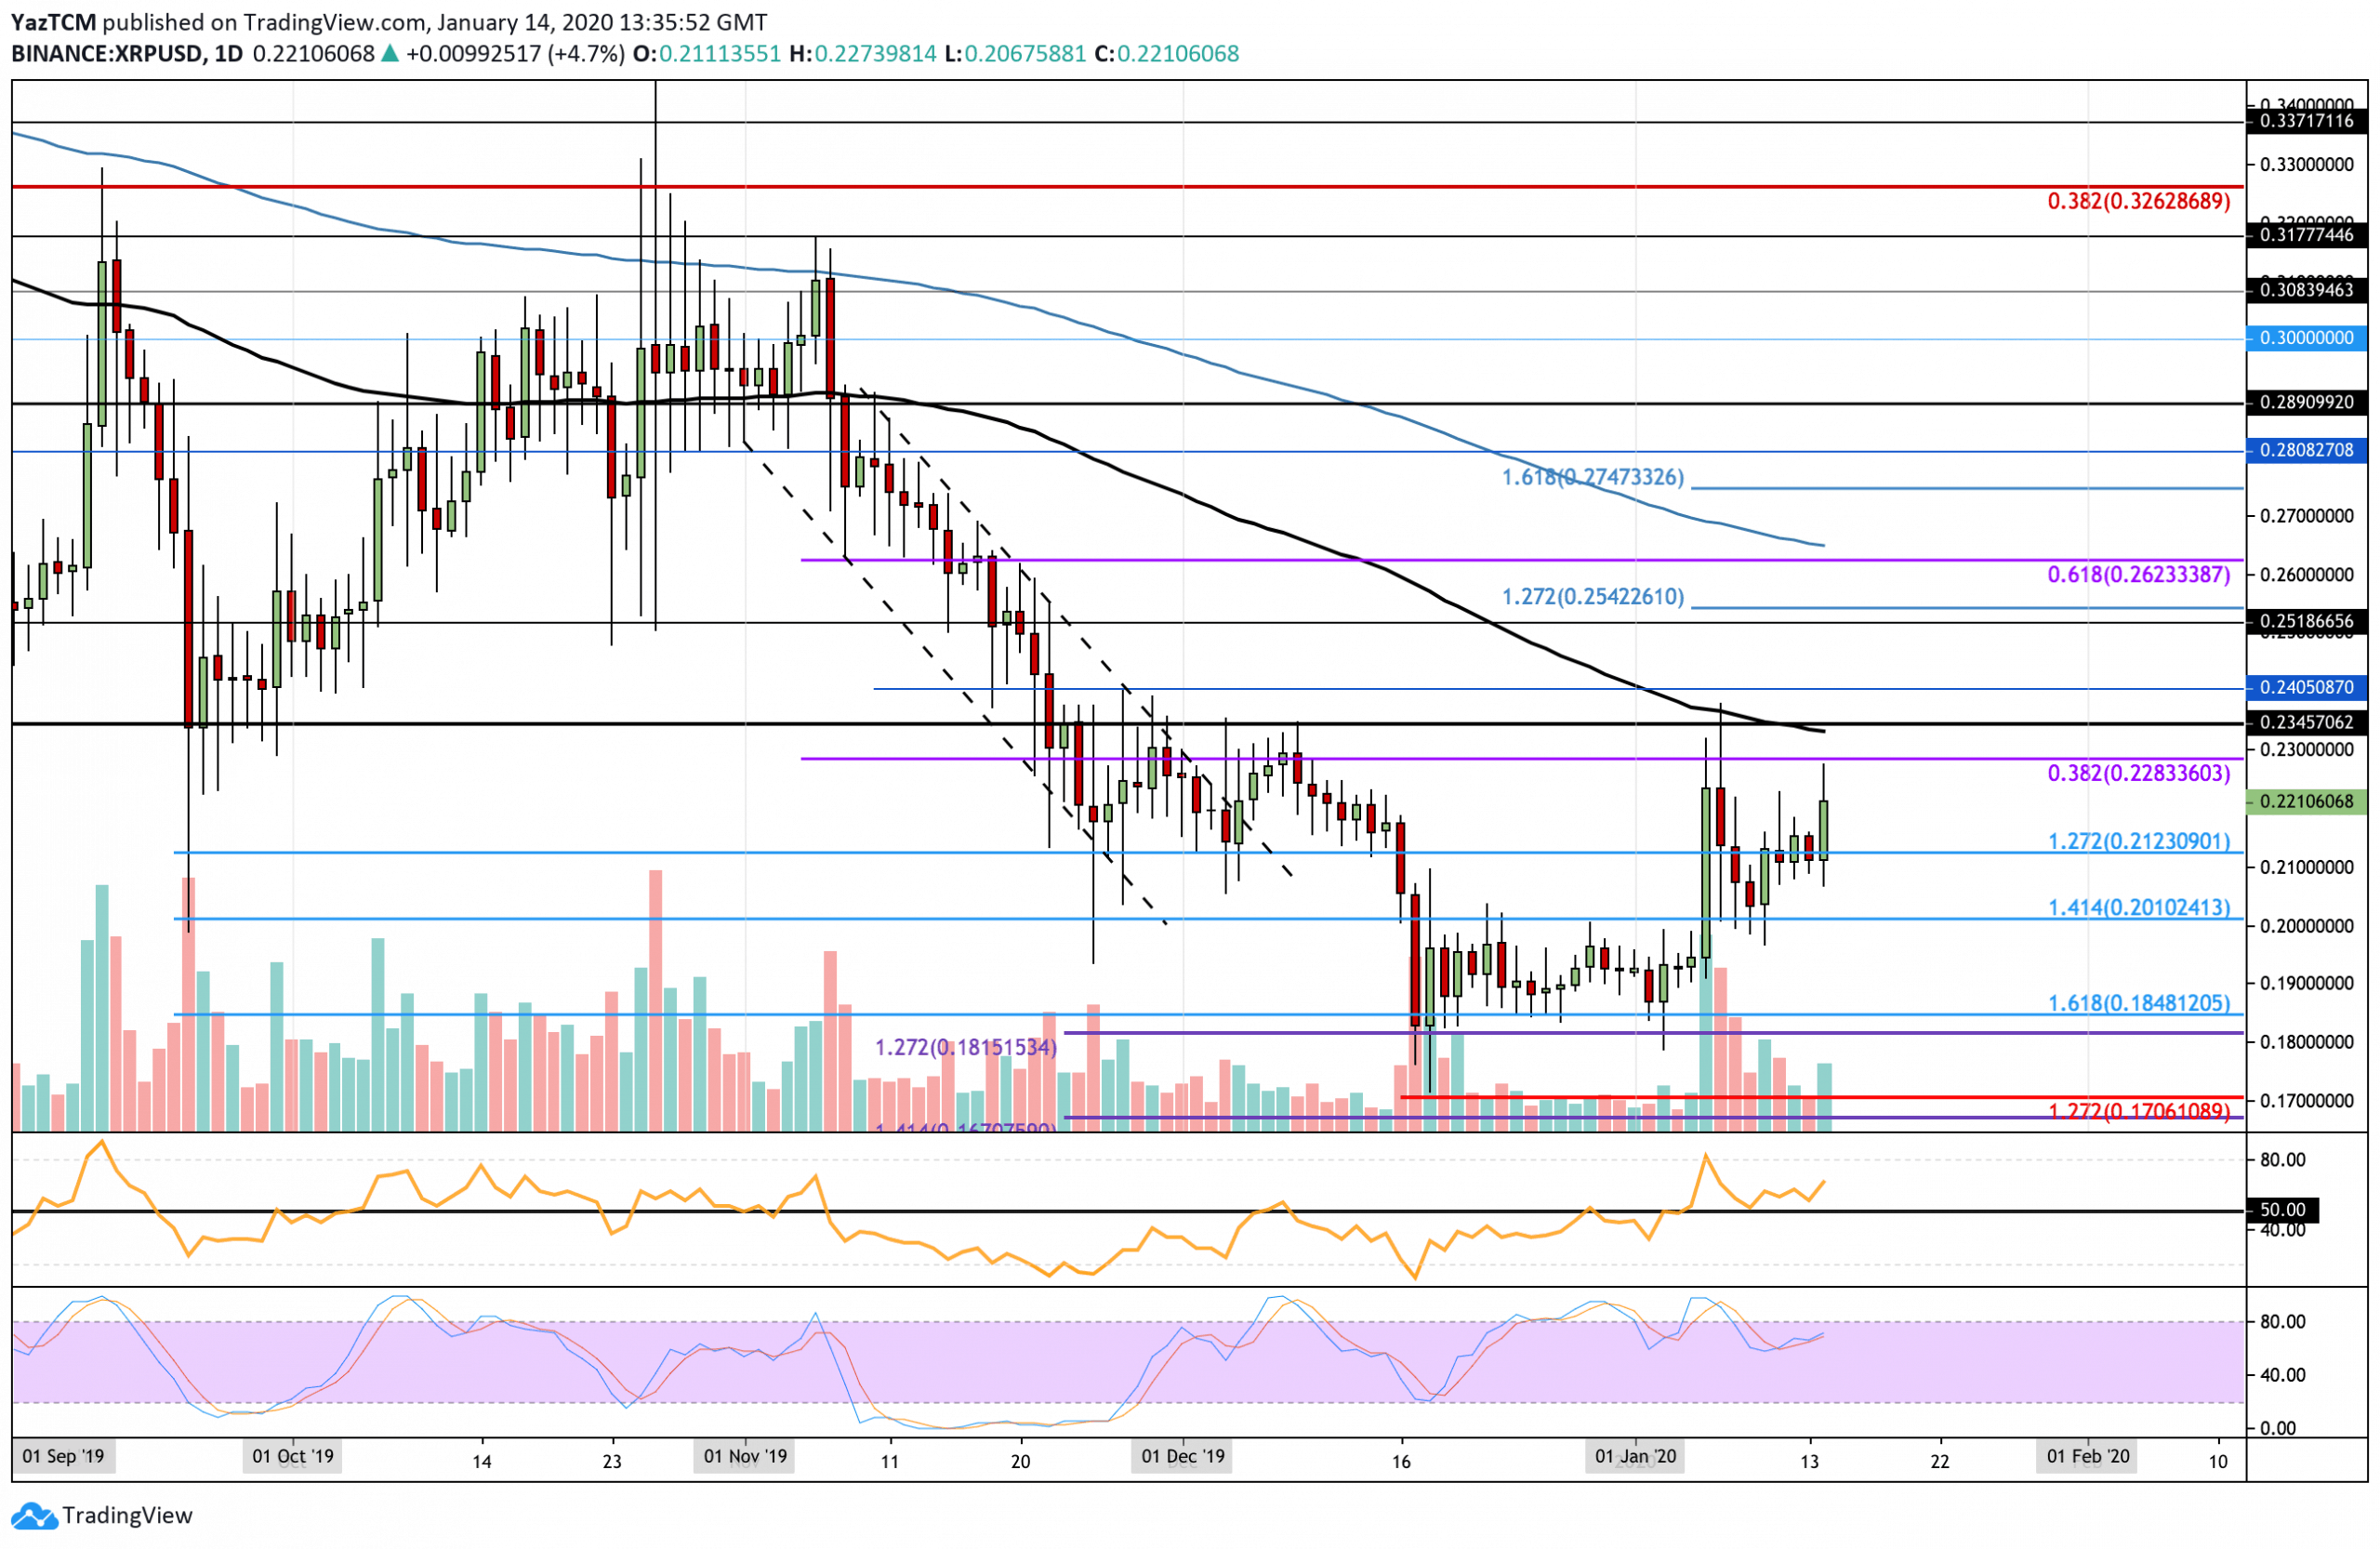
The daily chart above shows XRP bouncing at the $0.21 support level to climb higher above $0.22. It now faces resistance at the $0.228 level, which is provided by the bearish .382 Fibonacci Retracement.
The market is still considered to be neutral until a break above $0.235 (December highs). To turn bearish, XRP must fall and collapse beneath the support at $0.181.
XRP Short Term Price Prediction
If the bulls manage to break $0.228, immediate higher resistance is located at $0.235, which is the December 2019 highs. This area is further bolstered by the 100-days EMA, which lies at the same level. If the bulls can penetrate above the 100-days EMA, higher resistance lies at $0.24, $0.254 (1.272 Fib Extension), and $0.262 (bearish .618 Fib Retracement).
The RSI rebounded at the 50 level once again to show that the bulls still control the market momentum. The RSI is also rising, which shows that the bullish pressure is only getting started as it starts to increase. If the RSI can continue to rise higher, we can expect XRP to break the resistance at the 100-days EMA.
XRP/BTC: XRP Collapses Beneath 2600 SAT – Will It Create Fresh 2020 Lows?
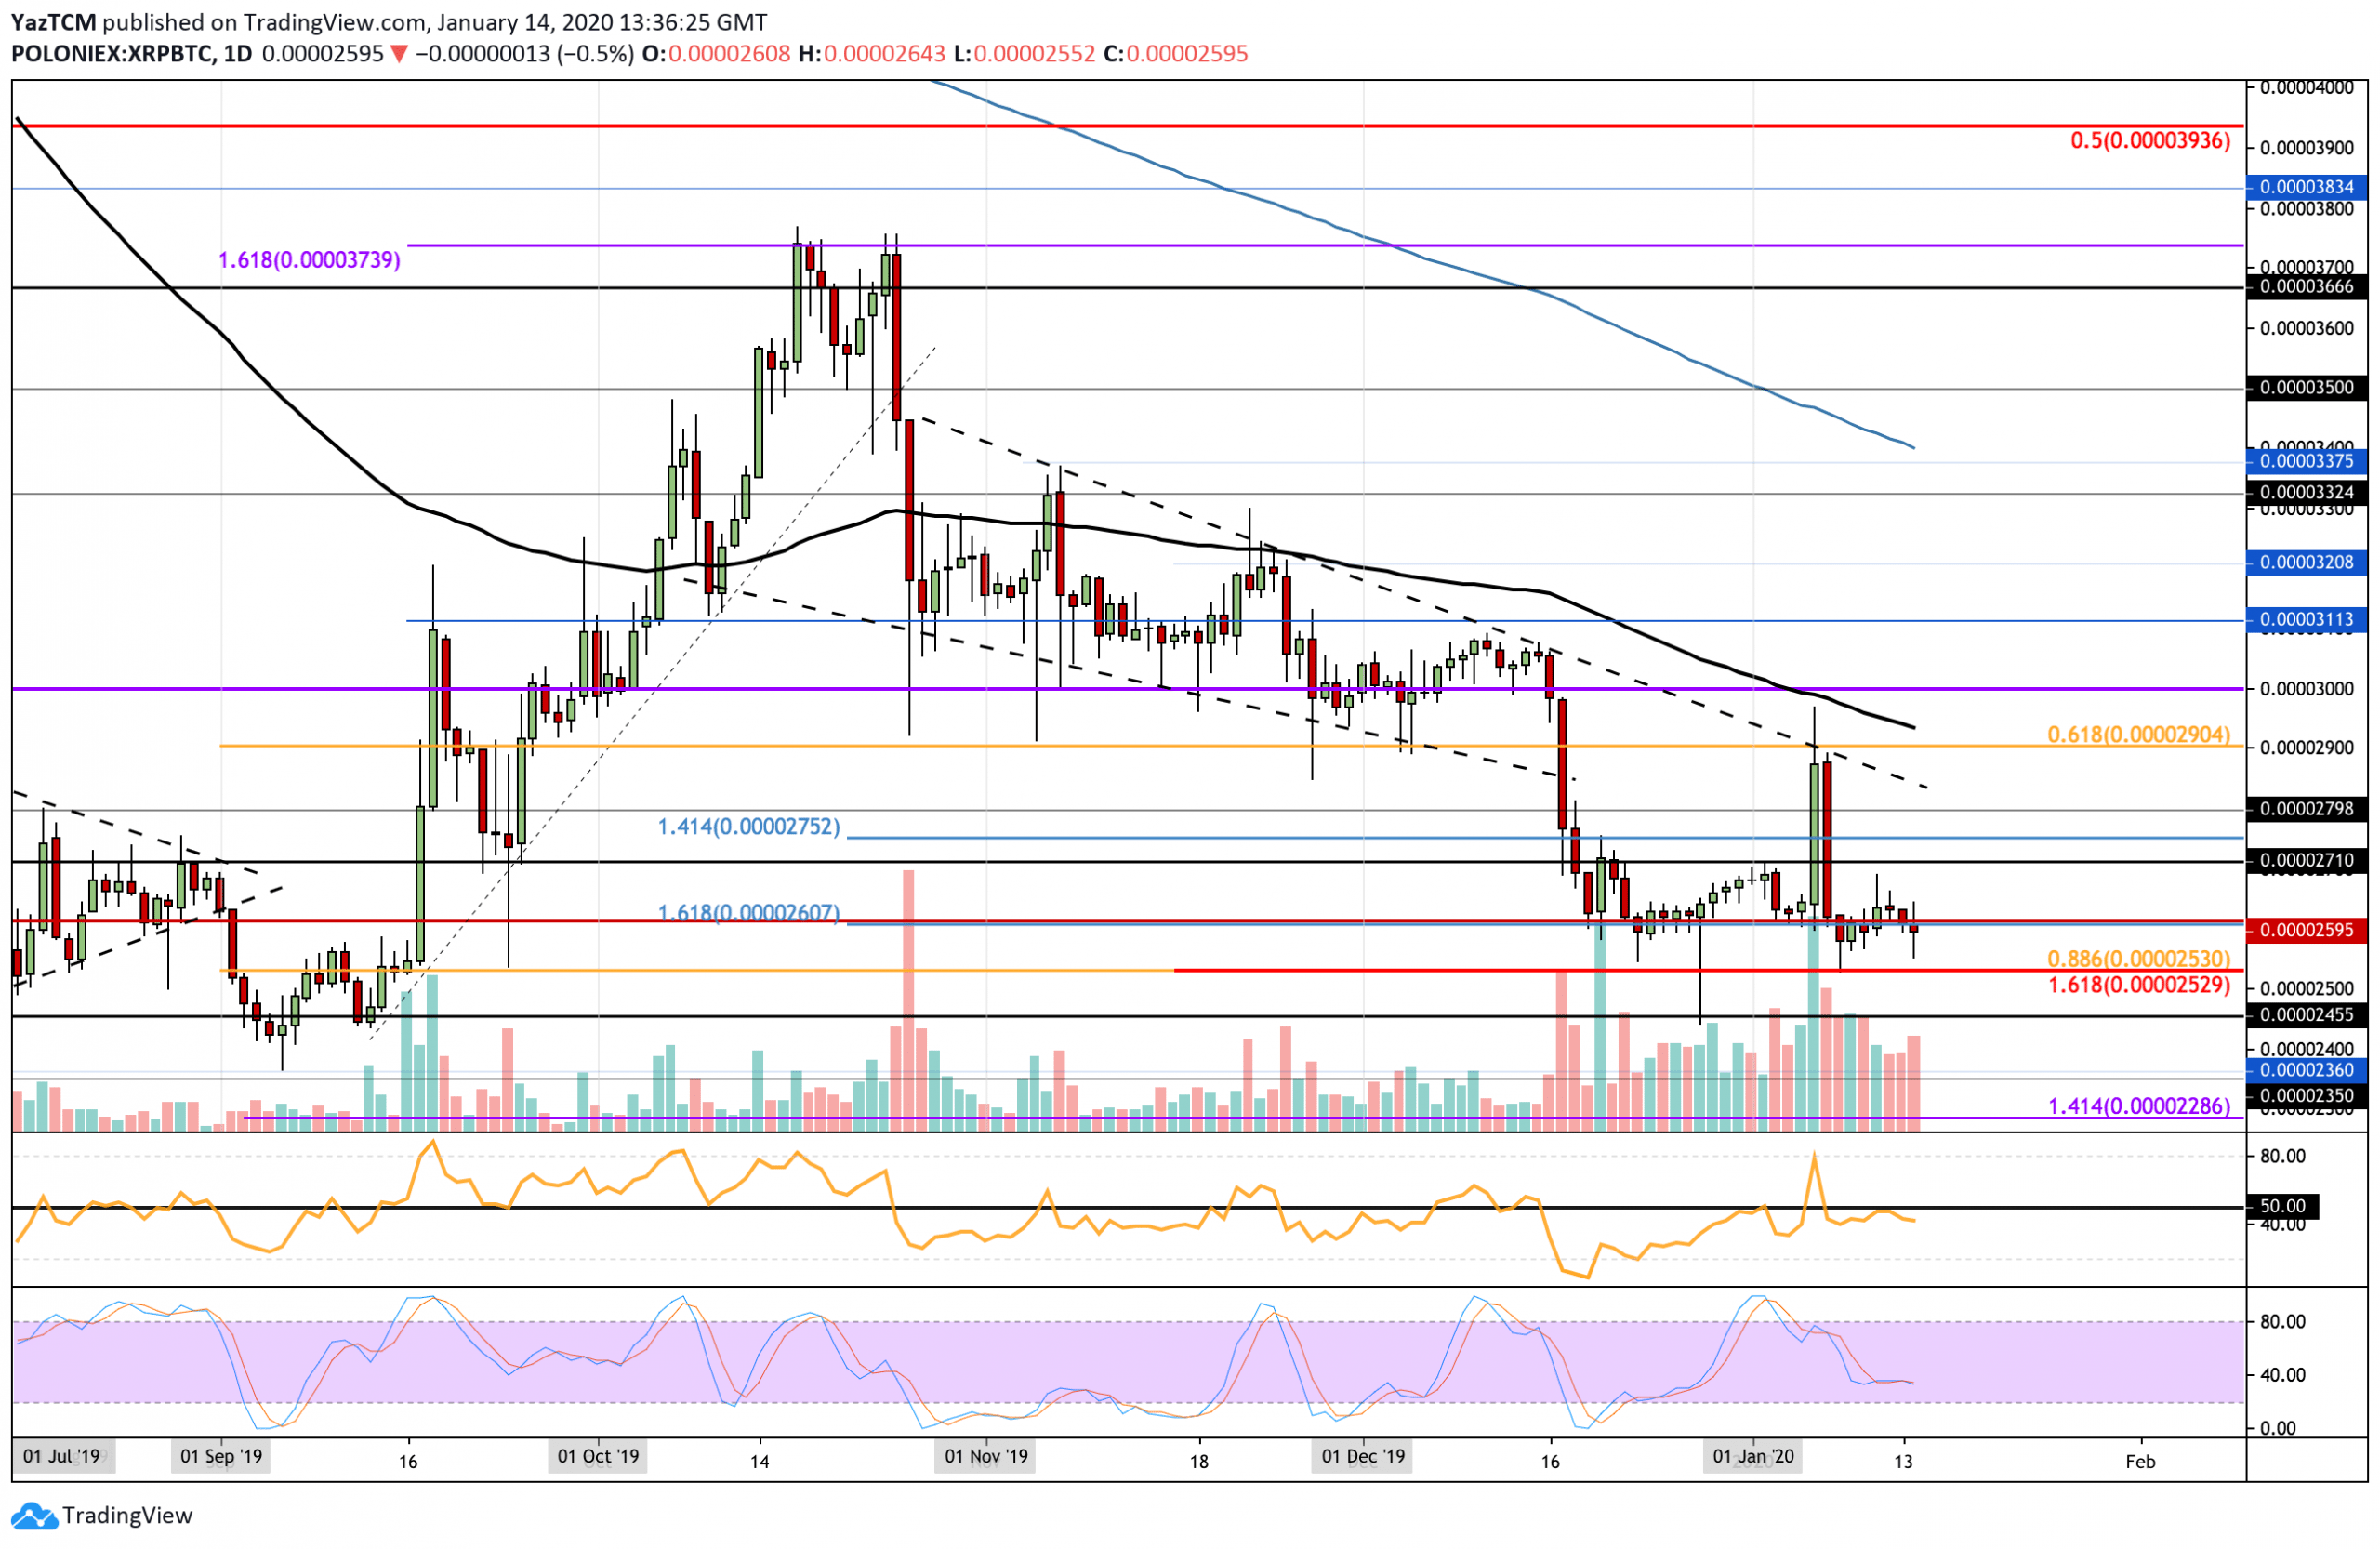
Against Bitcoin, XRP struggled to make any movement toward the 2700 SAT level and rolled over instead to drop beneath the support at 2600 SAT. The cryptocurrency is attempting to recover. However, the momentum lies within the favor of the bears at this moment in time.
XRP remains neutral at the moment, but a break beneath 2350 SAT would turn XRP bearish as a fresh 2020 low would be created. For XRP to turn bullish against BTC, it must rise and break above the resistance at 3000 SAT.
XRP Short Term Price Prediction
If the sellers continue to push XRP lower from the 2600 SAT level, initial support beneath is located at 2350 SAT (.886 Fibonacci Retracement level and 2020 low). Beneath this, additional support is found at 2455 SAT and 2400 SAT. On the other hand, if the bulls manage to push XRP back above 2600 SAT, higher resistance lies at 2710 SAT. Above this, resistance lies at 2750 SAT, 2800 SAT, and 2900 SAT.
The RSI remains beneath the 50 level, which shows that the sellers are still in charge of the market momentum. Itis also starting to point downward, which shows the selling pressure is only starting to pick up. For a recovery to be seen, the RSI must find its way back above the 50 level.